NIFTY Breakout + Goldman Sachs Upgrade = 29,000 Target?Hello Traders!
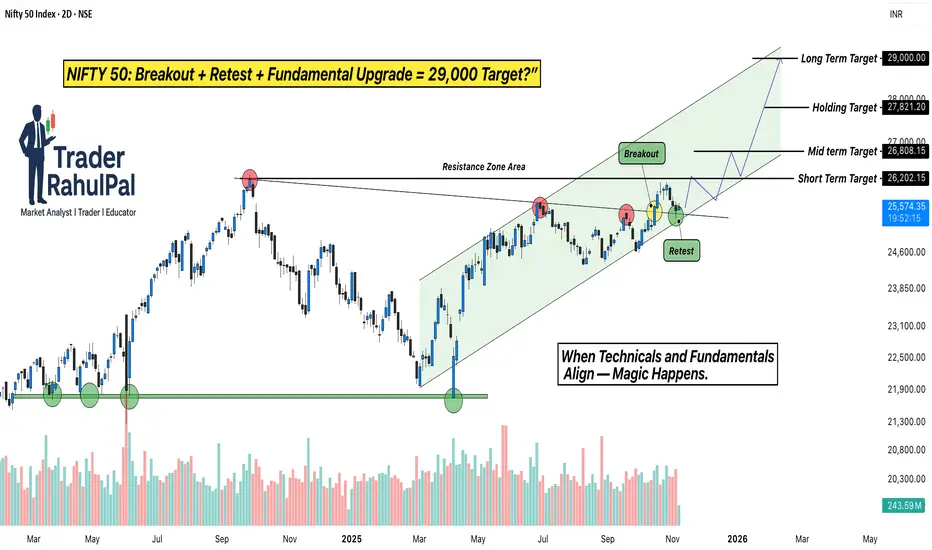
Today’s analysis is on NIFTY 50 Index, which has recently given a strong Breakout and Retest setup after months of consolidation. The index broke out from its Resistance Zone , retested the breakout area perfectly, and is now holding firmly inside a rising Trend Channel .
This move is not just technical, it’s being backed by major institutional optimism. According to a recent Goldman Sachs report , India’s stock market has been upgraded to “Overweight”, with NIFTY 50 projected to reach 29,000 by 2026 .
Why this setup is special?
Perfect breakout and retest structure with strong volume confirmation.
Channel trend remains intact, showing controlled accumulation at higher levels.
Institutional support from Goldman Sachs aligns with the technical breakout, adding conviction to the rally.
Levels to Track:
NIFTY is holding above the breakout zone near 25,000 , with immediate support seen at 24,600 . As long as the index sustains above this level, the short-term upside remains open toward 26,800 , followed by the next leg around 29,000 , matching Goldman Sachs’ longterm projection.
Rahul’s Tip:
When technicals and fundamentals align, the results are often explosive. A clean retest like this, supported by global institutional confidence, can lead to a powerful trend extension. Traders who position early usually ride the strongest part of the move.
(Analysis By @TraderRahulPal | More analysis & educational content on my profile. If this helped you, don’t forget to like and follow for regular updates.)
Disclaimer:
This analysis is for educational purposes only and should not be taken as financial advice. Please do your own research or consult your financial advisor before investing.
Positionaltrading
Smart Money Accumulating BDL — Are You Watching This Setup?Hello Traders!
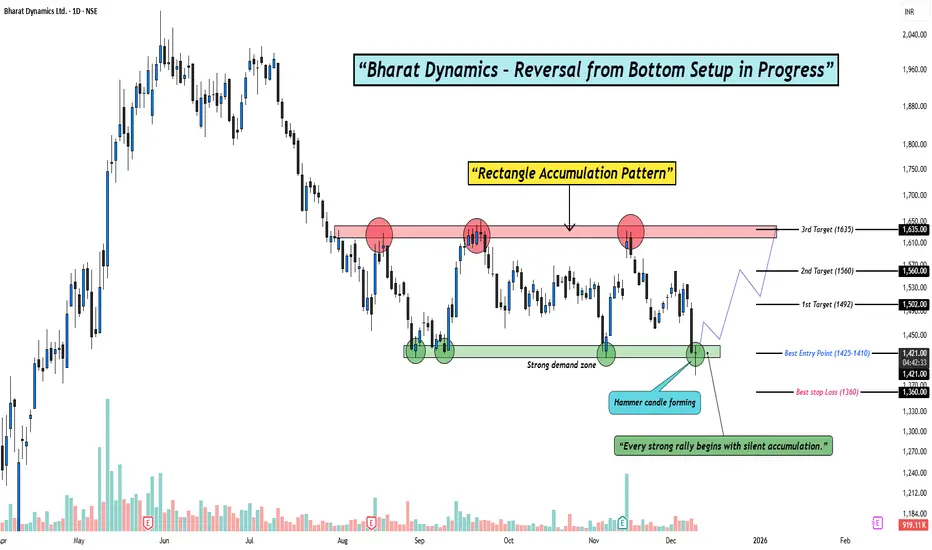
Today’s analysis is on Bharat Dynamics Ltd. (BDL) where a clear Reversal from Bottom Setup is developing. After weeks of sideways consolidation, the stock has formed a clean Rectangle Accumulation Pattern right above a strong demand zone. The latest Hammer candle appearing inside this zone adds strong confirmation that buyers are stepping in again.
Why this setup is special?
Multiple rejections from supply and repeated buying from demand create a classic accumulation range.
The recent hammer candle shows rejection of lower prices and signals potential reversal strength.
Sideways accumulation after a downtrend often leads to strong breakout rallies when demand overpowers supply.
Levels to Track:
The best entry zone lies between 1425–1410, aligning perfectly with demand. As long as price stays above 1360, the structure remains intact. On the upside, the first target sits near 1492, followed by 1560, and finally a breakout extension target around 1635, where previous supply reacts strongly.
Rahul’s Tip:
Every strong rally begins with silent accumulation. Patterns like this look slow at first, but once the breakout hits, momentum often surprises traders who were waiting too long.
(Analysis By @TraderRahulPal | More analysis & educational content on my profile. If this helped you, don’t forget to like and follow for regular updates.)
Disclaimer:
This analysis is for educational purposes only and should not be taken as financial advice. Please do your own research or consult your financial advisor before investing.
This Stupid Simple Strategy will help you become a better traderI make educational content videos for swing trading
Charts used are 3 months or older .

Don’t Miss This Rare MCX Setup Breakout + Retest= Big Move AheadHello Traders!
Today’s analysis is on MCX Ltd., where we just spotted a powerful Descending Triangle Breakout . After weeks of consolidation, the price has finally broken the falling resistance and even retested the breakout zone. This setup often leads to a strong trending move.
Why this setup is special?
Price respected support multiple times, showing heavy demand from lower levels.
Breakout + Retest makes it one of the most reliable continuation patterns.
Risk–Reward is highly favorable for both short-term and positional traders.
Levels to Track:
Currently, the best accumulation zone lies between 8000–8155 , which gives a low-risk entry point. On the upside, the immediate short-term target is around 8446 , while the medium-term level aligns with the previous ATH near 9115 . If momentum sustains, the stock even has potential to reach the positional target of 9774 . For risk management, traders can keep a short to medium-term stop loss at 7788 , while positional traders may consider a wider SL at 7522 .
Rahul’s Tip:
Such breakouts don’t come often. Once the retest is done, the real rally usually begins. Traders who wait too long often end up chasing the move at much higher prices.
If you want to catch these setups before they take off, make sure you follow closely — (Analysis By @TraderRahulPal, TradingView Moderator). More analysis & educational content is shared regularly on my profile. Sometimes one breakout can change your trading month completely. If this helped you, don’t forget to like and follow for regular updates.
Disclaimer:
This analysis is for educational purposes only and should not be taken as financial advice. Please do your own research or consult your financial advisor before investing.

When to Exit a Trade: Exit Plan for Every Trading Style!Hello Traders!
Every trade type needs a different kind of exit plan — but most traders use one-size-fits-all. That’s why they either exit too soon or too late.
Today, I’ll break down how to plan your exits based on trade type and intention .
A smart exit plan fits the nature of the trade — not just your emotion in the moment.
Exit Plan for Swing Trades
Target Based: Pre-decide 1:2 or 1:3 risk-reward levels.
Trailing SL (Candle Based): Move SL below each higher low in uptrend.
Exit on Structure Break: If price breaks key swing low, exit immediately.
Exit Plan for Positional Trades
Weekly Chart View: Exit only if weekly trend changes or closes below trendline.
Partial Booking: Book some profits at resistance zones, hold rest for trend continuation.
News/Events SL: Avoid holding through uncertain events unless strategy-backed.
Exit Plan for Long-Term Trades (Investment Trades)
Fundamental Exit: Exit only if company fundamentals weaken or story changes.
Valuation-Based Exit: Exit when valuations are stretched beyond long-term average.
Exit in Phases: Don’t exit fully — scale out in parts across 10-20% intervals.
Exit Plan for Breakout Trades
Multi-Year Breakout: Hold till price holds above breakout zone on weekly chart.
2-Week Breakout: Use previous resistance as SL. Exit if it fails to sustain above it.
Volume Confirmation: Exit if breakout happens on weak volume and fails to follow through.
Exit Plan for Options Trades
Defined SL in Premium: Keep strict SL (e.g., ₹30 loss on ₹100 premium).
Time-Based Exit: Exit if expected move doesn’t come by your time window.
Theta Decay Watch: Exit early if holding beyond 2–3 days and premium drops without move.
Momentum Exit: Trail SL tightly once premiums start shooting.
Rahul’s Tip
Don’t treat every trade the same. Swing, positional, long-term — each needs its own exit discipline.
Your plan should depend on chart timeframe, reason for entry, and trade type — not just emotions.
Conclusion
Your exit strategy should match your trade type, not just your mood.
Once you start using the right exit logic for the right trade, your results will become more consistent, more powerful, and way less stressful.
Thanks for reading!
If this helped bring clarity, do like, share and follow for more trading insights made simple.

Is Dabur on the Verge of a Big Move? The Chart Holds the Answer!Hello Everyone!
I hope you all are doing great in life and in your trading journey! Today, I’ve brought you a stock that’s as sweet as honey. Yes, you guessed it right, I’m talking about India’s best honey and Ayurvedic products selling company — DABUR.
Dabur has always been known for its strong product lineup in the FMCG sector, with their products being staples in every Indian household. Let's dive into the technical setup and trading idea for Dabur and see if it's ready to provide us with some sweet returns!
Looking at the weekly chart of Dabur India Ltd., the stock has been showing clear price action within well-defined zones. Currently, Dabur is testing a historically strong support zone around the 510-495 range, a level that has previously acted as a reliable bounce area. This zone is crucial to watch, as a hammer candle has formed at this support, signaling a potential bullish reversal . If this support holds again, it could provide a strong buying opportunity.
The strong resistance zone near 660 marks the final target for this move, with a possible upside of around 37.94% . The stock is also showing potential for a swing trade as it approaches a reversal from the support. Keep an eye on price action around these levels to manage your risk effectively.
Disclaimer:- This analysis is for educational purposes only. Please trade responsibly and consult a financial advisor before making any decisions.
If you found this analysis helpful, don’t forget to like, follow, and share your thoughts in the comments below! Your support keeps me motivated to share more insights. Let’s grow and learn together—happy trading!

"Budget 2025: Don’t Miss This High-Potential Railway Stock!"Hello Everyone, I hope you all are doing great! Today, I’ve brought you a stock that’s catching my attention both technically and fundamentally . This setup looks solid for short-term opportunities and has the potential to deliver significant gains over the long term as well. Stock name is RVNL and it is trading in a Descending Channel Pattern , and the price is currently near a critical support zone around 395-415 . This level is supported by a Bullish Harami candlestick pattern , which is a strong reversal signal. Additionally, the previous resistance zone has turned into support , adding credibility to the bullish outlook.
Last breakout above 355 resulted in an 83% rally to 647. If history repeats, a breakout above 510 could trigger a similar 83% move, targeting 947 in the long term. This aligns with strong fundamentals and Budget 2025’s expected focus on infrastructure spending.
Volume and Indicators:- Significant volume spikes at the support zone indicate institutional buying interest , which adds strength to the current level.
MACD is in the negative zone but showing signs of flattening, which could indicate a potential momentum reversal.
Fundamental Catalyst:- RVNL holds a pivotal role in transforming India's railway infrastructure , making it a prime beneficiary of Budget 2025 . The government ’s focus on infrastructure spending is likely to act as a positive catalyst, supporting the stock’s long-term growth potential.
Conclusion:- A breakout above 510 could unlock significant upside potential, aligning with both technical and fundamental perspectives. Traders should watch for a sustained move above 510 for confirmation of bullish momentum.
Disclaimer:- This analysis is for educational purposes only. Please trade responsibly and consult a financial advisor before making any decisions.
If you found this analysis helpful, don’t forget to like, follow, and share your thoughts in the comments below! Your support keeps me motivated to share more insights. Let’s grow and learn together—happy trading!

Neat & Clean Cup and Handle Pattern Breakout seen in INOXWINDHello everyone i have brought a stock which has given a breakout of Continuation pattern which called Cup and Handle Chart Pattern. Stock name is INOXWIND.
Inox Wind Limited is a part of the Inox Group. The company is engaged in the business of manufacturing Wind Turbine Generators (WTGs) and is a wind energy solutions provider servicing IPPs, Utilities, PSUs, Corporates and Retail Investors. Inox Wind Ltd is a fully integrated player in the wind energy market and provides end-to-end turnkey solutions.
Note:- Technically chart is looking bullish as it has given breakout of Cup and Handle pattern but fundamentally i have not find that much attractive, so i am not advising this stock for long term type, my view here is only for short term. Please follow strictly stop loss in this.
Let's learn about this pattern (Cup and Handle)
Q:- What is Cup and Handle Pattern?
Ans:- It is a bullish continuation pattern that occurs in an uptrend and signals that the price of the stock will continue to trend higher on completion of the pattern. The pattern gets its name from its shape which resembles that of a conventional tea cup with a handle. It is one of the most occuring pattern used across the world to spot dominant uptrend for taking long positions.
Q:- How to take entry and exit and where to keep stop in this Chart pattern?
Ans:-Entry Point: Place the trade when the price rises above the handle created resistance level. This breakout confirms the pattern and indicates the resumption of the uptrend.
Stop Loss and Take Profit: Set a stop-loss order below the handle’s support level to limit potential losses. Determine a take-profit level by measuring the depth of the cup and adding it to the breakout point.
Volume Confirmation: Keep an eye on volume during the breakout. Higher trading volume should accompany the breakout, indicating strong buying interest and validating the pattern’s reliability.
Monitor Price Action: Continuously monitor the price action after entering the trade. Consider trailing your stop loss to protect profits and adjust your take-profit target if necessary.
Disclaimer:- Please always do your own analysis or consult with your financial advisor before taking any kind of trades.
Dear traders, If you like my work then do not forget to hit like and follow me, and guy's let me know what do you think about this idea in comment box, i would be love to reply all of you guy's.
Thankyou.

RICOAUTO Analysis & Prediction This is the analysis of RICOAUTO in Monthly Time Frame. Watch carefully. The chart explains itself. The stock may retest the breakout level again.
There are some prediction levels. These Levels act as Support and Resistance according to position of price. You have to trade according to level breakout or breakdown.
Always maintain your risk management.
Book your profit according to your “STOMACH”.
Disclaimer:
This is not investment advice. I am not a SEBI Registered Analyst. Anything posted here is my own analysis and views. This is created for educational purposes only. Always consult your Financial Advisor before taking any decision or trade.
Happy trading.
About RICOAUTO :
Rico Auto Industries Ltd. engages in the manufacturing and assembling of automotive components for the automotive industry. Its products include oil pump assembly, fuel system parts, center housings, back plates, oil pan, front cover, main bearing caps, and brake discs. The company was founded in 1984 and is headquartered in Gurugram, India.

Market wait to decide trend. Weekly closing around crucial level
The weekly chart of the market has closed around an interesting resistance zone. Even RSI indicator is showing some strength but price action needs to confirm.
Fibonacci Golden Ratio is also in sink with the resistance zone and on the contrary it took support on the weekly charts from the major trend Golden ratio.
There is a confusion as both the indices are showing some gap and they will pull each other.
If nifty keeps it rally and banknifty sustain and starts trading above the resistance zone, banknifty will reached new ATH.
In case banknifty face rejection from these levels and starts trading below the weekly 20 EMA, it will pull bank nifty.
There will be a double bottom probability around the support zone or a M pattern formaiton on the weekly charts.
This week need to close above 47300 levls to prove its bullish, else have to wait for another week on the positional trade.
If the market moves sideways, some good entries and exits can be taken from these zone.
Monthly candle close is still in between. Next week clear monthly view can be seen.
High probability of market deciding the trend is there in this week.
Positional trades from the next month expiry may be triggered this week as per the price action formation.

INDIANB Analysis & PredictionThis is the analysis of INDIANB in Weekly Time Frame. Watch carefully. The chart explains itself.
There are some prediction levels. These Levels act as Support and Resistance according to position of price. You have to trade according to level breakout or breakdown.
Always maintain your risk management.
Book your profit according to your “STOMACH”.
Disclaimer:
This is not investment advice. I am not a SEBI Registered Analyst. Anything posted here is my own analysis and views. This is created for educational purposes only. Always consult your Financial Advisor before taking any decision or trade.
Happy trading.
About INDIANB :
Indian Bank engages in the provision of banking products and services. It operates through the following segments: Treasury, Corporate/Wholesale Banking, Retail Banking, and Other Banking Operations. It offers NRI-Foreign Exchange, Applications Supported by Blocked Amount for IPO, wealth management services, supreme current accounts, educational loan, centralized pension processing, interest subsidy for educational loans, and financial inclusion plan. The company was founded by V. Krishnaswamy Iyer on March 5, 1907 and is headquartered in Chennai, India.

Multimonths Resistance zone breakout and pullback pattern in IOCHello Mates,
Guy's We have seen Neat & Clean Multi months Resistance zone breakout and Pull back pattern in IOC. On friday session it has given closing at 94 with the +2.51% of successfully upside, this is proper signal that this has respected the levels of breakout and now it is ready to fly in blue sky.
Important levels for IOC
Best entry point will be 95-93
Targets we can see in upside 101/107/115+
Keep stop loss at 85
Price is above 200-EMA, it shows a positive trend in near term.
About Company:-
Indian Oil Corporation Ltd is a Maharatna Company controlled by GOI, that has business interests straddling the entire hydrocarbon value chain - from Refining, Pipeline transportation and marketing of Petroleum products to R&D, Exploration & production, marketing of natural gas and petrochemicals. It has the leadership position in the Oil refining & petroleum marketing sector of India.
Market Cap
₹ 1,32,740 Cr.
Current Price
₹ 94.0
High / Low
₹ 101 / 65.2
Stock P/E
5.40
Book Value
₹ 98.9
Dividend Yield
3.19 %
ROCE
8.16 %
ROE
7.17 %
Face Value
₹ 10.0
Debt
₹ 1,48,977 Cr.
EPS
₹ 17.4
PEG Ratio
-0.36
Promoter holding
51.5 %
Intrinsic Value
₹ 312
Pledged percentage
0.00 %
EVEBITDA
5.18
PROS
Stock is trading at 0.95 times its book value
Company has been maintaining a healthy dividend payout of 46.4%
Disclaimer:- Please always do your own analysis or consult with your financial advisor before taking any kind of trades.
Dear traders, If you like my work then do not forget to hit like and follow me, and guy's let me know what do you think about this idea in comment box, i would be love to reply all of you guy's.
Thankyou

NATIONALUM - Swing Trade for Long ⚡ 🚀NATIONALUM is moving out of significant consolidation and can move towards a Weekly breakout. It was the previous support and after the downward flight it acted as a resistance and now it had given the breakout.
#SwingTrading
#Breakout
#PriceAction
Disclaimer: This video is for educational purposes and not a recommendation. Analysis Posted here is just our view/personal study method on the stock. Do your own analysis or consult your financial advisor before making any investment decision.

CITY UNION BANK 020923 Chart structure and risk-reward analysis for longer time trading. Support/Resistance

Long in KIRLOSENGGood price contaction.
Looks sustainable, Early entry with tight stoploss should be the plan

IRCON all time high breakoutPositional trade in IRCON
Entry : 70
SL : 64
Target 1:2 or 20 EMA trailing basis
Better to take half qty at first and avg other half at lower levels near support.

CUP AND HANDLE BREAKOUT (HIKAL)CMP : 394
Best Price to Enter : 380 to 395
Target 1 : 458
Target 2 : 552
StopLoss : 322
This analysis is for educational purpose, as we are not SEBI registered.

HINDALCOHi guys, In this chart i Drew My Best Levels in HINDALCO for Long, Observed these Levels based on price action and Demand & Supply. Don't Take any trades based on this Post...because this chart is for educational purpose only not for Buy or Sell Recommendation.. Thank Q

Inverted Head and Shoulders Breakout in KIRLOSBROSOn 23 sept 2022. NSE:KIRLOSBROS gave a breakout of Inverted Head and shoulders and Managed to close above the Neckline on Daily Time frame. ADX above 29 indicating that stock is going to trend soon.
TRADE - Positional trading
BUY - 369 - 372
TARGET - 482
STOP LOSS - 346

OIL INDIA POSITIONAL BREAKOUT TRADEHello Guys, Today there is a positional trade idea I'm sharing with you in OIL India Ltd. as you see the blue line it is a multi year support since the listing of the share from 2009-2014 (for almost five year) and after that it acts as a resistance for almost six years. So, it is a very crucial point that the stock is at breakout at the blue line if it consolidate & breaks it out and make it a support line again then we should go long in the position shown in the chart. We have the following confirmations i.e,
The 50 SMA crossing above the 200 SMA its a sign of bullish crossover
MACD is also showing the formation of bullish crossover
{Disclaimer: I'm just sharing my views you can take it do your analysis and make your positions accordingly to your risk.}

GODAWARI POWER - DAILY CHART - 16.08.22 - BAHAVAN CAPITALGODAWARI POWER Daily Chart Analyis
Above 307 Target 318 / 330 / 340
Happy Independence Day to all....
Happy Profitable Trading to all...


Strong close by stockStock was consolidating in a range after giving a strong upmove. Today the stock has given a strong close and close above AVWAP ST Dev 1. Can be a good pick for a positional trade.
