Positional Trading (1–3 Months): A Complete Guide1. What Is Positional Trading?
Positional trading is a medium-term trading style where traders hold positions for several weeks to a few months, typically 1–3 months. The goal is to capture larger price moves driven by trends, macro factors, earnings cycles, or sectoral momentum—without the stress of daily market noise.
Unlike intraday or swing trading, positional traders are less concerned with short-term volatility and focus more on the overall direction of the market or a specific asset.
This approach sits perfectly between swing trading (days to weeks) and long-term investing (years).
2. Who Should Choose Positional Trading?
Positional trading is ideal for:
Traders with full-time jobs
Traders who cannot monitor screens all day
Those who prefer low-stress, high-conviction trades
Traders comfortable holding through minor pullbacks
People who enjoy technical + fundamental analysis
It is not ideal for traders who panic during temporary drawdowns or need constant action.
3. Time Horizon and Market Scope
Holding Period:
Minimum: 2–3 weeks
Maximum: 3 months (sometimes slightly longer)
Markets Suitable for Positional Trading:
Equities (stocks)
Indices
Commodities
Forex (higher timeframes)
Cryptocurrencies (with higher risk control)
In the Indian market, positional trading is extremely popular in NSE cash stocks, index futures, and sectoral themes.
4. Core Philosophy of Positional Trading
The core idea is simple:
“Trade the trend, not the noise.”
Positional traders:
Enter near early or mid-trend
Hold through normal corrections
Exit when the trend weakens or reverses
They rely on patience, discipline, and high-probability setups rather than frequent trades.
5. Analysis Used in Positional Trading
Positional trading uses a blend of Technical, Fundamental, and Sentiment Analysis.
A. Technical Analysis (Primary Tool)
Higher timeframes are crucial:
Weekly charts
Daily charts
Key tools:
Trendlines & channels
Support and resistance
Moving averages (50 EMA, 100 EMA, 200 EMA)
MACD
RSI (40–80 range in trends)
Breakouts from consolidation
Chart patterns (Cup & Handle, Flags, Triangles)
Positional traders avoid over-indicator clutter and focus on structure and trend.
B. Fundamental Analysis (Confirmation Tool)
Fundamentals help answer:
“Does this trend make sense?”
Important factors:
Earnings growth
Revenue growth
Debt levels
Sector outlook
Management guidance
Macroeconomic data (rates, inflation)
You don’t need deep balance-sheet modeling—just directional clarity.
C. Sector & Market Sentiment
Strong stocks usually come from strong sectors.
Positional traders track:
Sector rotation
Index trend (NIFTY, BANK NIFTY)
Institutional activity (FII/DII)
Global cues
A stock moving against its sector often underperforms.
6. Entry Strategy in Positional Trading
Entries are planned, not rushed.
Common entry methods:
Breakout above major resistance
Pullback to rising moving average
Retest of breakout level
Trendline bounce
Fresh highs with strong volume
Positional traders wait for confirmation, not prediction.
7. Stop Loss Strategy
Stop loss is non-negotiable.
Types of stop loss:
Swing low / swing high
Below key support
Below moving average (for long trades)
Volatility-based (ATR)
Stops are wider than intraday trades but smaller relative to potential reward.
A positional trader accepts small losses calmly to protect capital.
8. Target Setting and Trade Management
Targets are based on:
Resistance zones
Measured move projections
Risk-reward ratio (minimum 1:2, ideally 1:3 or more)
Trade management techniques:
Partial profit booking
Trailing stop loss
Moving stop to cost after confirmation
Holding winners longer than losers
The biggest profits come from letting trends run.
9. Risk Management and Position Sizing
Risk management defines survival.
Rules positional traders follow:
Risk only 1–2% of capital per trade
Never over-leverage
Diversify across sectors
Avoid correlated trades
Even a 40–50% win rate can be profitable with proper risk-reward.
10. Psychology of Positional Trading
Psychology is the biggest challenge.
Common emotional hurdles:
Fear during pullbacks
Greed after quick profits
Impatience during consolidation
Doubt due to news headlines
Successful positional traders:
Trust their analysis
Avoid over-trading
Ignore short-term noise
Maintain a trading journal
They think in probabilities, not predictions.
11. Advantages of Positional Trading
Lower stress than intraday trading
Less screen time
Better risk-reward opportunities
Fewer trades, lower costs
Suitable for part-time traders
Captures meaningful market moves
12. Disadvantages of Positional Trading
Requires patience
Capital gets blocked longer
Drawdowns can test emotions
Overnight and gap risk
Misses short-term opportunities
Understanding these drawbacks helps manage expectations.
13. Positional Trading vs Other Styles
Style Holding Period Stress Level Capital Use
Intraday Minutes–hours Very high High
Swing Days–weeks Medium Medium
Positional 1–3 months Low–Medium Efficient
Investing Years Low Long-term
14. Final Thoughts
Positional trading is a professional, disciplined approach to the markets. It rewards patience, structure, and consistency rather than speed or excitement.
If you can:
Follow rules
Control emotions
Respect risk
Hold quality setups
Then positional trading can deliver stable and scalable returns over time.
“Big money is not made in buying or selling, but in waiting.”
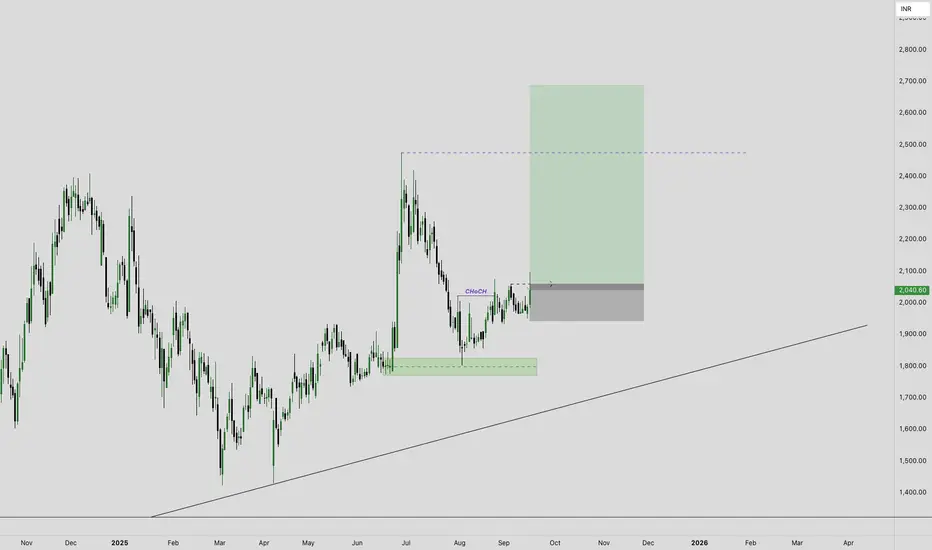
Positiontrade

Krilosbros | Positional tradeKrilosbros after respecting daily Order Block is consolidating and making HLs and positive orderflow. From CPM Krilosbros can easily give a 20% move,
Key Levels:
Entry: One can make entry at CMP(2050)
SL: Ideal stop loss for this entry would be 1947 levels
Targets: 1st target would be 2475 i.e 20% and 2690 ie 30%.
Note: Consult your financial advisor before making any position in any assets.
Exideind | All Resistance Trendline Breakout ⭕️ Swing Trading opportunity: Price Action Analysis Alert !!!⭕️
💡✍️Technical Reasons to trade or Strategy applied :-
✅Inverted Head & Shoulder Chart Pattern Bull Breakout
✅Breakout confirmed
✅Rise in Volume
✅Good 3 touches Trendline Breakout with volume
✅Clear uptrend with HH & HLs sequence
✅ Order block as potential Target
✅Check out my TradingView profile to see how we analyze charts and execute trades.
🙋♀️🙋♂️If you have any questions about this stock, feel free to reach out to me.
📍📌Thank you for exploring our idea! We hope you found it valuable.
🙏FLLOW for more !
👍LIKE if useful !
✍️COMMENT Below your view !

2 Amazing swing trading ideas for 27 November MarketsI make educational content videos for swing / positional trading

BULL FLAG PATTERN IN INDIA CEMENTS - POSITIONAL LONG TRADESymbol - INDIACEM
CMP - 353
India Cements is forming a Bullish Flag pattern after a good run. It is consolidating at higher levels & buyers are looking strong & not giving up. Breakout of this Flag pattern can lead the stock price towards 650 which is approx. 90% upside from current price. I have made a long position at CMP and will add more position around 390, which is breakout zone. Stoploss I am following is 330.
Disclaimer - Do not consider this as a buy/sell recommendation. I'm sharing my analysis & my trading position. You can track it for educational purposes. Thanks!

L&T Finance (LTF) – quick gains alertSep 13, 2024
L&T Finance is in subwave 5 of Wave 3.
Application of Ichimoku cloud shows today’s candle has closed above TS. On the daily chart, the Sep 13 candle closed just above the cloud top.
Price may hit a hurdle around Rs. 182 and go sideways. However, the probability of overcoming this hurdle is high.
Also supporting this view is the fact that the stock is going through subwave 5, which is expected to hit the 100% Fib level.
However, if the daily candle closes below the low of Sep 12, 2024, candle, then we may see downtrend setting in, and it would be the signal to exit the trade.
Share the name of the stock you're interested in, and we'll be more than happy to conduct a thorough analysis for you.
Disclaimer: We are not SEBI registered. The content presented here is based on personal opinions. Conduct your own research and consult with a qualified financial advisor before making any investment decisions.

Get ready for a price surge with Dr Reddy & TTK Prestige!DRREDDY
After the market crash in March 2020, the stock began a steady upward movement and formed a Bullish Pennant pattern.
After breaking out, the price surged and encountered resistance multiple times near the 5,550 level.
Consequently, the stock price experienced a significant drop and entered a prolonged consolidation phase.
During this phase, an Inverted Head & Shoulders pattern emerged on the chart.
Most recently, a breakout has occurred, causing the stock to move higher.
TTKPRESTIG
The stock price has developed a Head & Shoulder pattern on the weekly chart.
After the pattern breakdown, the price underwent a significant consolidation period and created a Double Bottom pattern, suggesting a potential reversal in the trend.
By breaking above the pattern's neckline, the price is now moving upwards with a substantial potential for gains.

Apollo hospitals positional trading ideasIt is forming a falling wedge pattern. inside the falling wedge, there is a double bottom pattern you can see.
Stock is in a up trend.
it also retesting the weekly breakout level.
If it breaks the wedge pattern upside. it may go higher.
Disclaimer: All information provided here is for educational purposes and not a recommendation, advice, research report, or stock tip of any nature. Analysis Posted here is just our view/personal study method on the stocks, commodities or other instruments and assets. Do your own analysis or consult your financial advisor before making any investment decision.

BSE ltd positional trading ideaATH breakout of BSE. BSE just broke the upper resistance level of 2600. the volume of the breaout candle is also good. but it didnt consolidate before breakout. so there is a chance that BSE will move in a range for a few days after breakout. and after that if it makes a positive price action, we may go for a long entry.
Disclaimer: All information provided here is for educational purposes and not a recommendation, advice, research report, or stock tip of any nature. Analysis Posted here is just our view/personal study method on the stocks, commodities or other instruments and assets.

JAGRAN for Swing Trading 🚀Greetings traders! 📈 Today, I'm thrilled to present an intriguing setup on JAGRAN, showcasing a positional breakout scenario complemented by volume analysis. Here's a closer look at the setup:
📈 Setup: Positional Breakout With Volume
🔍 Analysis: Extensive analysis across various timeframes confirms the breakout potential.
📊 Indicator Support: Momentum indicators are providing robust backing to the bullish momentum.
📈 Keywords: Strong volume participation, comprehensive multi-timeframe analysis, bolstered by momentum indicators.
Stay tuned as JAGRAN gears up for potential bullish momentum! Remember to conduct your own analysis and deploy effective risk management techniques.
#JAGRAN #PositionalBreakout #VolumeAnalysis #TechnicalAnalysis #TradingView #StockMarket 🚀

KPIT ready to take offKPITTECH has given a box breakout and is in a strong uptrend with the sector being bullish too. One can look to make entries around cmp. The breakout is on back of a false breakdown which gives the trade more confidence. Stop loss should be around 1425

Infrastructure theme for 2024 (GMR Infra)Infra theme is going to be on the forefront in 2024 following the Budget in which the sector was highly talked about. GMR Infra has a very high weightage in the same and the chart looks very appealing. One can start accumulating this stock as it's at a crucial demand zone. View invalid below 75. Targets can be big

Long in Unidt (1:6R)United Drilling Tools has given a box breakout with strong volumes. The sector being in a strong uptrend, one can take an entry in this stock with the stop being at 265. Targets can be exceptional if held positionally, it can very well retest it's previous lifetime high around 600

Stock of the Week: SUNDARMHLD - A Bullish Opportunity Unfolding.Weekly Time Frame:
On the weekly chart, SUNDARMHLD is displaying strong bullish signals. The stock is currently undergoing a retest, which often signifies a robust support level. What's particularly noteworthy is the formation of a rounding structure, indicating a potential reversal or continuation of the current uptrend. This structure has the potential to set the stage for a sustained upward move.
Daily Time Frame:
Zooming in on the daily chart, we observe a breakout from the rounding structure mentioned earlier. This breakout not only validates the strength of the bullish trend but also provides an excellent entry point for traders. The gradual consolidation and accumulation over the past few days indicate a healthy and controlled price action, allowing for strategic entry positions.
Key Technical Indicators:
Higher Highs and Lower Lows: SUNDARMHLD is consistently establishing higher highs and lower lows, a classic sign of a healthy and sustainable uptrend. This pattern suggests a strong buying interest and potential for further price appreciation.
Risk Management:
As with any trade, it's essential to implement a robust risk management strategy. Consider setting stop-loss orders to protect your capital and adhere to sound risk-reward ratios. Additionally, stay informed about relevant news and market developments that may impact the stock's performance.
In conclusion, SUNDARMHLD is shaping up to be an exciting opportunity for traders seeking a bullish play. Keep a close eye on the stock's price action, and may the markets favor your trades! Happy trading! 📈💰
(Note: This analysis is for informational purposes only and does not constitute financial advice. Please conduct your own research and consult with a financial advisor before making any investment decisions.)
SLong

3 Swing trading ideas for 6 Sep Markets I daily make educational content videos for swing / positional trading

BULLISH VIEW ON RVNLYou can expect bullish momentum in the current or next week.
Disclaimer: This video is for educational purpose and not a recommendation. The analysis posted here is just our view. Do your own analysis or consult your financial advisor before making any investment decision.

Welspun forming a cup & handle patternWelcorp has beautifully formed a cup and handle pattern in weekly time frame.
Currently, stock is trading at the neckline.
Be cautious in this stock as there can be multiple stoploss hunting before genuine breakout.
Targets can be minimum 100 points from CMP for positional and long term perspective.

Gujarat Gas Full price action explained I daily make educational content videos for swing / positional trading

SYMMETRICAL TRIANGLE BO (PFC)Stock gives breakout of symmetrical triangle on weekly timeframe .
CMP : 159
Target : 191
Stoploss : 130
This is not a buy or sell call, this analysis is shared for educational purpose.

BREAKOUT IN UBLPrice is at All Time High
CMP: 1775
Targets: 1929
SL: 1706 ( Very Short)
Disclaimer: This is for educational purposes only, not any recommendations to buy or sell.

Buy - ONGCIn 5 months, we expect ONGC to rise 15% (approximately) from its current price.
Invest -
Max - 10% of your total capital in 4 chunks.

Double Top : AFFLE LtdIn Hourly chart NSE:AFFLE has given the breakout of Double top. Previous trend was uptrend. Price Objective for the same will be the height of top.
* It is my analysis and not a recommendation to buy or sell.

Pattern Name ??Price out from down trend channel and break the upper boundary with heavy volume and Made a Probably W pattern . Chances are high price try to touch life high .
