Man Industries (W): Bullish, Turnaround with Volatility(Timeframe: Weekly | Scale: Logarithmic)
The stock is in a confirmed structural uptrend (Higher Lows) following a year-long correction. It is currently battling a critical multi-year resistance zone, backed by strong fundamental news and rising volume.
📈 1. The Structural Turnaround (The "Big Picture")
- The Cycle: Trend analysis:
- Consolidation: Jan 2024 – July 2024.
- The Peak (ATH): The stock hit a major high in July 2024
- The Correction: A downtrend followed, bottoming out in March 2025.
- The Reversal: Since March 2025, the stock has shifted character, forming a clear series of Higher Lows, signaling that buyers are stepping in at higher prices.
🚀 2. The Catalyst & Recent Action (Week of Nov 17)
- The Catalyst (The "Why"): The recent surge is driven by the company signing a Memorandum of Understanding (MoU) with Aramco Asia India (a subsidiary of Saudi Aramco) to explore a manufacturing facility in Saudi Arabia. This news triggered the volume spike.
- The Breakout Attempt: Last week (Nov 17-21), the stock attacked the horizontal resistance zone.
- Surge: It rallied +5.60% for the week.
- Volume: The move was supported by 5.22 Million in volume —a significant pickup compared to the "dry" correction phase.
- The Rejection: Despite hitting a new 52-week high intraday (₹472.40 on Nov 20), the stock failed to close above the resistance, facing profit-taking near the highs.
📊 3. Technical Indicators
- Trend: Short-term EMAs are in a PCO (Price Crossover) state on Monthly & Weekly charts, confirming the uptrend.
- Momentum (RSI):
- Weekly/Monthly: RSI is rising, supporting the longer-term bullish view.
- Daily: The Daily RSI dipped on Friday, reflecting the immediate rejection/profit-taking at resistance.
🎯 4. Future Scenarios & Key Levels
The "Shooting Star" style rejection on the weekly chart makes the coming week critical.
🐂 Bullish Case (Breakout Confirmation)
- Trigger: A sustained close above the ₹465–₹475 zone.
- Target 1: ₹545
- Target 2: ₹645 (Blue-sky extension).
🐻 Bearish Case (Support Test)
- Trigger: If the "failed breakout" leads to further profit-taking.
- Support: The immediate support lies at ₹420. Holding this level is crucial to maintain the "Higher Low" bullish structure.
Conclusion
The stock is structurally bullish but is digesting a supply overhang at the All-Time Highs. The Aramco news provides a strong floor, but patience is needed for a decisive close above ₹475 to confirm the next leg up.
Potentialalltimehigh

Precision Wires (M): Strongly Bullish (ATH Breakout)The stock has decisively broken out of a 10-month consolidation range, creating a new All-Time High (ATH) on exceptional volume. This signals the potential start of a new, major uptrend.
📈 1. The Long-Term Context
- Sideways Trend: The stock was in a prolonged sideways consolidation phase starting from January 2024.
- Volume Contraction: During this sideways period, volume was "drying up," which is a classic bullish sign of seller exhaustion and accumulation.
- The "Lid": This consolidation formed a strong horizontal resistance level that capped all rally attempts throughout the year.
🚀 2. The Decisive Breakout (The October 2025 Event)
In October, the stock broke this pattern with explosive force:
- Massive Surge: The stock surged 23.11% in a single move.
- Exceptional Volume: This surge was backed by massive, high-conviction volume of 24.51 Million shares, confirming strong institutional interest.
- ATH Achieved: This move pushed the stock to a new All-Time High and, most importantly, closed firmly above the horizontal resistance that defined the 2024 & 2025 trading range.
📊 3. Key Technical Indicators
The underlying momentum supports this bullish breakout:
- EMAs: Short-term Exponential Moving Averages are in a "PCO" (Price Crossover) state, signaling a new, strong bullish trend.
- RSI: The Relative Strength Index (RSI) is rising, indicating that buying momentum is strong and accelerating.
🎯 4. Future Scenarios & Key Levels to Watch
⚠️ A Note of Caution
While the breakout is clear, we need to be cautious. After such a sharp vertical move, a "pause" or "pullback" is healthy. The primary risk to monitor is potential bearish divergence
🐂 The Bullish Case (Breakout Continuation)
- Confirmation: The old resistance must now act as new support. As long as the stock holds above this breakout level, the trend is intact.
- Target 1:₹320
- Target 2:₹410 (if momentum continues)
🐻 The Bearish Case (Breakout Failure)
- Trigger: If the breakout fails, the stock will fall back below the old horizontal resistance level (the one it just broke).
- Confirmation: A high-volume move back into the old range.
- Target: This would signal a "fakeout" and could lead to a sharp decline to the nearest support ₹170 .

Bharti Airtel (W) - Parabolic Rally Pauses, Coils for New HighsAfter a historic, multi-year parabolic run, Bharti Airtel has entered a healthy consolidation phase right at its all-time high. The stock now appears to be gathering energy for its next potential move, with the upcoming week being critical for confirmation.
The Big Picture: A 716% Parabolic Uptrend
Since November 2018, Bharti Airtel has been in a massive parabolic uptrend, rewarding long-term investors with an incredible gain of 716% . Following such a powerful advance, a period of sideways consolidation is a normal and often bullish development as the market absorbs the gains.
The Current Setup: Consolidation at the Peak
The stock has recently been consolidating in a sideways range, during which trading volume has been noticeably drying up—a classic sign of accumulation before a potential breakout.
The past week saw a re-emergence of buying interest, with the stock surging +3.72% on a solid volume of 22.02 million shares . This move has pushed the price directly against the short-term resistance created by its recent All-Time High (ATH).
Underlying Technical Strength
The primary trend remains firmly bullish. This is confirmed by key momentum indicators on the higher timeframes:
- The short-term Exponential Moving Averages (EMAs) are in a positive crossover state on both the Monthly and Weekly charts.
- The Relative Strength Index (RSI) is also in a rising trend on the Monthly and Weekly charts.
Outlook and Key Triggers to Watch
The price action in the coming week is crucial and will be dictated by its interaction with the ATH resistance.
- Bullish Scenario: The ideal scenario would be a decisive breakout above the ATH resistance on high volume . The strongest confirmation would be a subsequent retest of this breakout level, where it acts as new support, followed by a bounce. This would validate the continuation of the uptrend, with a potential next target of ₹2,240 .
- Bearish Scenario: If the stock fails to sustain momentum and is rejected from the ATH resistance, it could pull back to test the lower boundary of its consolidation range, with the primary support level at ₹1,835 .
In conclusion, the focus is squarely on the all-time high. A confirmed breakout would signal that the bulls are ready to resume this stock's powerful long-term journey upwards.

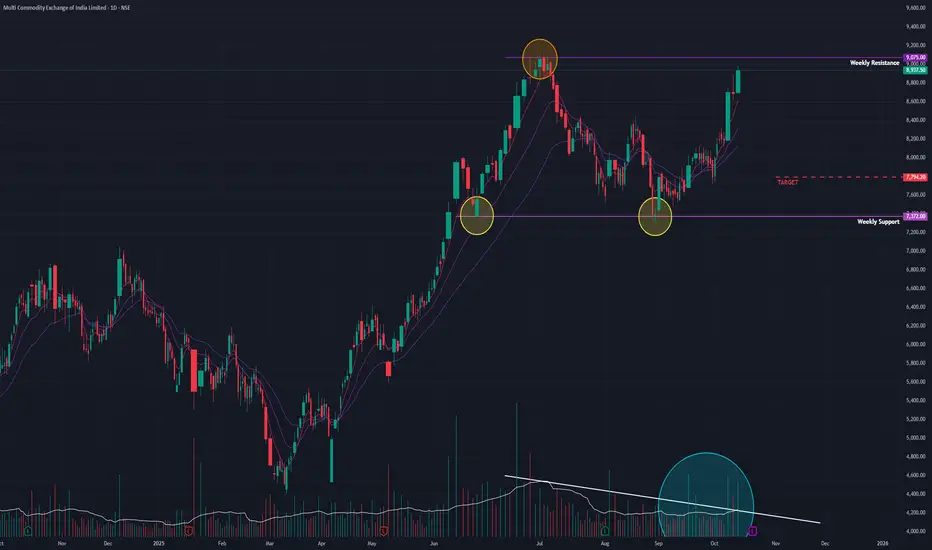
MCX (D) - Gathers Steam for All-Time High BreakoutMulti Commodity Exchange of India (MCX) is showing strong bullish momentum as it closes in on its all-time high. After a period of healthy consolidation, today's positive price action suggests the stock is preparing to challenge its key resistance level.
The Context: Consolidation Below the Peak
Following a strong bullish uptrend, MCX entered a sideways consolidation phase in June 2025. It registered a new All-Time High (ATH) in July 2025 , which established a formidable resistance level that has capped all subsequent rallies.
Today, the stock showed renewed strength with a solid gain of +2.87% on good volume. This move has pushed the price to less than 2% below its ATH resistance , placing it on high alert for an imminent breakout attempt.
Underlying Technical Strength
The potential for a breakout is strongly supported by key technical indicators across multiple timeframes (Monthly, Weekly, and Daily):
- EMA Crossover: The short-term Exponential Moving Averages (EMAs) are in a bullish positive crossover state.
- Rising RSI: The Relative Strength Index (RSI) is rising, confirming that momentum is building.
These indicators suggest a broad-based strength that could fuel a move to new highs.
Outlook and Key Levels
The immediate path for MCX will be determined by its interaction with the ATH resistance.
- Bullish Breakout Scenario: A decisive close above the all-time high on strong volume would confirm a breakout and signal a continuation of the primary uptrend. The next potential target in this scenario would be the ₹10,800 level.
- Potential Pullback Scenario: If the stock fails to breach the resistance and loses momentum, it could pull back to test the lower end of its consolidation range, with the primary support level at ₹7,800 .
In conclusion, MCX is coiled for a potentially significant move. The focus in the coming days should be squarely on the price and volume action at the all-time high resistance, as a breakout here would be a major bullish signal.
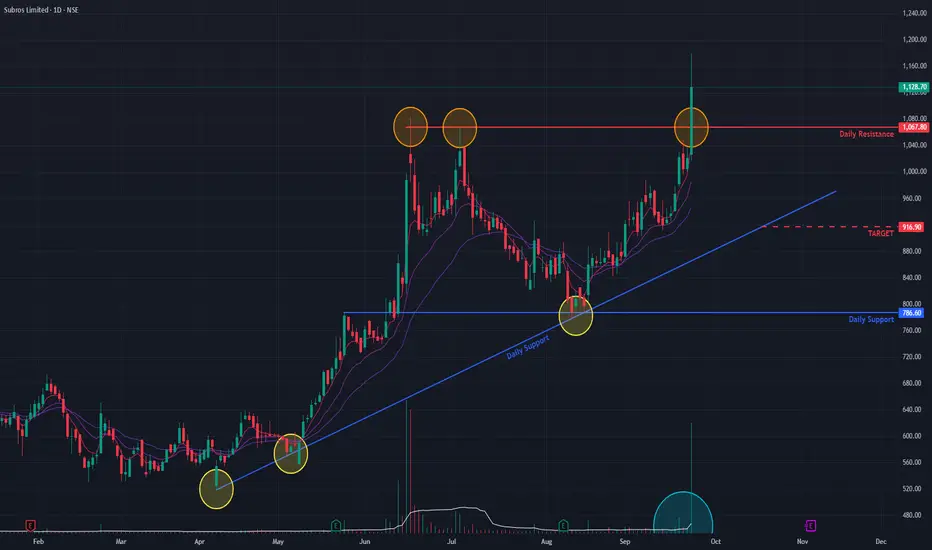
Subros (D) - Hits New ATH, Breaking Out of ConsolidationSubros has demonstrated exceptional strength, surging to a new All-Time High (ATH) today with a significant +10.45% gain . This powerful move was supported by a massive spike in trading volume, suggesting the potential end of the sideways consolidation phase that has been in place since June 2025.
Comprehensive Bullish Confirmation 👍
The breakout is validated by a strong alignment of bullish signals across all major timeframes:
- Multi-Timeframe Momentum: The Relative Strength Index (RSI) is indicating a bullish state on the monthly, weekly, and daily charts , showcasing broad-based strength.
- Short-Term Confirmation: The short-term Exponential Moving Averages (EMAs) are in a strong bullish crossover, confirming the immediate upward momentum.
- Volume Thrust: The breakout was accompanied by an exceptionally high volume spike , indicating strong conviction from buyers.
Outlook and Key Levels
Following a significant breakout, a retest of the previous resistance trendline as new support would provide strong confirmation of a continued uptrend.
- Bullish Case 📈: If the upward momentum is sustained, the next potential price target on the upside is ₹1,347 .
- Bearish Case 📉: Conversely, if the breakout fails to hold and momentum is lost, the stock could pull back to find support near the ₹916 level.
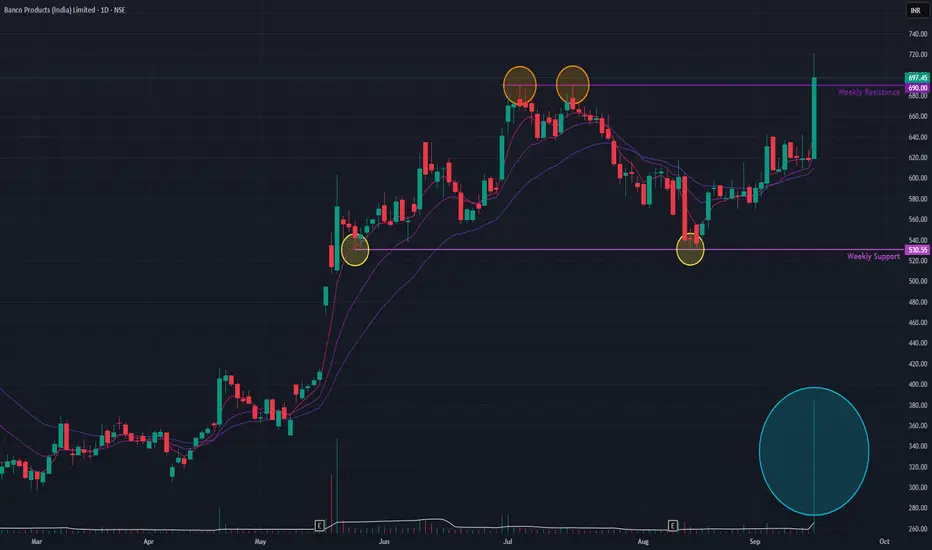
Banco India (Daily Timeframe) - Potential ATH ??Banco India remains in a dominant long-term uptrend that started in June 2020. After a brief corrective downtrend from November 2024 to April 2025, the stock entered a sideways consolidation phase.
Today, the stock decisively broke out of this consolidation range with a surge of +12.84% on significant volume , signaling strong buyer commitment & a new All Time High (ATH) . This bullish move is further supported by short-term Exponential Moving Averages (EMAs), which are in a positive crossover state.
If this upward momentum is sustained, the next potential price target is the ₹850 level. Conversely, a failure to hold the breakout could see the price retrace to support near the ₹530 level.
Price-action is what matters !!
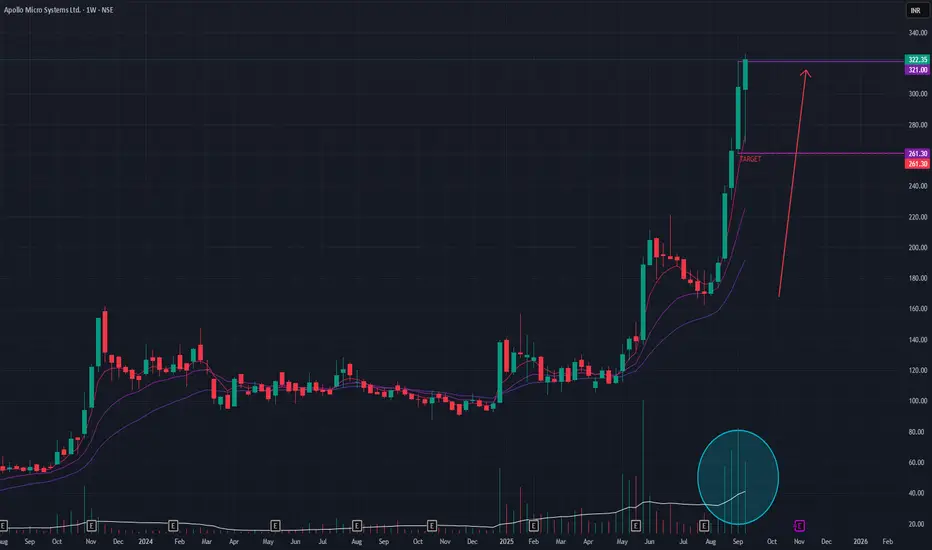
Apollo Micro Systems (Weekly Timeframe) - Momentum to continue ?Apollo Micro Systems has been in a steep, aggressive uptrend since August 2025, delivering a remarkable +92% return in a short period. The stock is exhibiting classic signs of strong bullish momentum, but the velocity of the rise warrants a closer look at its sustainability.
## Bullish Momentum Indicators 📈
Exceptional Volume: The rally has been supported by extraordinary trading volume for the past four to five weeks, indicating significant and sustained buying interest.
Technical Strength: The short-term Exponential Moving Averages (EMAs) are in a Positive Crossover (PCO) state, confirming the powerful upward momentum.
Buyer Conviction: The recently formed weekly candle indicates strong demand and suggests that buyers remain in control of the trend.
## Outlook and Key Levels
While the trend is undeniably strong, the rapid ascent raises the possibility of near-term profit-booking. Such a pullback could be a healthy correction, potentially offering more favorable entry points for those who missed the initial move.
Upside Potential: If the current momentum continues, the stock could surge towards the next logical target of ₹376.
Downside Risk: A correction or loss of momentum could see the stock pull back to test the support level around ₹261.
In summary, while the underlying trend remains powerful, traders should be mindful of the potential for increased volatility after such a sharp and rapid advance.
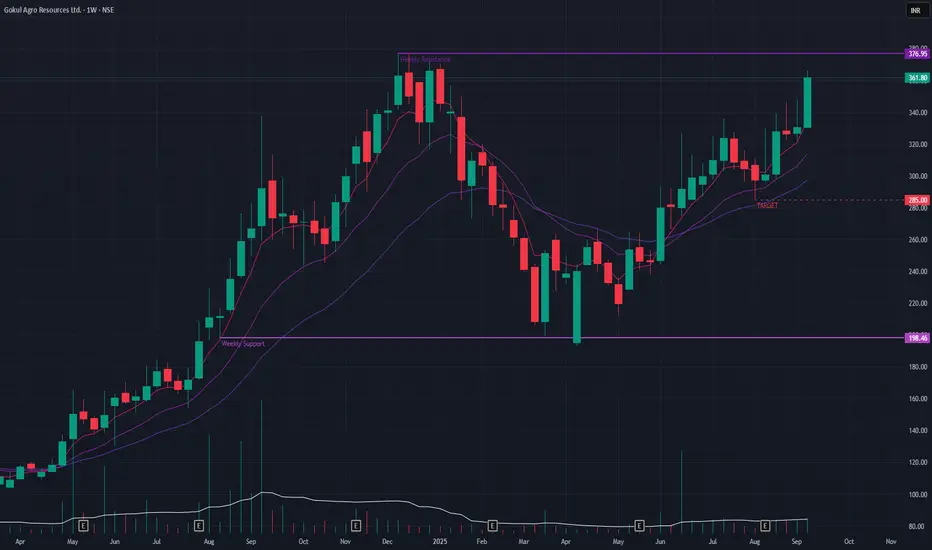
Gokul Agro (Weekly Timeframe) - Can it BreakOut & new ATH ?Gokul Agro has undergone a significant trend reversal, shifting from a downtrend that began in December 2024 to a renewed uptrend since April 2025. This recovery has brought the stock within striking distance of its all-time high (ATH).
Recent price action has been particularly strong, highlighted by a +9.39% gain last week, which was supported by healthy trading volumes, indicating strong buyer conviction. Further technical confirmation comes from the short-term EMAs, which are stacked in a bullish formation, signaling strong upward momentum.
A sustained push through the current resistance could propel the stock to a new ATH. Beyond that, the next projected technical target is the ₹490 level. Conversely, a failure to break out could see the price pull back to the primary support zone around ₹285 .
Monitor the price-action !!