Sharda Cropchem (D): Aggressive Bullish (Earnings-Led Re-rating)(Timeframe: Daily | Scale: Linear)
The stock has confirmed a major breakout from a 7-month consolidation ("The Box"). This is a high-quality breakout because it is supported by a fundamental turnaround (earnings explosion) and record volumes.
🚀 1. The Fundamental Catalyst (The "Why")
The technical explosion is fully justified by the numbers:
> Q3 Earnings Blowout: The 366% profit jump re-rated the stock overnight. The market is adjusting the price to reflect this new earnings reality.
> Dividend Yield: The interim dividend of ₹6 (Record Date: Feb 6) adds a "Carry" incentive for buyers to hold.
> Volume Significance: The "Huge Volume" is institutional accumulation. Funds are likely re-entering the stock after the strong guidance.
📈 2. The Chart Structure (Rectangle Breakout)
> The Box: The ₹760 – ₹1,160 trading range, the stock spent 7 months coiling in this zone.
> The Breakout: Today's close at ₹1,162.70 is the first valid daily close above this multi-year barrier. A breakout from such a deep base usually has long legs.
📊 3. Volume & Indicators
> RSI: RSI is rising in all timeframes. In "Blue Sky" breakouts (New ATH), RSI can stay above 70 (Overbought) for extended periods. Do not treat it as a sell signal yet.
> EMAs: The Positive Crossover (PCO) across all timeframes confirms the trend is in the strongest possible state ("Markup Phase").
🎯 4. Future Scenarios & Key Levels
The stock is now in "Price Discovery."
🐂 Bullish Targets (The Upgraded View):
- Target 1: ₹1,327
- Target 2: ₹1,560.
🛡️ Support (The "Must Hold"):
- Immediate Support: ₹1,119 – ₹1,150 . The breakout zone.
- Refinement: If the stock dips to ₹1,120 , it is a "screaming buy" opportunity. The sideways support of ₹760 is now too far away to be relevant for this momentum leg.
Conclusion
This is a Grade A+ Setup.
> Refinement: The combination of Record Earnings + New ATH + Volume is the "Holy Trinity" of trading setups.
> Strategy: Watchout for the price action in the coming days & hold for ₹1,327 .
Potentialbreakout

Jindal Steel (W): Cautiously Bullish (Breakout Rejection)(Timeframe: Weekly | Scale: Logarithmic)
The stock attempted a major breakout from its 2-year consolidation but faced a classic "Shooting Star" / Rejection at the All-Time High. While the trend is up, the inability to close above ₹1,085 signals that the "Smart Money" is booking profits ahead of the Jan 30 earnings.
🚀 1. The Fundamental Catalyst (The "Why")
The price action is dominated by the upcoming event:
> Q3 Earnings (Jan 30): With results just a week away, investors are risk-averse. The stock needs a "Earnings Beat" to justify a price above ₹1,100.
> Sector Strength: The Nifty Metal Index is strong (up ~7% this month), which is why the stock is hugging the resistance rather than crashing.
📈 2. The Chart Structure (The Trap)
> The Box: ₹750 – ₹1,085 consolidation range. This "Time Correction" has been healthy.
> The Fakeout (This Week):
- The Move: The stock spiked to ₹1,104 (New High) but was hammered down to close below ₹1,085 .
- Interpretation: This leaves a long "Upper Wick" on the weekly candle, indicating that bears are still defending this fortress. A "Look Above and Fail" often leads to a short-term pullback.
📊 3. Volume & Indicators
> Volume: The "Above Average" volume on a rejection candle is a warning. It implies that while buyers tried to push up, sellers unloaded heavy quantities (Churning).
> RSI: Rising but showing a potential Negative Divergence on daily frames if price makes a high but RSI doesn't.
🎯 4. Future Scenarios & Key Levels
The trade is now an "Event Play."
🐂 Bullish Breakout (Post-Earnings):
- Trigger: A decisive Weekly Close above ₹1,105 (clearing the new wick).
- Target 1: ₹1,235.
- Target 2: ₹1,350.
🛡️ Support (The "Buy Zone"):
- Immediate Support: ₹980 – ₹1,000 .
- Strategy: If the stock dips to ₹980 before Jan 30, it is a low-risk entry.
- Stop Loss: A close below ₹950 invalidates the bullish structure.
Conclusion
This is a "Wait for Confirmation" Setup .
> Refinement: Do not buy the "intraday breakout." Wait for a Closing Basis breakout above ₹1,105.
> Action: Keep it on the watchlist. The real move will likely happen after Jan 30 results.

DCB Bank (D): Bullish (Breakout from Consolidation)Timeframe: Daily | Scale: Linear
The stock has confirmed a breakout from a 2-month sideways consolidation phase. The move is backed by rising volume and strong fundamental tailwinds, signaling a resumption of the broader uptrend that began in 2020.
🚀 1. The Fundamental Catalyst (The "Why")
The technical breakout is supported by operational improvements:
> Earnings Anticipation: The market is positioning for strong Q3 FY26 numbers . In Q2, the bank reported an 18% YoY jump in Net Profit (₹184 Cr), driven by healthy loan growth.
> Asset Quality: Continuous improvement in asset quality (Net NPA stable at ~1.2%) has restored investor confidence, helping the stock reclaim levels not seen since 2019.
📈 2. The Chart Structure (The Breakout)
> The Pattern: The Angular Resistance acting as a "Lid" since Nov 2025.
- The Move: Today's close above this trendline (near ₹184–185) signals that the sellers who were active in this zone have been absorbed.
> The Volume: The 4.06 Million volume is significant. It confirms that "Smart Money" is participating in the breakout, differentiating it from a low-volume fakeout.
📊 3. Technical Indicators
> EMAs: The Positive Crossover (PCO) on Short-term EMAs confirms the trend is accelerating.
> RSI: Rising in all timeframes (Monthly/Weekly/Daily) indicates synchronized momentum. The Daily RSI breaking above 60 suggests the stock is entering a "Markup Phase."
🎯 4. Future Scenarios & Key Levels
The stock is now chasing its multi-year highs.
🐂 Bullish Targets (The Extension):
- Target 1: ₹203 .
- Target 2: ₹215 . If momentum sustains, this level is highly achievable.
🛡️ Support (The "Must Hold"):
- Immediate Support: ₹180 – ₹182 .
- Stop Loss: A close below ₹175 would invalidate the breakout and suggest the stock is returning to the sideways range.
Conclusion
This is a High-Probability Setup .
> Refinement: The volume confirmation on the breakout day is the key differentiator.
> Strategy: The breakout is valid. Use any intraday dip to enter/add.

Alkem Laboratories (D): Bullish (Rounding Bottom Breakout)Timeframe: Daily | Scale: Linear
The stock has confirmed a major structural breakout from a 6-month "Rounding Bottom" recovery pattern. The "Gap Up" above the key resistance of ₹5,850 signals a shift in market sentiment from "Accumulation" to "Markup."
🚀 1. The Fundamental Catalyst (The "Why")
The breakout is fueled by strong operational tailwinds:
> US Business Boom: The 28% growth in US revenue (reported in H1 FY26) has re-rated the stock. Investors are rushing in ahead of Q3 results, expecting this momentum to sustain.
> Sector Rotation: Capital is shifting back to "Defensive Growth" (Pharma) as broader markets turn volatile.
📈 2. The Chart Structure (The Recovery)
> The Pattern: This structure is a classic Rounding Bottom (Saucer) formation, which indicates a gradual shift of power from bears to bulls.
> The Breakout: The horizontal resistance at ₹5,848 was the "Neckline" of this pattern.
- The Move: Yesterday's test and today's Gap Up opening confirm the breakout. A gap-up at resistance is a sign of aggressive institutional buying.
📊 3. Volume & Indicators
> Volume: The "Volume Picking Up" recently is crucial. In rounding bottoms, volume typically dries up at the bottom (Feb 2025) and expands on the right side (Jan 2026). This confirms the validity of the move.
> RSI: Rising in all timeframes. Daily RSI entering the "Overbought" zone (>70) during a breakout is actually a sign of strength (momentum lock-in).
🎯 4. Future Scenarios & Key Levels
The stock is now chasing its previous peak.
🐂 Bullish Target (The Recovery):
- Target 1: ₹6,440 (The ATH). Since there is no major resistance between ₹5,900 and ₹6,440, the move could be swift.
- Blue Sky: If it clears the ATH, the pattern target projects well towards ₹7,000+ .
🛡️ Support (The "Must Hold"):
- Immediate Support: ₹5,713 – ₹5,750 .
- Strategy: As long as the stock stays above ₹5,848 , the breakout is valid. A dip to ₹5,800 is a buying opportunity.
Conclusion
This is a High-Probability Setup .
> Refinement: The "Gap Up" is the key. It prevents retail traders from entering easily, which is often a hallmark of a genuine institutional move.
> Action: Hold for ₹6,440 .

Tata Steel (D): Bullish (Sector-Backed Breakout Attempt)Timeframe: Daily | Scale: Linear
The stock is challenging the upper boundary of its 2-year consolidation phase, trading just below the critical ₹187.85 (ATH) resistance. The move is supported by a "Bullish Island" gap and a strong sector-wide rally.
🚀 1. The Fundamental Catalyst (The "Why")
The surge is driven by sectoral strength and operational updates:
> Sector Rally: The Nifty Metal Index rallied ~2% today, acting as a tailwind for Tata Steel.
> Production Update: The market is reacting positively to the recent Q3 FY26 Production Update (released Jan 7), where the company reported steady volumes despite global headwinds, signaling resilience.
📈 2. The Chart Structure (Island & Resistance)
> The "Island" Gap: Pattern formed since Dec 31.
- The Formation: The stock gapped up from ₹175.80 to ₹180 on Dec 31 and has stayed above this gap. This created a "Bullish Breakaway Gap" , leaving the previous consolidation (₹170-175) isolated as an "island" of trapped sellers.
> The Resistance (The "Lid"): The horizontal resistance is specifically the ₹187 – ₹188 zone (The All-Time High / 52-Week High).
- Current Status: Closing at ₹183.30 , the stock is knocking on the door of this final barrier.
📊 3. Volume & Indicators
> Volume Profile: While today's volume (25.78 M) is good, the Dec 31 Volume (50 M+) was the real "Ignition Day." The drying volume during the consolidation (before Dec 31) followed by these spikes confirms accumulation.
> Momentum:
- RSI: Rising in all timeframes, confirming synchronized momentum.
- EMAs: The Positive Crossover (PCO) aligns with the "Island" gap, confirming the trend is up.
🎯 4. Future Scenarios & Key Levels
The stock is primed for a "Blue Sky" breakout.
🐂 Bullish Target (Blue Sky):
- Trigger: A decisive Daily Close above ₹188 .
- Target 1: ₹212 .
- Target 2: ₹225 . (Psychological level).
🛡️ Support (The Safety Net):
- Immediate Support: ₹177 – ₹180 . The "Gap Zone" from Dec 31. The stock must stay above ₹180 to keep the "Island" valid.
- Stop Loss: A close below ₹175 would "fill the gap" and invalidate the bullish momentum.
Conclusion
This is a High-Quality Setup .
> Refinement: The "Island Gap" at ₹180 is the new floor.
> Strategy: The breakout is imminent. Watch for a high-volume close above ₹188 to confirm the run to ₹212 .

HAL (W): Neutral-Bullish (Coiling Pre-Budget)Timeframe: Weekly | Scale: Logarithmic
The stock is in the final stages of a 7-month consolidation pattern (Descending Triangle). While typically a bearish pattern, in a strong structural uptrend (like Defense), this often acts as a "Pause" before the next leg up, especially with the Budget acting as a trigger.
🚀 1. The Fundamental Catalyst (The "Why")
The stock is waking up due to seasonality:
> Union Budget (Feb 1): We are 3 weeks away from the Budget. The market expects increased defense spending, specifically for the Tejas Mk2 and AMCA programs, which directly benefits HAL.
> Volume Pickup: The recent volume accumulation suggests "Pre-Budget Positioning" by institutions who expect a breakout.
📈 2. The Chart Structure (The Squeeze)
> Resistance (The Lower Highs): The angular trendline starting from the July 2024 ATH is currently passing through ₹4,900 – ₹4,800 . A weekly close above this invalidates the correction.
> Support (The Floor): The horizontal support at ₹4,150 (active since Apr 2025) has held multiple times. This is the "Line in the Sand."
> Current Position: The stock is trading tight against the resistance. A breakout here would release 7 months of stored energy.
📊 3. Technical Indicators
> RSI: The RSI rising while price is sideways is a Bullish Divergence (hidden). It shows internal strength.
> EMAs: Watch for the short-term EMA's Positive Cross-over state.
Conclusion
This is a "Event-Driven Setup" .
> Refinement: The "Wait and Watch" approach maybe correct, but be ready to act fast. The Budget Expectation will likely force the breakout before Feb 1.

Granules India (D): Cautiously Bullish - Potential Bull TrapTimeframe: Daily | Scale: Linear
The stock attempted a breakout from a 2-month consolidation but faced rejection yesterday (Dec 24), closing back inside the resistance zone. While the trend is up (Higher Lows), the immediate price action signals a "Bull Trap" risk unless confirmed by a strong close.
🚀 1. The Fundamental Catalyst (The "Floor Price")
The recent volatility and volume are driven by a major corporate event:
> Fundraising at ₹585: On Dec 23, the board approved raising ₹1,462 Crore by issuing warrants to promoters and investors at ₹585 per share .
> Implication: When promoters inject money at ₹585, it creates a strong psychological and fundamental floor . Even if the technical breakout fails, the downside is likely limited to this ₹585 zone.
> USFDA Approval: The company also received tentative USFDA approval for its ADHD drug (generic Adzenys XR-ODT) on Dec 22, adding fundamental strength.
📈 2. The Chart Structure (The Trap)
> The Resistance (608-613): This horizontal zone has capped gains since Oct 2024.
> The Fakeout (Dec 23-24):
- Dec 23: The stock surged 2.34% , closing above the zone. This lured in breakout buyers.
- Dec 24: The stock opened flat, retested the highs, but succumbed to selling pressure, closing back below the trendline (near ₹612).
> Interpretation: This "Look above and fail" pattern often traps aggressive bulls. If the price doesn't reclaim the high quickly, these trapped buyers will liquidate, fueling a dip.
📊 3. Technical Indicators
> RSI: Rising in all timeframes, but the daily RSI turning down from the overbought border suggests a short-term cool-off is possible.
> EMAs: The stock remains well above its short-term EMAs, so the primary trend is still bullish despite the failed breakout.
🎯 4. Future Scenarios & Key Levels
The trade now hinges on confirming the breakout or playing the support.
> 🐂 Bullish Confirmation (The Recovery):
- Trigger: A daily close above ₹615 (clearing the Dec 24 rejection).
- Target 1: ₹679.
- Target 2: ₹721 (ATH).
> 🛡️ Support (The "Must Hold"):
- Immediate Support: ₹585 . This is the "Warrant Price" and a strong demand zone.
- Structural Support: ₹578 . A fall below this invalidates the "Higher Low" structure and confirms a trend reversal.
Conclusion
The setup is Tricky . The "Close Below" on Dec 24 is a warning sign.
> Strategy: Do not chase here. Wait for a close above ₹615 to re-enter. If you are already long, use ₹585 as your strict stop-loss, as promoter buying support sits there.

NMDC (D): Bullish, Knocking on the DoorTimeframe: Daily | Scale: Linear
The stock is on the verge of a major structural breakout from a 12-month accumulation zone (post-bonus). The move is backed by "Climax Volume" and a strong sectoral tailwind, signaling that smart money is aggressively entering.
🚀 1. The Fundamental Catalyst (The "Why")
The surge is not random; it is driven by a sector-wide re-rating:
> Sector Rally: The Nifty Metal index and global mining peers are surging, fueled by rising iron ore prices and expectations of demand recovery in China.
> Volume Significance: The 77.6 Million volume is an "Institutional Stamp." It indicates that big players are positioning for a breakout before it happens.
📈 2. The Chart Structure (The "Lid")
> The Box: The stock has been trapped in a wide consolidation since the 2:1 Bonus Issue in late 2024.
> Resistance: ₹82 – ₹83 . This level (the 52-week high) has capped every rally for the past year.
> Current Action: The stock hit an intraday high of ₹82.3 today, testing the ceiling. Closures near the high suggest buyers are eating up all supply.
📊 3. Technical Indicators
> RSI: Rising in all timeframes (Monthly/Weekly/Daily) confirms momentum is synchronized.
> Moving Averages: The stock is trading above all key EMAs, with a Golden Crossover (Short-term EMAs crossing Long-term EMAs) confirming the trend shift.
🎯 4. Future Scenarios & Key Levels
The stock is at the "Make or Break" point.
> 🐂 Bullish Breakout (The Trigger):
- Condition: A decisive Daily Close above ₹83 .
- Target: ₹91 .
> 🛡️ Support (The Safety Net):
- Immediate Support: ₹78 . The previous breakout level.
- Stop Loss: A close below ₹75 would invalidate the bullish view and send the stock back into the "boring" sideways range.
Conclusion
This is a Grade A Setup because of the volume.
> Strategy: The high volume suggests the breakout is likely real. Watch for the ₹83 level to be taken out decisively.

Persistent systems (W): Bullish - Coiling for BreakoutTimeframe: Weekly | Scale: Logarithmic
The stock is in the final stages of a year-long consolidation (since the Dec 2024 ATH). It is currently forming a "base on top of a base" just below the critical resistance, backed by a major new AI partnership and positive sector tailwinds.
🚀 1. The Fundamental Catalyst (The "Why")
The technical "coiling" is supported by strong news flow:
> DigitalOcean Partnership (Dec 16, 2025): Persistent announced a multi-year strategic tie-up with DigitalOcean to deploy AI solutions. This expands their addressable market in the AI infrastructure space.
> Sector Tailwind: Strong guidance from global peers (like Accenture) has triggered a re-rating in Indian IT mid-caps, validating the demand environment for 2026.
📈 2. The Chart Structure (The "Lid")
> The Resistance: The ₹6,510 level has acted as a rigid ceiling. The failed breakout, where it popped up to ATH but fell back, cleared weak hands.
> The Current Buildup:
- Candles: The recent Hammer (showing buying at lower levels) followed by a Neutral/Doji (showing indecision/absorption) right under resistance is significant.
- Interpretation: Sellers are trying to push it down, but buyers are stepping in immediately. This "tightening" often precedes an explosive move.
> Volume: The "drying volume" observed is actually positive here. It implies that the supply (sellers) is exhausted. We now just need a volume spike to trigger the breakout.
📊 3. Technical Indicators
> EMAs: The Positive Crossover (PCO) in Weekly/Monthly confirms the primary trend is UP.
> RSI: Rising RSI indicates that internal momentum is building up for the push through ₹6,510.
🎯 4. Future Scenarios & Key Levels
The stock is primed to challenge the ATH.
> 🐂 Bullish Breakout (The Trigger):
- Condition: A decisive Daily/Weekly Close above ₹6,510 .
- Target 1: ₹6,789 (The ATH).
- Target 2: ₹7,700 . (If the stock enters "Blue Sky" discovery, this is the 1.618 Fibonacci extension).
🛡️ Support (The Safety Net):
> Immediate Support: ₹5,920 . The stock must hold this to keep the bullish structure alive.
- Stop Loss: A weekly close below ₹5,800 would invalidate the setup.
Conclusion
This is a High-Probability Setup . The "Hammer + Neutral" combo at resistance suggests the breakout is imminent.
> Strategy: Wait for the close above ₹6,510 to enter. The DigitalOcean news provides the fundamental conviction to hold for targets beyond the ATH.

Infosys (W): Bullish - Coiling Pre-BreakoutTimeframe: Weekly | Scale: Logarithmic
The stock is in the final stages of a consolidation pattern, trading just below a multi-year resistance zone. The setup is a classic "absorption" phase , where buyers are soaking up supply before an imminent breakout, fueled by sector tailwinds.
🚀 1. The Fundamental Catalyst (The "Why")
The technical strength is supported by a major shift in sentiment:
> Accenture Q1 Results: The global IT giant recently reported strong numbers and raised guidance, signaling that the demand environment is improving. This typically acts as a leading indicator for Indian IT majors like Infosys.
> Seasonality: December/January is often a period of "pre-budget" and "pre-earnings" positioning, where defensive sectors like IT attract capital.
📈 2. The Chart Structure (The "Lid")
> The Resistance (1635-1655): It has been a rigid ceiling since April 2022. The fact that the stock is now hovering just below it (at ~1,638) rather than rejecting sharply suggests that the sellers are exhausted.
> The Volume: The weekly volume of 34.23 Million (and rising average volume over the last few weeks) confirms institutional accumulation . Smart money is buying before the breakout.
📊 3. Technical Indicators
> EMAs: The Positive Crossover (PCO) on the Weekly chart is a strong signal. The Monthly chart being "yet to form PCO" is actually positive—it means the major long-term buy signal is just about to trigger , offering early entry.
> RSI: Rising in both Monthly and Weekly timeframes indicates momentum is aligning with the price action.
🎯 4. Future Scenarios & Key Levels
The stock is coiling for a big move.
> 🐂 Bullish Breakout (The Trigger):
- Condition: A decisive Weekly Close above ₹1,655 .
- Target 1: ₹1,810 .
- Target 2: ₹2,006 (ATH).
> 🛡️ Support (The Safety Net):
- Immediate Support: ₹1,555 . This level must hold.
- Stop Loss: A close below ₹1,520 would invalidate the "absorption" thesis and suggest the resistance remains too strong.
Conclusion
This is a Grade A "Pre-Breakout" Setup .
> Strategy: The "smart money" is already accumulating. You can either buy 50% now (at ~1638) to capture the breakout early, or wait for a close above 1655 to go full size.
> Watchout: Keep an eye on the USD/INR rates; a stronger dollar will further support this trade.

Shriram Fin (D): Cautiously Bullish - Breakout with IndecisionTimeframe: Daily | Scale: Linear
The stock has attempted a breakout from a multi-week consolidation range, hitting a new All-Time High. However, the formation of a Neutral Candle on high volume signals a fierce battle between buyers and sellers at the top. The breakout needs confirmation.
📈 1. The Chart Structure (Consolidation)
> The Range: The stock has been trapped between ₹820 (Support) and ₹870 (Resistance) .
> The Breakout Attempt: Today (Dec 18, 2025), the stock pierced the upper band to hit ₹867.90 .
> The Candle: The daily candle closed as a Spinning Top (small body, long wicks). This indicates indecision. Despite the record volume, the bulls failed to close near the day's high, showing supply pressure at ₹870.
📊 2. Volume Analysis (The Warning)
> The Spike: Volume of 12.48 Million is huge.
> Interpretation: When you see Record Volume + Neutral Candle at resistance, it often means Distribution (sellers absorbing the buying pressure).
> Action: This invalidates an immediate "buy at market" order. You must wait for the price to clear today's high.
🚀 3. The Fundamental Context (Post-Split Stability)
> Valuation: Since the 1:5 Stock Split in Jan 2025, the stock has stabilized in this ₹800s zone. The current consolidation is a healthy digestion of the post-split gains.
> Catalyst: Recent reports of a stake sale (20% to MUFG) or strategic partnership are keeping the volume elevated. This news flow is the likely driver of the breakout attempt.
🎯 4. Future Scenarios & Key Levels
The "Neutral Candle" dictates a Wait & Watch approach.
> 🐂 Bullish Confirmation (The Trigger):
- Condition: A decisive Daily Close above ₹870 .
- Target 1: ₹920 .
- Target 2: ₹970.
> 🐻 Bearish Rejection (The Fakeout):
- Condition: If the stock slips below today’s low ( ~₹855 ).
- Implication: The "Spinning Top" would confirm a short-term top, sending the stock back into the box toward ₹820 .
Conclusion
Technically, the breakout is NOT confirmed yet. The high volume without a strong close is a red flag.
> Strategy: Do not chase here. Wait for a close above ₹870 to confirm that the "churn" has resolved in favor of the bulls.

Maruti (D): Cautiously Bullish - Low-Volume BreakoutTimeframe: Daily | Scale: Linear
The stock has confirmed a technical breakout from a 3-month rectangular consolidation. While the price action is positive, the low volume suggests a lack of aggressive institutional buying yet. The move is likely driven by year-end seasonality rather than raw momentum.
📈 1. The Chart Structure (Box Breakout)
> The "Box": Rectangle Pattern (or Box Consolidation).
> Resistance (Ceiling): 16,375 . This level capped upside in Oct and early Dec.
> Support (Floor): 15,249.
> The Breakout: Today's close above 16,375 is technically a breakout. It signals that buyers have finally absorbed the supply at this level.
> The ATH Hurdle: It is important to note that the All-Time High (ATH) of 16,600 is just ~1.4% away. A true "Blue Sky" run only starts above 16,600.
⚠️ 2. The Volume Warning (The Risk)
> The Divergence: "volume has been drying up," and today's volume ( 257K ) is relatively minor for a breakout candle.
- Rule of Thumb: A genuine breakout usually requires volume to be 1.5x to 2x the average.
- Risk: Low-volume breakouts often retrace (pull back) to test the breakout level. Do not be surprised if it dips back to 16,375 tomorrow.
🚀 3. The Fundamental Catalyst (The "Why")
The price is likely drifting up due to Seasonality :
> January Price Hikes: Automakers, including Maruti, typically announce price hikes in late December (effective Jan 1st). The market often "front-runs" this news.
> Year-End Discounts: Aggressive Dec sales pushes often boost Q3 numbers, keeping sentiment positive despite low holiday volume.
📊 4. Technical Indicators
> RSI: Rising in all timeframes confirms the trend is healthy.
> EMA: The Positive Crossover on EMAs aligns with the breakout, validating the trend direction even if volume is lagging.
🎯 5. Future Scenarios & Key Levels
The low volume dictates a "buy on confirmation" strategy.
> 🐂 Bullish Target:
- Confirmation Trigger: A daily close above 16,600 (ATH) would confirm volume is returning.
- Target: 17,505 .
> 🛡️ Support (The "Must Hold"):
- Immediate Support: 16,375 . The breakout level must hold on a closing basis.
- Stop Loss: A close below 16,193 (recent consolidation high) would confirm a "fakeout" and likely send the stock back to 15,250.
Conclusion
Technically, the box breakout is valid , but the volume is weak . The safest play is to wait for a close above 16,600 to confirm strength.

Indus Towers (W): Strongly Bullish - Turnaround BreakoutTimeframe: Weekly | Scale: Linear
The stock is on the verge of a major structural breakout from a decade-long corrective phase. This move is supported by a massive volume expansion and a "trifecta" of positive fundamental news.
🚀 1. The Fundamental Catalyst (The "Why")
The massive volume surge (32M+) is a direct reaction to major positive developments:
1. VIL Dues Recovery: Vodafone Idea has started clearing past dues, significantly improving Indus Towers' cash flow visibility.
2. Credit Rating Upgrade: ICRA recently upgraded the company's long-term rating to AAA (Stable) , the highest level of safety, signaling financial robustness.
3. Promoter Confidence: Bharti Airtel has increased its stake to >51%, solidifying its commitment.
📈 2. The Long-Term Structure (The Breakout)
- The "Lid" (Angular Resistance): The stock has been suppressed by a downward angular resistance since its historic highs (2015-2017). Breaking this trendline signals a multi-year trend reversal.
- The Consolidation: Since April 2024, the stock has formed a "base" with Equal Lows (~₹315) and Lower Highs, effectively coiling for a move.
- The "Ignition": This week’s 3.65% surge with 32.5 Million volume is the "ignition" signal. It shows that buyers are finally aggressive enough to challenge the long-term supply zone.
📊 3. Technical Indicators
Indicator analysis confirms the momentum shift:
- EMA: The short-term EMAs are in a Positive Crossover state across Monthly, Weekly, and Daily timeframes, confirming a synchronized bullish trend.
- RSI: Rising across all timeframes, indicating that momentum is expanding into the breakout.
🎯 4. Future Scenarios & Key Levels
The stock is right at the "make or break" point.
- 🐂 Bullish Breakout (Confirmation):
- Trigger: A decisive Weekly Close above ₹430 (the recent 52-week high).
- Target: ₹473 – ₹480 . This aligns with the 2017 All-Time High zone.
- 🛡️ Support (The "Must Hold"):
- Immediate Support: ₹394 . If the breakout fails, the stock must hold this level to keep the short-term uptrend alive.
- Stop Loss: A close below ₹380 would invalidate the current momentum.
Conclusion
This is a High-Conviction Setup . The combination of a multi-year technical breakout and strong fundamental turnaround (cash flow + ratings) makes this a prime candidate for a re-rating. Watch for a close above ₹430 .

Hatsun Agro: Poised for a Potential Breakout?Hatsun Agro is currently exhibiting a constructive technical setup within a well-defined ascending channel. The price action on July 21st, characterized by a strong bullish candle on significant volume, indicates a robust rejection of the channel's lower support trendline. The stock is now directly challenging a critical horizontal resistance zone. A decisive close above this area could validate the bullish momentum and unlock significant upside potential towards previously established highs.
Since April 2025, the stock has been trading within a clear ascending channel. This pattern is inherently bullish, indicating a structured uptrend with higher highs and higher lows. The recent bounce from the lower support trendline ( the red line ) confirms the validity and strength of this ongoing trend.
The horizontal zone, marked in green , represents the most immediate and critical hurdle. It is a "confluence zone" where horizontal price resistance (derived from the highs in February and March) intersects with the channel's internal structure. This area has acted as a ceiling, rejecting upward attempts in late May and early June. Breaking this supply zone is the key to unlocking the next leg of the rally.
The trading session on July 21st (Today) was accompanied by a substantial surge in volume. This high volume on a strong bullish candle originating from channel support is a powerful signal. It suggests strong buying conviction and provides a robust foundation for the attempt to break through the overhead resistance.
The Structural Resistance at ₹1,116.45
This is the most logical and significant primary target following a breakout. This level represents the major high from January 2025. It is a natural magnet for price and a likely area where traders who bought the breakout would look to take initial profits.
Disclaimer: The information provided in this technical analysis is for informational and educational purposes only and should not be construed as financial or investment advice. It is an interpretation of historical price data. Market dynamics can change, and past performance is not indicative of future results. All trading and investment activities involve risk. Always conduct your own thorough due diligence and consult with a qualified financial advisor before making any investment decisions.

Apollo Tyres (D): Bullish, Momentum Building at ResistanceTimeframe: Daily | Scale: Linear
The stock is staging a strong recovery from the lower end of its consolidation range. It is now challenging the critical supply zone, backed by rising volume and positive fundamental developments (pledge release).
🚀 1. The Fundamental Catalyst (The "Why")
The renewed buying interest is driven by two key factors:
- Pledge Release: On Nov 17, 2025 , Catalyst Trusteeship released a massive pledge on 63 Million shares (approx. 9.9% stake). The removal of this overhang is a major confidence booster for investors.
- Softening Input Costs: Recent reports suggest a bearish outlook for Crude Oil (a key raw material for synthetic rubber), which directly improves margin outlooks for tyre companies.
📈 2. The Technical Structure (The "Box")
> The Range: The stock has been trapped in a wide "Box" pattern:
- Floor (Support): ₹364 – ₹370 . This level has held firm since May 2023, acting as a strong accumulation zone.
- Ceiling (Resistance): ₹545 – ₹550 . This zone (active since Jan 2024) has rejected multiple rally attempts, including the failed breakout to the ATH of ₹585 in Sep 2024.
> Current Action: The stock is currently consolidating just below this resistance.
- The Surge: Today's move (closing ~3% up) with 1.52 Million volume indicates that bulls are gathering strength to attack the resistance again.
📊 3. Technical Indicators
Indicator analysis shows a synchronized bullish trend:
- EMAs: The PCO (Positive Crossover) state across Monthly, Weekly, and Daily timeframes confirms that the trend is aligning upwards across all horizons.
- RSI: Rising across all timeframes, showing that momentum is expanding into the breakout attempt.
🎯 4. Future Scenarios & Key Levels
The stock is at a decision point. We need a confirmed breakout to avoid another rejection.
- 🐂 Bullish Breakout (The Trigger):
- Condition: A decisive Daily Close above ₹550 .
- Target 1: ₹585 (The ATH). This is the immediate magnet.
- Target 2: ₹630 . If the stock enters "blue sky" discovery, this is the technical extension target.
- 🐻 Bearish Rejection (The Range Play):
- Condition: If the stock faces heavy selling at ₹545-550 again.
- Support: The stock would likely drift back to the mid-range support at ₹512 or the 20-day EMA.
Conclusion
The setup is promising. The Pledge Release removes a major structural risk, and the technicals are aligned. However, do not anticipate the breakout. Wait for a close above ₹550 to confirm that the "ceiling" has finally been shattered.

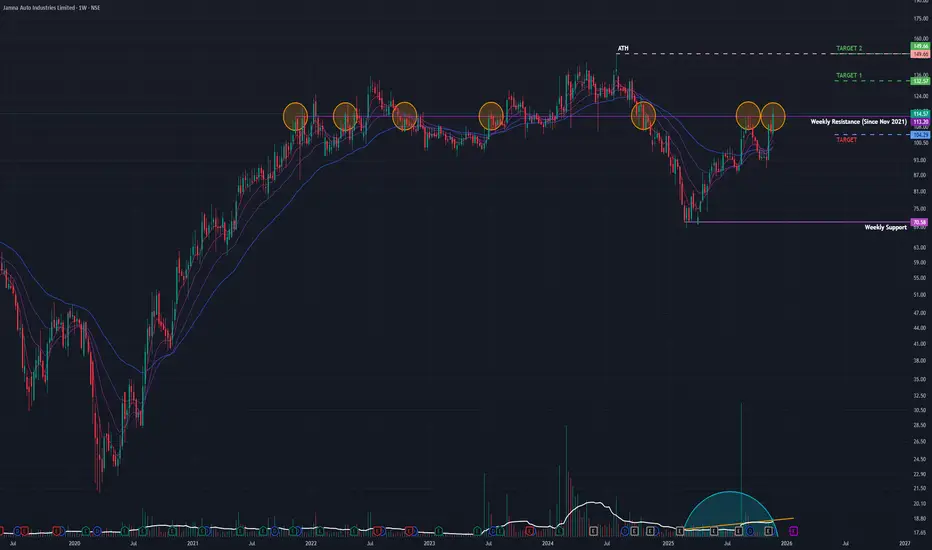
Jamna Auto - Strongly Bullish - Expansion-Driven Breakout(Timeframe: Weekly | Scale: Logarithmic)
The stock has confirmed a decisive breakout from a multi-year resistance zone. This move is supported by a significant capacity expansion announcement, rising volume, and a bullish structural shift.
🚀 1. The Fundamental Catalyst (The "Why")
The breakout is driven by a clear growth narrative that is attracting institutional interest:
- ₹132 Cr Expansion Plan: The company recently announced a major investment to set up new manufacturing facilities. This signals management's confidence in future demand.
- Steady Earnings: Q2 FY26 results showed stable profitability (Net Profit ~₹40 Cr) and declared an interim dividend, providing a fundamental floor to the price.
- Impact: This news has acted as the trigger for the stock to finally clear the 112-114 hurdle.
📈 2. The Long-Term Structure (The Breakout)
- The "Lid" (112-114 Zone): This is the critical polarity zone. It has acted as both support and resistance since Nov 2021 . Breaking a level with 4 years of history is a significant technical event.
- The Breakout: This week’s surge of 8.53% with 17.84 Million in volume is a high-conviction move. The decisive close above ₹114 confirms that the "supply" at this level has finally been absorbed.
- Volume Profile: The "rising volume" in recent weeks confirms that smart money is accumulating shares in anticipation of the expansion benefits.
📊 3. Technical Indicators
Indicator analysis shows a synchronized bullish trend:
- EMAs: Short-term EMAs are in a PCO state across Monthly and Weekly timeframes, confirming that the trend is aligning upwards.
- RSI: The Relative Strength Index is rising without being extremely overbought, leaving room for further upside momentum.
🎯 4. Future Scenarios & Key Levels
With the "lid" removed, the stock is primed for a recovery rally.
- 🐂 Bullish Targets:
- Target 1: ₹132 . This is the first logical resistance.
- Target 2: ₹149 (The ATH). A retest of the all-time high is the ultimate objective of this breakout structure.
- 🛡️ Support (The "Must Hold"):
- Re-test Zone: The ₹112 – ₹114 zone has now flipped to support. A pullback to this level would be a healthy re-test.
- Stop Loss: If the momentum fails, the stock must not close below ₹104 . Losing this level would invalidate the breakout and trap the new buyers.
Conclusion
This is a high-quality setup. The combination of a multi-year resistance breakout and a tangible expansion plan makes this a strong candidate for a move toward ₹132 . Watch for stability above ₹114 .
Ujjivan SFB (D): Strongly Bullish, Testing 5-Year ResistanceThe stock is staging a powerful recovery from its 2025 lows. It is currently challenging a critical "confluence resistance" zone (₹54-₹56) that dates back to Feb 2020. A breakout here would trigger a major structural shift.
📈 1. The Long-Term Context (The "U-Shape" Recovery)
- The Fall: After hitting its All-Time High (ATH) of ₹63 in Dec 2023, the stock entered a steep 15-month correction, losing ~51% of its value by early 2025.
- The Recovery: Since March 2025, the stock has been in a steady uptrend, effectively creating a large "Rounding Bottom" or "Cup" structure.
- The "Lid" (Feb 2020 Resistance): The ₹54 – ₹56 zone is not just a random level; it aligns with the major structural resistance from February 2020 (pre-COVID highs). Breaking this would mean clearing a 5-year hurdle.
🚀 2. The Fundamental Catalyst (The "Why")
The recent bullishness is supported by improving fundamentals, which validates the technical breakout:
- Record Disbursements: In the recent Q2 results, the bank reported its highest-ever quarterly disbursements , signaling strong business growth.
- Asset Quality: Stable asset quality is attracting institutional interest, as seen in the volume spike.
💥 3. Today's Price Action (Nov 26, 2025)
- The Surge: The stock surged +3.84% , closing near the day's high.
- Volume Expansion: The move was backed by massive volume of 30.09 Million shares.
- Volume Trend: This spike comes after a period of declining volume , which is a classic "volatility contraction" setup. The sudden expansion today confirms fresh buyer participation.
📊 4. Technical Indicators
- EMAs: Short-term EMAs are in a PCO (Price Crossover) state across Monthly, Weekly, and Daily timeframes, confirming aligned bullish momentum.
- RSI: The Relative Strength Index is rising across all three timeframes, showing that momentum is accelerating into the breakout.
🎯 5. Future Scenarios & Key Levels
The stock is currently inside the breakout zone.
- 🐂 Bullish Case (Breakout):
- Trigger: A decisive weekly close above ₹56 .
- Target: The primary target is a retest of the ATH at ₹63 . Beyond that, the stock enters "blue sky" price discovery.
- 🐻 Bearish Case (Rejection):
- Trigger: If the 5-year resistance (₹56) proves too strong and sellers step in.
- Support: The stock would likely fall back to the ₹53 level (immediate support) or the 20-day EMA to gather more strength.
Conclusion
The setup is highly potent because it combines a technical recovery with a 5-year structural breakout attempt. Watch for a sustained close above ₹56 to confirm the run to ₹63 .

Man Industries (W): Bullish, Turnaround with Volatility(Timeframe: Weekly | Scale: Logarithmic)
The stock is in a confirmed structural uptrend (Higher Lows) following a year-long correction. It is currently battling a critical multi-year resistance zone, backed by strong fundamental news and rising volume.
📈 1. The Structural Turnaround (The "Big Picture")
- The Cycle: Trend analysis:
- Consolidation: Jan 2024 – July 2024.
- The Peak (ATH): The stock hit a major high in July 2024
- The Correction: A downtrend followed, bottoming out in March 2025.
- The Reversal: Since March 2025, the stock has shifted character, forming a clear series of Higher Lows, signaling that buyers are stepping in at higher prices.
🚀 2. The Catalyst & Recent Action (Week of Nov 17)
- The Catalyst (The "Why"): The recent surge is driven by the company signing a Memorandum of Understanding (MoU) with Aramco Asia India (a subsidiary of Saudi Aramco) to explore a manufacturing facility in Saudi Arabia. This news triggered the volume spike.
- The Breakout Attempt: Last week (Nov 17-21), the stock attacked the horizontal resistance zone.
- Surge: It rallied +5.60% for the week.
- Volume: The move was supported by 5.22 Million in volume —a significant pickup compared to the "dry" correction phase.
- The Rejection: Despite hitting a new 52-week high intraday (₹472.40 on Nov 20), the stock failed to close above the resistance, facing profit-taking near the highs.
📊 3. Technical Indicators
- Trend: Short-term EMAs are in a PCO (Price Crossover) state on Monthly & Weekly charts, confirming the uptrend.
- Momentum (RSI):
- Weekly/Monthly: RSI is rising, supporting the longer-term bullish view.
- Daily: The Daily RSI dipped on Friday, reflecting the immediate rejection/profit-taking at resistance.
🎯 4. Future Scenarios & Key Levels
The "Shooting Star" style rejection on the weekly chart makes the coming week critical.
🐂 Bullish Case (Breakout Confirmation)
- Trigger: A sustained close above the ₹465–₹475 zone.
- Target 1: ₹545
- Target 2: ₹645 (Blue-sky extension).
🐻 Bearish Case (Support Test)
- Trigger: If the "failed breakout" leads to further profit-taking.
- Support: The immediate support lies at ₹420. Holding this level is crucial to maintain the "Higher Low" bullish structure.
Conclusion
The stock is structurally bullish but is digesting a supply overhang at the All-Time Highs. The Aramco news provides a strong floor, but patience is needed for a decisive close above ₹475 to confirm the next leg up.

Tata Consumer (W): Bullish, Consolidation Breakout(Timeframe: Weekly | Scale: Logarithmic)
The stock is emerging from a 9-month sideways consolidation phase. While it has cleared the immediate resistance, the major test lies at the All-Time High (ATH) zone. The formation of bullish reversal candles on the weekly chart suggests buyers are regaining control.
📈 1. Trend & Structure (The "Box" Breakout)
- The Context: Since hitting its peak in Mar 2024, the stock has been trapped in a sideways "box" range.
- The Breakout: This week, the stock managed to close above the immediate horizontal resistance (approx. ₹1,170 - ₹1,180 ).
- Clarification on Resistance: It is important to note that while this is a breakout of the consolidation range, the major All-Time High resistance (around ₹1,240 - ₹1,253) is still just overhead. This is the final hurdle before "blue sky" territory.
🕯️ 2. Candlestick Analysis (The Bullish Signal)
- Hammer Candles: The last two weekly candles resemble Hammer formations (long lower wicks with small bodies).
- Interpretation: This indicates that every time sellers pushed the price down (towards ₹1,130-₹1,140), aggressive buying emerged to push it back up. This "rejection of lower prices" is a classic sign that the bottom is in.
📊 3. Indicators & Volume
- Volume Profile: Volume "dried up" significantly during the correction, and we are now seeing a gradual expansion in volume on up-weeks, indicating institutional accumulation.
- EMAs: The short-term EMAs are realigning into a bullish PCO (Price Crossover) state, confirming the trend shift.
- RSI: The RSI is rising from the mid-zone (above 50), showing that momentum is building without being overbought yet.
🎯 4. Future Scenarios & Targets
- 🐂 Target 1: ₹1,355 (Achievable once ₹1,253 is cleared).
- 🐂 Target 2: ₹1,570 (Long-term extension).
- 🛑 Support (The Safety Net): If the breakout fails, the stock will likely retest the demand zone at ₹1,040.7
Key Watchout
Watch the price action near ₹1,250. A high-volume close above this level is the "final confirmation" needed to activate the targets of ₹1,355+. Until then, it is a "buy on dips" setup.

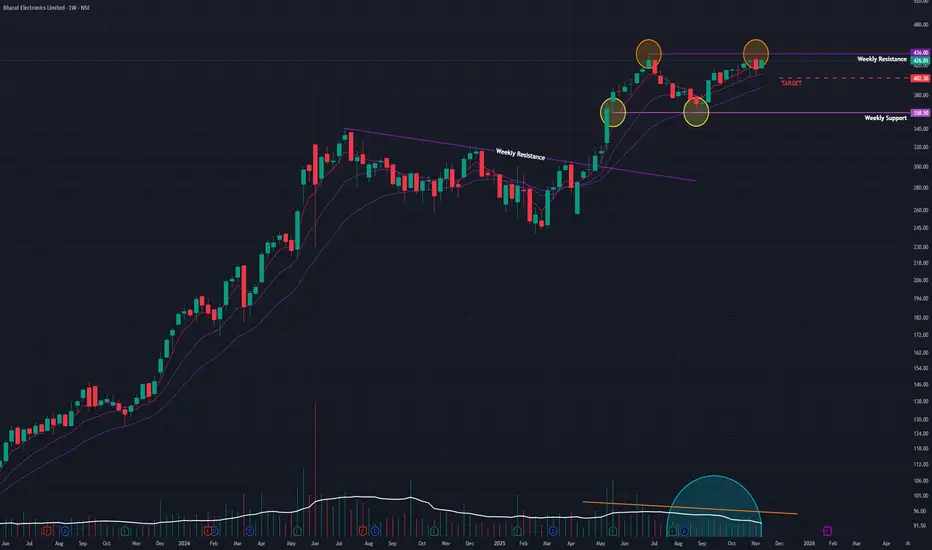
BEL (W): Primed for ATH BreakoutBased on Weekly Timeframe, Logarithmic Scale
This is a classic "coiling spring" setup. The stock is in a tight, bullish consolidation right below its all-time high. A powerful combination of fundamental catalysts, bullish high-timeframe indicators, and classic volume contraction suggests a breakout is highly probable.
🚀 1. The Fundamental Catalysts (The "Why")
This bullish technical pattern is fully supported by a torrent of positive fundamental news, providing a strong "tailwind" for the stock:
- Strong Q2 Earnings: On Oct 31, BEL reported a 26% rise in revenue and an 18% rise in net profit for Q2 2026, beating estimates.
- Massive Order Inflow: The company is announcing new, large-scale orders almost weekly, including ₹792 crore (Nov 10) and ₹871 crore (Nov 14). This provides high visibility for future earnings.
📈 2. The Dominant Pattern: Bullish Consolidation
- The "Flagpole": The stock made a strong move up to its All-Time High (ATH) in June 2025.
- The "Flag": Since then, it has been in a sideways consolidation phase , trading in a tight range just ~2% below its ATH.
- Drying Volume: Volume has been drying up during this consolidation. This is a classic, powerful sign that sellers are exhausted ("supply has dried up") and the stock is being accumulated.
- Recent "Ignition": Last week's +3.04% surge on 73.21M in volume was a significant "ignition" signal, showing that buyers are starting to re-emerge and test the resistance.
📊 3. Confluence of Bullish Indicators
The "trifecta" of bullishness on high timeframes is exceptionally strong:
- RSI: The Relative Strength Index is rising on both the Monthly and Weekly charts, showing that long-term momentum is firmly on the side of the buyers.
- EMAs: The short-term Exponential Moving Averages are in a "PCO" (Price Crossover) state on both the Monthly and Weekly charts, confirming the long-term trend is up.
🎯 4. Future Scenarios & Key Levels to Watch
The price action next week is critical.
🐂 The Bullish Case (Breakout)
- Trigger: A decisive, high-volume weekly close above the ATH resistance (₹436).
- Confirmation: This would confirm the end of the 5-month consolidation and the start of a new leg up into "price discovery."
- Target: The next logical technical price target is around ₹530 .
🐻 The Bearish Case (Breakdown)
- Trigger: If the stock fails to break out and momentum is lost (e.g., due to a broader market pullback).
- Confirmation: The stock would need to break below.
- Target: A failure would see the stock fall to retest its immediate support level at ₹400 .
Conclusion
A "wait and watch" approach is ideal, but the evidence is heavily skewed to the upside. The combination of a perfect technical pattern (high tight flag), bullish high-timeframe indicators, and a powerful fundamental story (earnings + new orders) makes this a textbook setup for an ATH breakout.
Thyrocare (W): Strongly Bullish, Multi-Year BreakoutBased on Weekly Timeframe, Logarithmic Scale
This is a textbook, high-conviction breakout. The stock has decisively broken a 4-year consolidation, backed by strong fundamentals and a powerful confluence of high-timeframe technical indicators.
📈 1. The Multi-Year Setup
- The 2021 Peak: After its ATH in June 2021 (at ~₹1,465 ), the stock entered a steep, 2-year downtrend.
- The 2023 Bottom: This trend found its bottom in March 2023 .
- The Recovery & Base: Since then, the stock has been in a 2.5-year recovery, building a massive base. This upward move was further halted by the horizontal resistance at the ₹1,465 level, which it failed to break on previous attempts.
🚀 2. The Fundamentally-Driven Breakout (Last Week)
Last week, this entire 4-year pattern changed:
- The Catalyst: Strong Q2 2026 earnings provided the "fuel" for a major move.
- The Surge: The stock surged +12.43% for the week.
- The Volume: This move was backed by a 3.45 Million share volume spike. This comes after a period of average volume, confirming institutional interest.
- The Close: The stock achieved a weekly close above ₹1,465 , confirming the breakout is not just an intraday spike.
📊 3. Confluence of Bullish Indicators
The alignment on high timeframes is exceptionally bullish:
- RSI: The Relative Strength Index is rising on both the Monthly and Weekly charts.
- EMAs: The short-term Exponential Moving Averages are in a "PCO" (Price Crossover) state on both the Monthly and Weekly charts.
- Volume: A clear spike on the breakout after a steady rise, confirming the move's validity.
🎯 4. Future Scenarios & Key Levels to Watch
🐂 The Bullish Case (Continuation)
- Trigger: If the bullish momentum continues, the stock is in a new "blue-sky" uptrend.
- Target: The next logical long-term price target is at ₹2,000 levels.
🐻 The Pullback Case (Healthy Re-test)
- Trigger: If the stock pauses to digest its 12.5% weekly gain or if the broader market pulls back.
- Support: The price would likely fall to re-test the resistance-turned-support level at ₹1,465 . A "bounce" off this level would be a classic, healthy confirmation of the breakout and an ideal entry point for those who missed the initial surge.

Borosil (W): Cautiously Bullish, Awaiting Breakout ConfirmationThis is a classic "wait and watch" scenario. The stock is in a multi-year base-building pattern, and all signs point to a significant bullish breakout. However, a formidable resistance has not yet been broken.
📈 1. The Long-Term Context
- Multi-Year Consolidation: The stock has been in a wide, sideways consolidation phase since its All-Time High (ATH) in April 2022.
- The "Lid": This entire 3.5-year pattern has been capped by a critical horizontal resistance trendline formed since December 2021 . This level is the single most important line on the chart.
🚀 2. The Current Setup (The "Battle at Resistance")
- The "Battle": For the past five weeks , the stock has been actively "battling" this multi-year resistance.
- The Failure (So Far): While there have been multiple attempts, the stock has failed to secure a weekly close above this level .
- Bullish Volume: After a long "dry period," volume is slowly rising. Crucially, these breakout attempts are being accompanied by volume spikes , showing that buyer conviction is growing.
📊 3. Confluence of Bullish Indicators
The alignment of the Monthly and Weekly timeframes is a very powerful sign:
- RSI: The Relative Strength Index is rising on both the Monthly and Weekly timeframes, showing that long-term momentum is building.
- EMAs: The short-term Exponential Moving Averages are in a "PCO" (Price Crossover) state on both the Monthly and Weekly timeframes, confirming the long-term trend is turning bullish.
🎯 4. Future Scenarios & The "Game Plan"
🐂 The Bullish Case (Confirmation)
- Trigger: We need to see a decisive weekly close above the horizontal resistance.
- Confirmation: The "gold standard" confirmation, would be a successful "re-test" —where the stock pulls back, touches the old resistance, and "bounces" off it as new support.
- Target 1: ₹840
- Target 2: ₹1,130
🐻 The Bearish Case (Breakout Failure)
- Trigger: If this 5-week "battle" results in a strong rejection and momentum is lost.
- Target: The stock will likely fall to retest its immediate support level at ₹635 .
Conclusion
The rising volume and bullish high-timeframe indicators are pressing against a multi-year resistance. The breakout, if it is confirmed, will be significant. The best approach is patience.

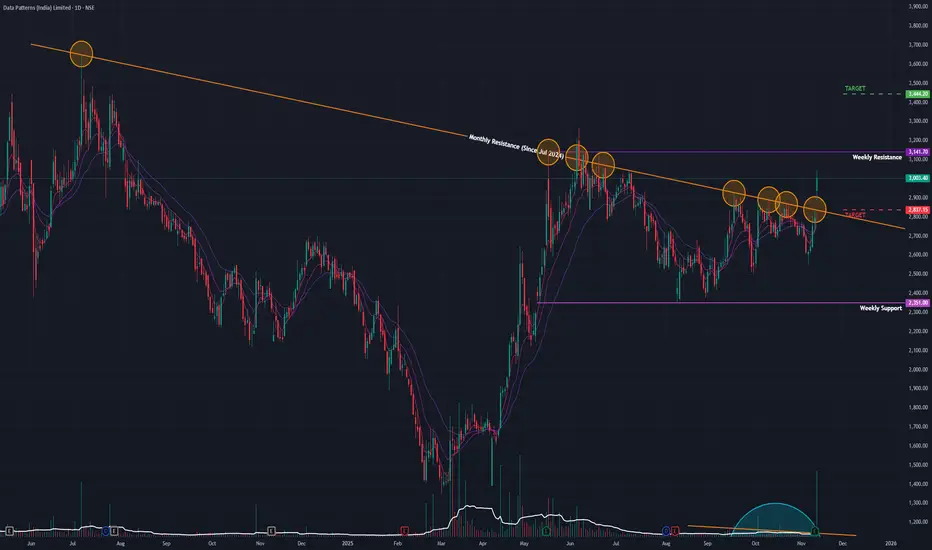
Data Patterns (D): Strongly Bullish, Fundamentally Driven BOThis is a high-conviction breakout event. The stock has decisively broken its 17-month angular resistance, driven by blockbuster quarterly earnings. All indicators are aligned, but the stock now faces its final horizontal resistance, which will determine the next major leg up.
🚀 1. The Fundamental Catalyst (The "Why")
Today's move is not speculative. It is a direct response to record-breaking Q2 2026 earnings :
- Revenue: Surged 238% year-over-year to ₹307.46 crore.
- Net Profit: Grew 62.5% year-over-year to ₹49.19 crore.
- Market Reaction: The gap-up open and +7.56% surge on 6.29 Million in volume confirms massive institutional interest.
📈 2. The Long-Term Context (The Setup)
- The 2024-2025 Correction: After its ATH in July 2024 , the stock entered a long-term downtrend.
- The Reversal: This trend found its bottom in March 2025 , and the stock began its recovery.
- The Angular Resistance: This recovery was capped by the angular resistance trendline from the July 2024 ATH.
- Drying Volume: Volume was drying up during the consolidation since May 2025—a classic sign of accumulation.
🎯 3. The Dual Resistance Battle
- Part 1 (CLEARED): Today, the stock gapped up and closed decisively above the 17-month angular resistance trendline. This is a significant bullish victory.
- Part 2 (THE NEXT HURDLE): The stock now faces a major horizontal resistance at ₹3,141 . This level is the last line of defense for the bears.
📊 4. Confluence of Bullish Indicators
This breakout is supported by a rare "trifecta" of bullish signals across all timeframes:
- EMAs: Short-term Exponential Moving Averages are in a "PCO" (Price Crossover) state on the Daily, Weekly, and Monthly charts .
- RSI: The Relative Strength Index is rising on the Daily, Weekly, and Monthly charts .
This alignment of all three timeframes gives the breakout very high technical validity.
🧠 5. Future Scenarios & Key Levels to Watch
🐂 The Bullish Case (Confirmation)
- Trigger: A decisive, high-volume close above the horizontal resistance at ₹3,141 .
- Target: This would confirm the start of a new bull run, and the target of ₹3,445 is the next logical objective.
🐻 The Pullback Case (Healthy Re-test)
- Trigger: If the stock is rejected at ₹3,141 or needs to pause after its big run.
- Support: The price would likely fall to re-test the angular trendline it just broke, at the identified level of ₹2,817 . A "bounce" off this level would be a textbook, healthy confirmation of the new support.