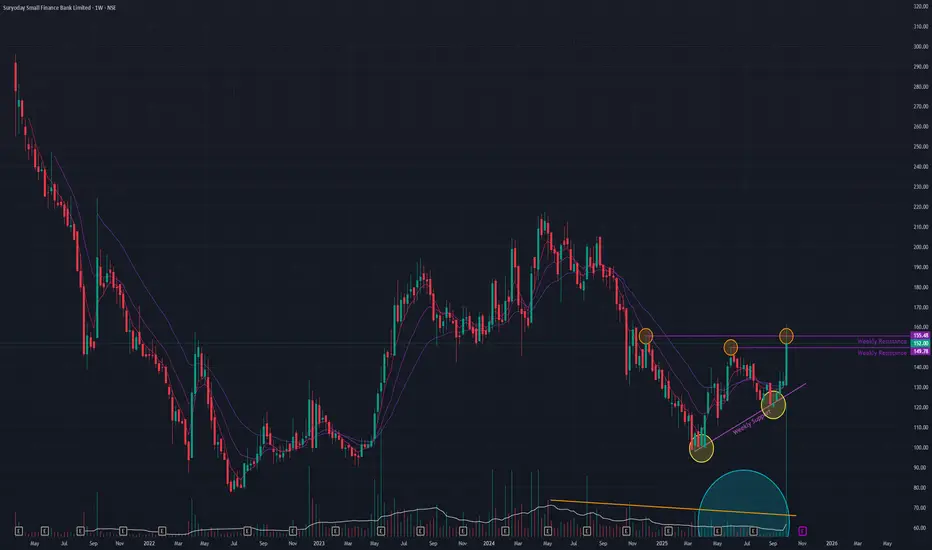
Suryoday (W) - Shows Reversal Signs but Halts at Key ResistanceSuryoday Small Finance Bank is showing signs of a potential trend reversal, marked by the recent formation of Higher Lows . Last week, the stock made a significant move, surging +14.38% on massive volume. During this session, it broke through two minor resistances but ultimately closed below a critical long-term resistance level .
This price action indicates a powerful attempt by buyers that was met with significant selling pressure at a key technical barrier.
Conflicting Technical Signals
The current technical landscape presents a mixed picture, highlighting the uncertainty at this juncture:
Bullish Signs 👍:
- Weekly Momentum: On the weekly timeframe, both the short-term Exponential Moving Averages (EMAs) and the Relative Strength Index (RSI) are in a bullish crossover state.
Bearish Signs 📉:
- Declining Volume: The overall trading volume has been drying up , which typically signals a lack of conviction from buyers, despite last week's volume spike.
Outlook: A Decisive Week Ahead
The stock is at a critical inflection point. The powerful surge last week shows bullish intent, but the failure to close above resistance and the low overall volume are causes for caution. The price action in the upcoming week will be crucial in determining whether the stock has the strength to finally break through resistance or if it will be rejected again.
Potentialbreakout
IFGL (D) - Rejects at Key Resistance Despite Massive VolumeIFGL Refractories is currently at a critical inflection point after a dramatic but ultimately unsuccessful breakout attempt. Yesterday, the stock surged an incredible +18.35% on massive, multi-year high trading volume, piercing a key horizontal resistance trendline .
However, the momentum was not sustained. Today, the stock faced selling pressure and closed back below this critical resistance level, signaling that sellers are still active at this price zone. This price action follows a period of uptrend and consolidation that began after the stock's initial downtrend from its All-Time High in December 2023.
Overwhelmingly Bullish Underlying Indicators 👍
Despite the failure to hold the breakout, the underlying technical picture remains exceptionally strong:
- Universal Bullish Crossover: Both the short-term Exponential Moving Averages (EMAs) and the Relative Strength Index (RSI) are in a confirmed bullish crossover state across the monthly, weekly, and daily charts .
- Volume Thrust: Yesterday's massive volume spike indicates a significant level of interest in the stock, even if it resulted in a short-term rejection.
Outlook: Awaiting a Confirmed Breakout
The stock is in a classic battle between strong underlying momentum and a stubborn overhead resistance. A decisive and sustained close above the resistance line is now required to confirm the next leg up.
- Bullish Case 📈: If buyers can overcome the selling pressure and secure a confirmed breakout, the next potential target is the ₹342 level.
- Bearish Case 📉: If the resistance continues to hold and momentum fades, the stock could pull back to find support near the ₹237 level. The price action in the coming days will be crucial.

BBox (D) - Confirms Major Breakout After Prolonged StruggleBlack Box has successfully broken out from a major angular resistance trendline that had been a significant barrier since the stock's trend reversed in April 2025. After multiple failed attempts, the stock has spent the last few days decisively trading above this line, a move validated by sustained high volume and successful retests of the broken resistance as new support.
The breakout was further emphasized yesterday when the stock opened with a significant gap up , firmly establishing its position above the trendline. This entire sequence follows a bullish Double-Bottom reversal pattern in April 2025, which ended the downtrend from the stock's All-Time High in December 2024.
Comprehensive Bullish Confirmation 👍
The technical outlook is overwhelmingly positive, with strong confirmation across multiple timeframes:
- Multi-Timeframe Strength: The short-term Exponential Moving Averages (EMAs) are in a bullish crossover state across the daily, weekly, and monthly charts .
- Broad Momentum: The Relative Strength Index (RSI) also confirms a bullish crossover on the daily and weekly charts and is on the verge of doing so on the monthly chart.
- Volume Thrust: The breakout and subsequent trading have been characterized by exceptionally high volume , indicating strong institutional interest.
Outlook and Next Hurdle
While the breakout from the angular resistance is confirmed, the stock now faces another challenge: a long-term horizontal resistance trendline .
- Bullish Case 📈: If the current momentum is sustained and the stock can breach this upcoming horizontal resistance, the path could be clear for a move towards the ₹630 level.
- Bearish Case 📉: If this breakout proves to be false and momentum fades, the stock could pull back to find support near the ₹450 level. The price action in the coming days remains critical.

NALCO (D) - Challenges Major Resistance with Strong MomentumNational Aluminium is making a powerful attempt to break through a major resistance level that has previously thwarted several breakout attempts. The stock surged +4.88% today, closing at ₹213.87 on the back of exceptionally high trading volume, signaling strong buyer interest at this critical juncture.
This move is part of a broader uptrend that began in April 2025, which itself was a reversal from a downtrend following the stock's All-Time High in November 2024.
Broad-Based Bullish Signals Building 👍
The underlying technical picture is strong and showing signs of further improvement:
- Confirmed Long-Term Strength: The short-term Exponential Moving Averages (EMAs) are in a bullish crossover state on both the monthly and weekly charts. The Relative Strength Index (RSI) also confirms a bullish crossover on the weekly chart.
- Developing Daily Momentum: On the daily chart, both the EMAs and RSI are on the verge of a bullish crossover , which would provide immediate-term confirmation. The monthly RSI is in a similar poised-to-cross state.
- Volume Thrust: Today's price surge was driven by massive volume , indicating a high level of conviction from buyers.
Outlook: Awaiting a Decisive Breakout
The stock is at a pivotal point. While the indicators are overwhelmingly bullish, a confirmed close above the current resistance is necessary.
- Bullish Case 📈: If the stock successfully breaks and sustains its position above the key resistance, especially on good volume, the next potential price target is the ₹245 level.
- Bearish Case 📉: If it is rejected at this resistance once again and momentum fades, the stock could pull back to find support near the ₹195 level.

Munjal Au (D) - Challenges Major Resistance with Strong MomentumMunjal Auto Industries is showing significant bullish strength, surging +5.28% today on the back of massive trading volume. The stock has successfully broken through one long-term resistance and is now positioned just below a second, even more significant, long-term resistance level.
This powerful move is part of a broader trend reversal that began in March 2025, following a downtrend from the stock's All-Time High in October 2024.
Overwhelmingly Bullish Technical Confirmation 👍
The positive outlook is supported by a rare and powerful alignment of bullish indicators across all major timeframes:
- Broad-Based Momentum: Both the short-term Exponential Moving Averages (EMAs) and the Relative Strength Index (RSI) are in a bullish crossover state on the monthly, weekly, and daily charts .
- Golden Crossover: A Simple Moving Average (SMA) Golden Crossover occurred a few days ago, providing a strong long-term bullish signal.
- Volume Thrust: The recent price gains have been accompanied by significant volume spikes , indicating strong buyer conviction.
Outlook and Key Levels
The stock is at a critical juncture, facing a major long-term resistance. A successful breakout is required to confirm the next leg of the uptrend.
- Bullish Case 📈: If the upward momentum is sustained and the stock decisively breaks through the current resistance, the next potential target is the ₹127 level.
- Bearish Case 📉: If the stock is rejected at this major resistance and momentum fades, it could pull back to find support near the ₹90 level.

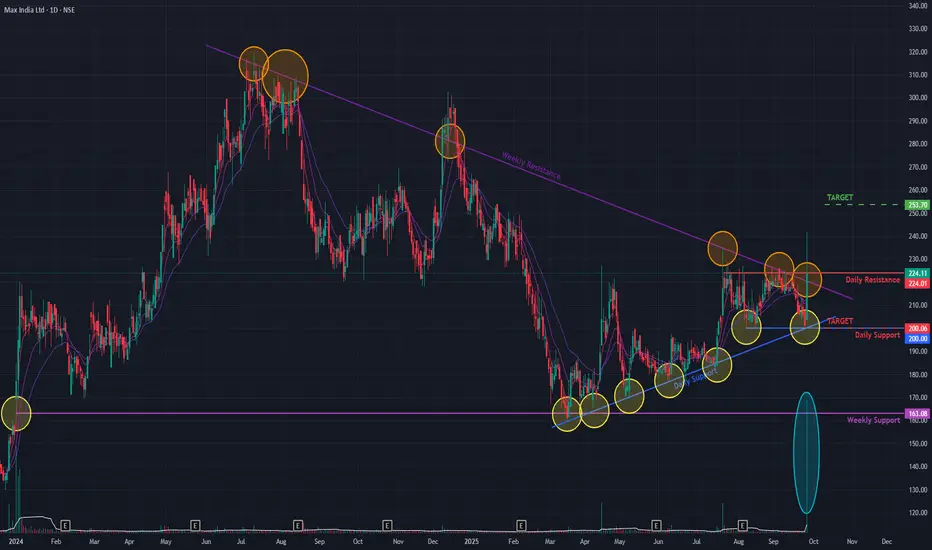
Max India (D) - Executes a Powerful Dual-Resistance BreakoutMax India has shown a significant bullish development, decisively breaking out of two key resistance levels today. The stock breached both a long-term angular resistance trendline from July 2024 and a short-term resistance from July 2025. This powerful move was confirmed by a massive surge of +14.95% on the back of exceptionally high trading volume, with the stock closing at ₹224.11 .
This breakout signals a potential acceleration of the reversal that began in March 2025, following a prolonged downtrend from the stock's All-Time High in July 2024.
A Mix of Bullish Indicators 👍
The technical landscape shows a confluence of positive signals, although some are still developing:
- Broad Momentum: The Relative Strength Index (RSI) is in a bullish crossover state on both the weekly and daily charts, confirming strong momentum.
- Long-Term Strength: A Golden Crossover appeared on the daily chart a few days ago, providing a strong long-term bullish signal.
- Developing Confirmation: While short-term Exponential Moving Averages (EMAs) show a bullish crossover on the weekly chart, they have not yet confirmed this on the daily timeframe, suggesting immediate-term momentum is still catching up.
Outlook: Awaiting Confirmation
While the breakout is powerful, re-confirmation is prudent. A common technical event is a retest of the broken resistance levels as new support.
- Bullish Case 📈: If the momentum continues and the breakout is sustained, the next potential target on the upside is the ₹250 resistance level.
- Bearish Case 📉: If the breakout fails to hold and momentum subsides, the stock could pull back to find support near the ₹200 level.
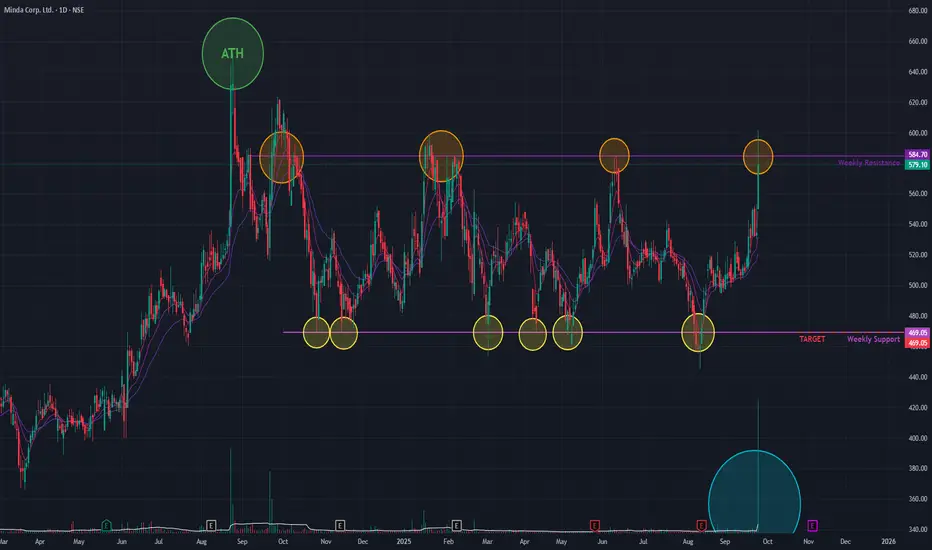
Minda Corp (D) - Challenges Major Resistance with Massive VolumeMinda Corp is making a powerful attempt to break out of a prolonged consolidation phase that has been in place since its All-Time High in August 2024. Today, the stock surged +8.34% on the back of exceptionally high trading volume —the largest spike seen in a considerable time.
The stock challenged a major resistance trendline that has been a barrier since September 2024, rejecting multiple breakout attempts. While today's price action breached this level intra-day, it failed to achieve a close above it , signaling that the battle between buyers and sellers at this critical juncture is not yet over.
Broad-Based Bullish Signals 👍
Despite the failed closing, the underlying technical picture is strong, with multiple indicators suggesting a bullish bias:
- Multi-Timeframe Strength: The short-term Exponential Moving Averages (EMAs) and the Relative Strength Index (RSI) are all indicating bullish crossovers on the monthly, weekly, and daily charts .
- Volume Thrust: Today's massive volume spike underscores the significant buying interest at this resistance level, even if it was not enough to secure a close above it.
Outlook: Awaiting a Decisive Close
The stock is at a critical inflection point. A decisive close above the resistance line on high volume is now required to confirm a true breakout.
- Bullish Case 📈: If a confirmed breakout occurs and the momentum is sustained, the next potential target is the resistance zone near ₹701 .
- Bearish Case 📉: If the stock is rejected again at this level, it could fall back to the lower end of its consolidation range, with a potential support level near ₹469 . The price action in the coming days will be crucial.
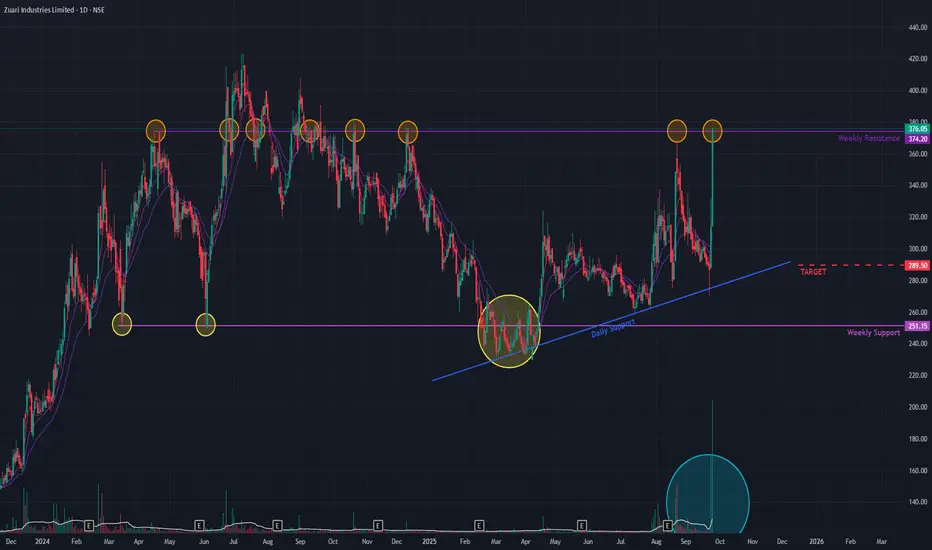
Zuari Ind (D) - Executes a Powerful BreakoutZuari Industries has decisively broken out of a prolonged consolidation phase, signaling a significant shift in momentum. Over the past two trading sessions, the stock has surged an incredible +29.72% , a move backed by a massive volume spike that validates the breakout from a key horizontal resistance level in place since April 2024. The stock closed today at ₹376.04 , hitting the 20% upper circuit.
This breakout appears more decisive than previous "fakeouts" due to the sheer force of the move and the exceptionally high volume. Furthermore, the strong closing candle, with its high and close being nearly identical, suggests intense buying pressure and a willingness for participants to push the price even higher.
Comprehensive Bullish Confirmation 👍
The bullish outlook is strongly supported by a rare alignment of positive indicators across all major timeframes:
- Multi-Timeframe Strength: Both the short-term Exponential Moving Averages (EMAs) and the Relative Strength Index (RSI) are indicating strong bullish crossovers on the monthly, weekly, and daily charts .
- Volume Thrust: The breakout was driven by enormous trading volume , indicating a high level of conviction and institutional participation.
Outlook and Key Levels
This powerful breakout has potentially initiated a new uptrend. The price action in the coming days will be crucial to confirm that buyers can absorb any profit-taking and hold the breakout level.
- Bullish Case 📈: If the current momentum is sustained, the next logical price target is the resistance zone near ₹497 .
- Bearish Case 📉: Should the breakout fail and momentum reverse, the stock could pull back to find support near the previous resistance (now support) level of ₹289 .
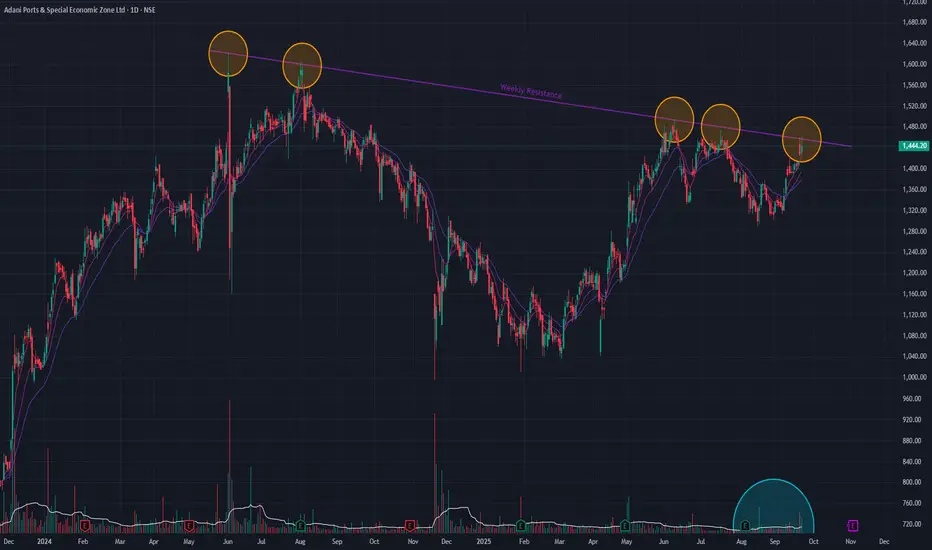
Adani Ports (Daily) - Coils for Potential BO at Critical ResAdani Ports is currently testing a significant long-term angular resistance trendline , a barrier that has persisted since the stock's All-Time High in June 2024. The stock has been in a sideways consolidation phase since March 2025, following a prolonged downtrend, and is now showing signs of building pressure against this key resistance.
Recent price action suggests a growing determination to break through, with breakout attempts becoming more frequent . Today's session saw a notable increase in trading volume, adding weight to this observation.
Broad-Based Bullish Signals 👍
The bullish case is strengthened by a confluence of indicators across multiple timeframes:
- Strong Momentum: On both the daily and weekly charts , short-term Exponential Moving Averages (EMAs) are in a bullish crossover state.
- Dual Confirmation: This is further corroborated by the Relative Strength Index (RSI) on both timeframes, which is also exhibiting a bullish crossover, confirming broad-based positive momentum.
Outlook: Awaiting Confirmation
The stock is at a critical inflection point. While multiple indicators are signaling a strong potential for an upward move, the long-term resistance remains a formidable obstacle. The price action in the coming days will be decisive. A confirmed breakout would signal the next major leg up, but until then, a cautious approach is warranted while waiting for the market to show its hand.
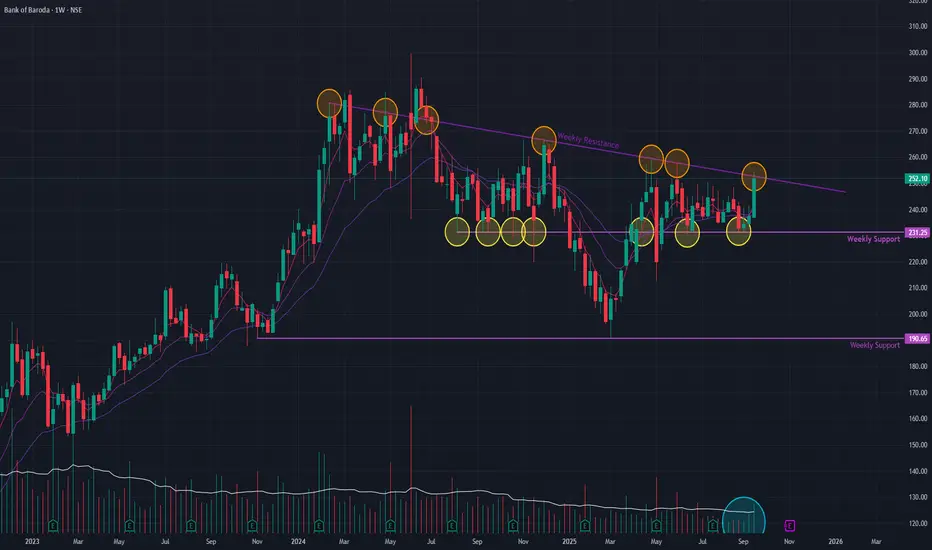
Bank of Baroda (Weekly) - Potential BreakoutBank of Baroda (BoB) is showing renewed strength as it challenges a key resistance level. The stock, which has been in a consolidation phase since its All-Time High in June 2024, made a significant upward move this week with a +6.15% price surge , backed by exceptionally high volume.
This powerful move brings the stock directly to a critical angular resistance trendline . This trendline has previously rejected several breakout attempts, establishing it as a major hurdle.
Bullish Indicators Signal Growing Strength 👍
The recent price action is supported by several positive technical signals:
- Volume Surge: The sharp price increase was accompanied by massive trading volume , indicating strong conviction from buyers.
- Momentum Confirmation: Both the short-term Exponential Moving Averages (EMAs) and the Relative Strength Index (RSI) have shifted into a positive crossover , confirming that bullish momentum is building.
Outlook: A Decisive Week Ahead
The stock is now at a critical juncture. The price action in the upcoming week will be crucial in determining whether this renewed momentum is strong enough to finally break through the persistent resistance. A successful breakout could signal the end of the consolidation phase, while another rejection could extend the sideways trend.
SBI (Weekly) - Breakout of sideways trendState Bank of India (SBI) has shown a significant bullish development this week, decisively breaking out of a key angular resistance trendline that has been in place since July 2024. This breakout, which follows a prolonged consolidation phase after its All-Time High in June 2024, was confirmed by a strong +4.71% price increase on the back of massive trading volume.
Confirmation from Multiple Indicators 👍
The positive outlook is strongly supported by several technical signals, suggesting a high degree of conviction in the recent move:
- Volume Surge: The breakout was accompanied by exceptionally high volume , indicating significant buying interest. The general trend of rising volume further validates the move.
- Momentum Indicators: Both the short-term Exponential Moving Averages (EMAs) and the Relative Strength Index (RSI) have entered a state of positive crossover, providing dual confirmation of building bullish momentum.
Outlook
Given the strength of the breakout and the confluence of bullish indicators, the path of least resistance appears to be upward. However, monitoring the price action in the upcoming week will be crucial to confirm that this breakout is sustained and not a false move.

InoxGreen (Weekly) - Major Breakout, Potential New UptrendInox Green Energy has shown significant bullish strength, breaking out of a key long-term horizontal resistance trendline last week. This crucial move was powered by a substantial +13.61% price surge and supported by decent trading volume, signaling a potential continuation of its upward trajectory.
This breakout follows a period of sideways consolidation that began in May 2025. The prior resistance had capped the stock's progress after its trend reversed in April 2025, following a downtrend from its All-Time High in September 2024.
Bullish Confirmation Signals 👍
The positive outlook is reinforced by key technical developments:
- Breakout Volume: The price surge was accompanied by **healthy volume**, indicating conviction behind the move.
- Momentum: Short-term Exponential Moving Averages (EMAs) also completed a positive crossover this week, a strong indicator of building upward momentum.
Future Outlook and Key Levels
The price action in the coming week will be critical for confirming the breakout's sustainability.
- Bullish Case 📈: If the upward momentum continues with strong volume, the stock could be on track to reach the next potential resistance level at ₹224 .
- Bearish Case 📉: However, if the stock fails to sustain the breakout momentum, it could pull back to find support near the ₹149 level.

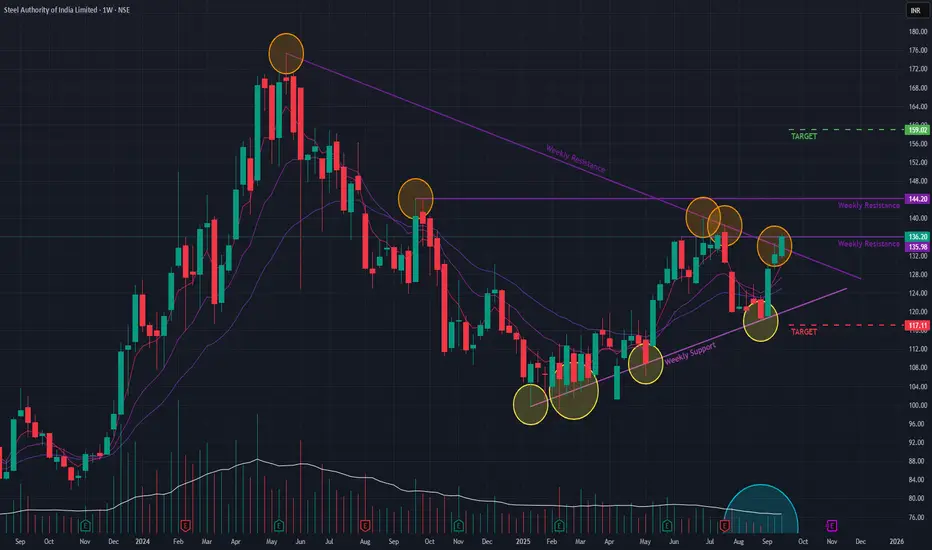
SAIL (Weekly) - Can it SAIL past the resistances ?SAIL is showing signs of a potential turnaround after a prolonged downtrend that began in May 2024. This week, the stock executed a significant breakout from a long-term angular resistance trendline , a move accompanied by a healthy increase in volume and a price surge of +2.98% .
This bullish development follows a period of consolidation that began after the downtrend reversed in January 2025. The stock is now testing a key short-term resistance level.
Bullish Indicators to Note 👍
The positive outlook is supported by the following technical signals:
- Breakout Confirmation: The move through the long-term trendline was validated by a notable increase in trading volume , indicating strong buyer participation.
- Momentum: Short-term Exponential Moving Averages (EMAs) are in a positive crossover , signaling building upward momentum.
Immediate Hurdles Ahead 🚧
Despite the positive momentum, a sustained rally depends on the stock's ability to overcome two significant upcoming resistance levels . The price action in the upcoming week will be crucial to watch for confirmation of the breakout's strength.
Future Outlook and Key Levels
- Bullish Case 📈: If the stock successfully breaks through the immediate resistances and the upward momentum continues, the next potential price target is ₹159 .
- Bearish Case 📉: However, if the stock fails to clear these hurdles and momentum wanes, a pullback towards the support level of ₹117 is possible.
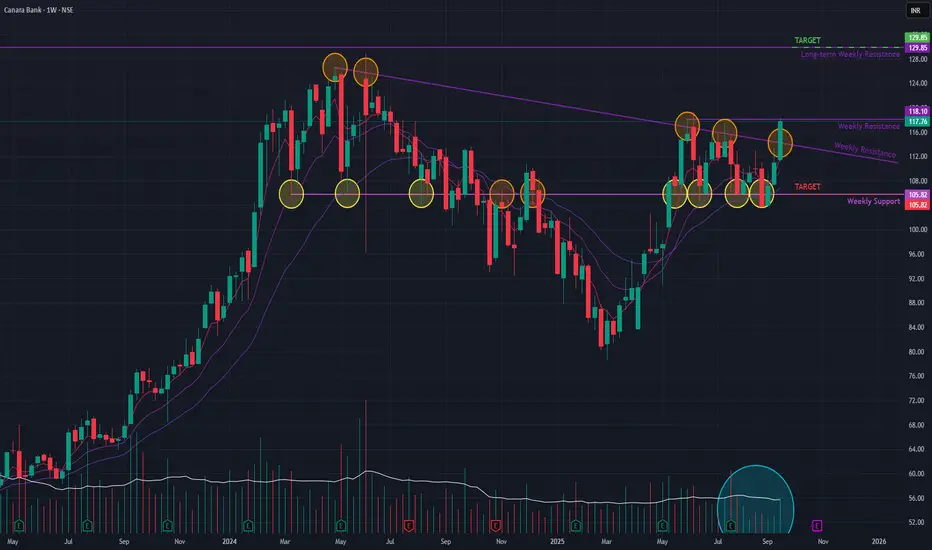
Canara Bank (Weekly) - Will it BreakOut of sideways trend??Canara Bank has demonstrated a significant bullish development this week, breaking out of a key angular resistance trendline . This move was validated by a strong increase in trading volume and a notable +6.13% price surge , signaling renewed buyer interest.
This breakout occurs after a period of sideways consolidation that has been in place since May 2025. This consolidation phase followed a corrective downtrend that lasted from June 2024 to March 2025, which itself came after a multi-year rally that began in October 2020.
Bullish Indicators Supporting the Move 👍
Several technical factors support a positive outlook:
- Volume Confirmation: The breakout was accompanied by a healthy surge in trading volume , indicating strong conviction behind the move.
- Momentum: Short-term Exponential Moving Averages (EMAs) have entered a positive crossover , a classic signal of building upward momentum.
The Immediate Hurdle Ahead 🚧
Despite the positive signs, the stock is currently trading just below a short-term resistance level . A decisive move above this immediate barrier is required to confirm the continuation of the uptrend.
Future Outlook and Key Levels
The price action in the upcoming week will be crucial. Two primary scenarios exist:
- Bullish Case 📈: If the stock successfully breaks and holds above the current short-term resistance, the path could be clear for a rally towards the next major resistance zone at ₹129 .
- Bearish Case 📉: If the upward momentum fails and the stock is rejected at this resistance, it could pull back towards the support level of ₹105 .
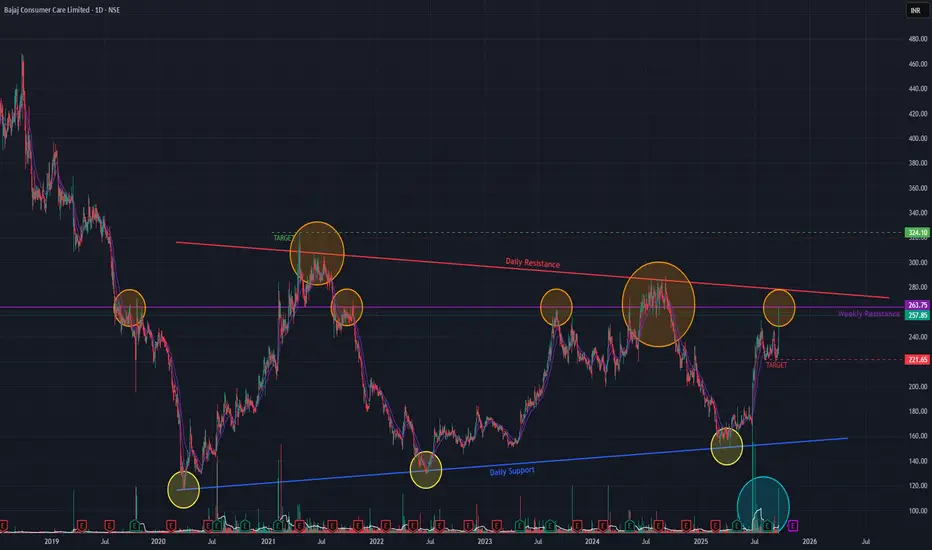
Bajaj Consumer (Daily) - Potential BreakoutBajaj Consumer Care is at a critical juncture following a prolonged downtrend from its January 2018 all-time high and a subsequent sideways consolidation period since March 2020. The stock recently demonstrated significant buying interest with an 8.59% surge on a high-volume spike.
Bullish Indicators 👍
Several technical signals support a positive outlook:
- Momentum: Short-term Exponential Moving Averages (EMAs) are in a positive crossover state, indicating strong upward momentum.
- Volume: Trading volume has been consistently above average for several months, suggesting sustained accumulation by buyers.
- Long-Term Trend: The weekly timeframe now shows a Simple Moving Average (SMA) Golden Crossover, reinforcing the potential for a long-term trend reversal.
Key Resistance Levels 🚧
Despite the bullish signals, the stock faces two significant hurdles:
1. A major horizontal resistance line that has been in place since January 2013.
2. A more recent descending resistance trendline formed since April 2021.
Future Outlook and Scenarios
- Bullish Case 📈: A decisive breakout above both the horizontal and angular resistance levels would be a strong confirmation of bullish momentum. This could propel the stock towards a potential price target of ₹324.
- Bearish Case 📉: If the stock fails to sustain its upward momentum and break these key resistance levels, it may retrace back towards the ₹221 support level.
Keep monitoring !!
Supreme Ind (Daily) - Approaching Critical Res ConfluenceAfter a significant uptrend that concluded in June 2024, Supreme Industries entered a corrective downtrend lasting until April 2025. Since then, the stock has shown signs of a bullish reversal by establishing a pattern of higher lows , indicating that buyers are stepping in at progressively higher prices.
The Resistance Zone
Currently, the stock is approaching a major technical hurdle: a confluence of resistance . This is created by the intersection of a long-term downward-sloping (angular) trendline and a key horizontal resistance level. Multiple recent attempts to breach this zone, though unsuccessful, signal persistent buying interest and a buildup of pressure.
Indicator Analysis
Positive Signs: Trading volume has been healthy in recent sessions. Furthermore, the short-term Exponential Moving Averages (EMAs) have registered a bullish crossover , confirming positive short-term momentum.
Cautionary Signs: A long-term Golden Crossover (50-day SMA crossing above the 200-day SMA) has not yet occurred. This more significant signal would be needed to confirm a durable, long-term trend reversal.
Future Outlook & Key Levels
The future direction depends on the stock's ability to resolve the battle at the current resistance confluence.
Bullish Scenario: A decisive breakout and close above both trendlines would be a strong bullish signal. If this occurs, the stock could rally towards the next target of ₹5,060.
Bearish Scenario: If the resistance holds and the upward momentum fades, the stock could pull back to test its support level near ₹4,251.
Keep monitoring !!

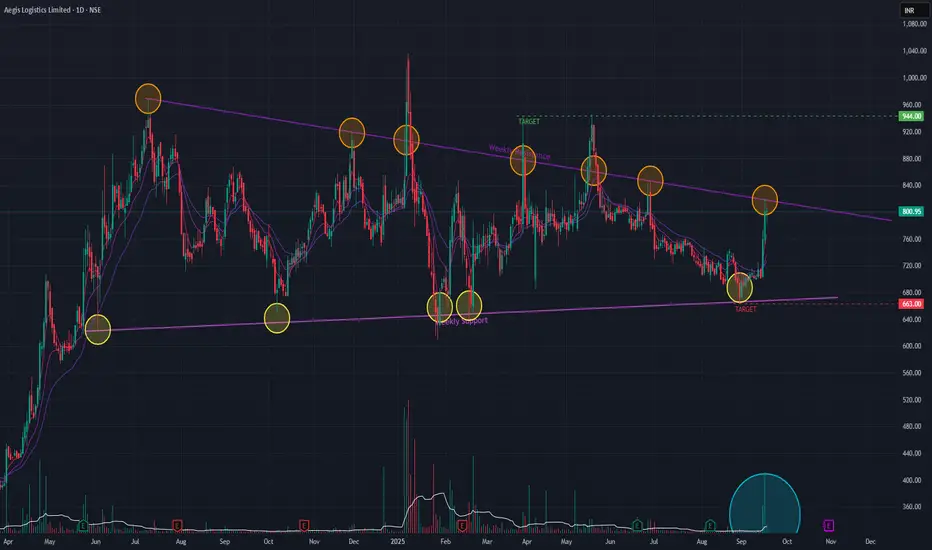
Aegis Logistics (Daily Timeframe) - Potential Breakout ??Following a strong uptrend that peaked in July 2024, Aegis Logistics entered a multi-month consolidation phase. Despite marking a new all-time high in January 2025, the stock lacked sustained upward momentum and has since formed a clear Symmetrical Triangle pattern . This pattern typically acts as a continuation signal, suggesting the prior uptrend is likely to resume.
Recent Bullish Momentum
This week, the stock has shown a significant surge in buying interest, rallying +14.05% on the back of very high trading volume. This powerful move towards the triangle's upper boundary indicates strengthening bullish sentiment and a potential impending breakout.
Indicator Analysis
On the daily chart, short-term Exponential Moving Averages (EMAs) have already registered a bullish crossover , confirming the immediate positive momentum. While the weekly EMAs are yet to confirm a similar crossover, they are aligning positively, suggesting a longer-term bullish signal may be forming.
Future Outlook & Key Levels
The direction of the next major move hinges on the resolution of this triangle pattern.
Bullish Scenario: A decisive breakout and close above the triangle's upper trendline would confirm the pattern's continuation. The primary upside target in this case is ₹944 .
Bearish Scenario: If the stock fails to break out and instead breaches the lower trendline of the triangle, the bullish thesis would be invalidated. The key support level to watch on the downside would be ₹663 .
Watchout for the Price-action !!
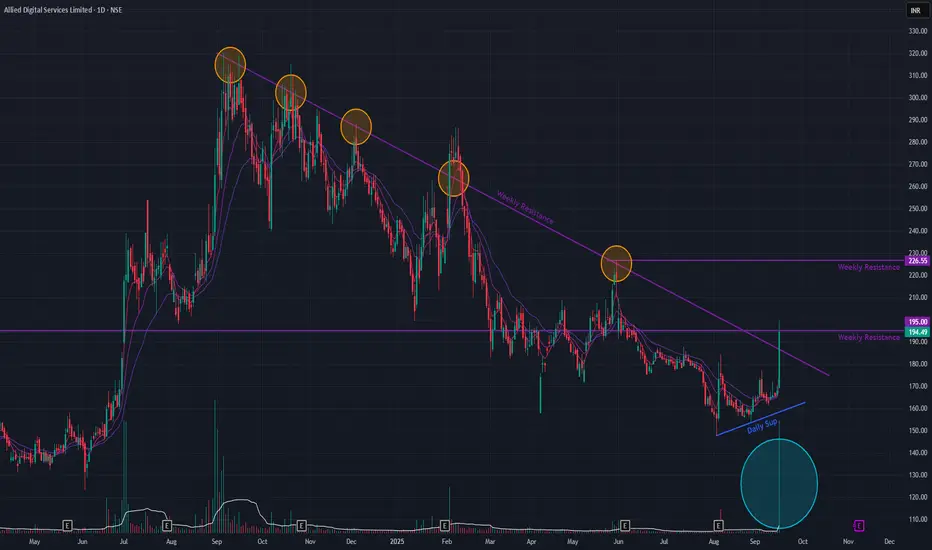
ADSL (Daily Timeframe) - Potential BreakOut / Reversal ?After a sustained downtrend since September 2024, ADSL is exhibiting significant bullish activity that requires careful monitoring.
Today's Action: The stock gained +15.73% on massive volume, challenging its primary descending trendline.
Bullish Indicators: Short-term Exponential Moving Averages (EMAs) have formed a positive crossover, signaling a potential shift in momentum.
Confirmation Required:
Historical Precedent: Similar breakout attempts have failed in the past, raising the possibility of a "false breakout."
Key Levels: To confirm the reversal, ADSL must hold above the trendline (a successful re-test) and decisively break the horizontal resistance established in January 2024.
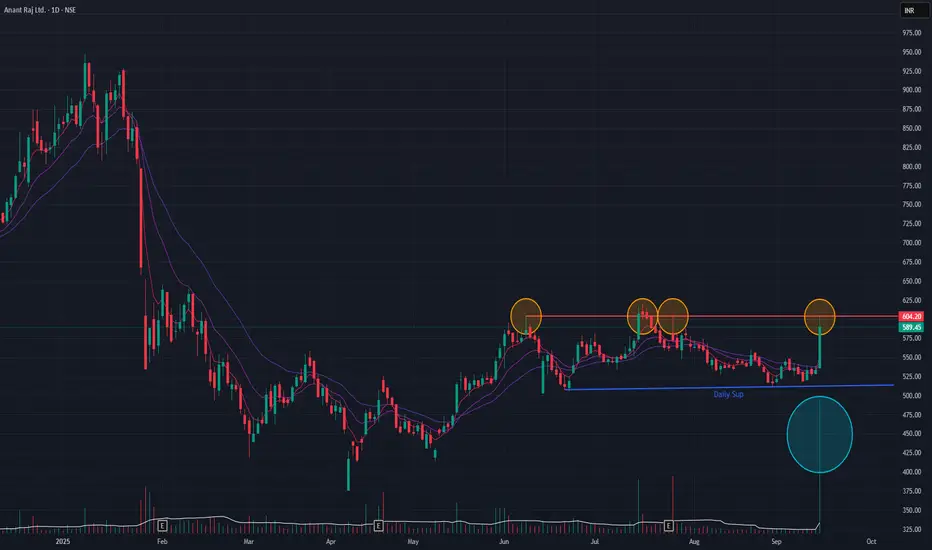
Anant Raj (Daily Timeframe) - Potential BreakOut candidate ??Following a downtrend that began in January 2025, Anant Raj has been in a sideways consolidation phase since May 2025. After several failed breakout attempts from this range, the stock demonstrated significant buying interest today, surging +10.53% on substantial volume.
While this move is positive, a cautious approach is recommended as the short-term Exponential Moving Averages (EMAs) have not yet registered a bullish positive crossover. The price action in the coming sessions will be critical for confirmation.
A sustained breakout above the consolidation channel could pave the way for further upside, with a potential short-term target of ₹667.
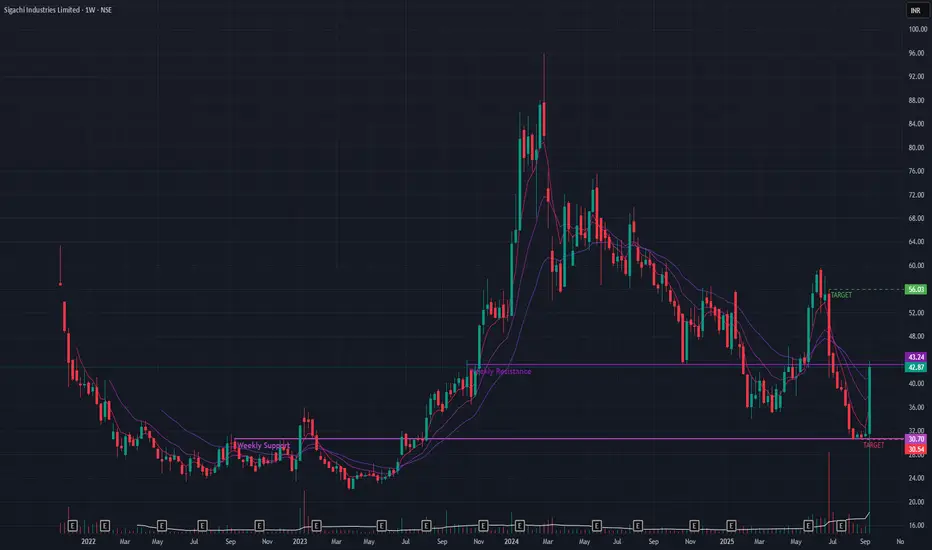
Sigachi Ind (Weekly Timeframe) - Is this the trend reversal?After a period of decline following its February 2024 peak, Sigachi Industries has shown a dramatic burst of momentum. However, the stock has now reached a critical juncture, and confirmation is required to suggest a sustainable trend reversal.
## Recent Price Action
A massive +36.27% rally last week, backed by exceptionally high volume , has put the stock back on the radar. This surge has pushed the price directly against a significant long-term resistance trendline . A breakout above this level would be a major technical victory for the bulls.
## Cautionary Signals to Consider
Despite the powerful rally, several indicators suggest a "wait-and-see" approach:
Trend Confirmation: The stock has not yet formed a higher low , a key technical signal required to confirm a reversal from a downtrend to an uptrend.
EMA Posture: The short-term Exponential Moving Averages (EMAs) have not yet achieved a Positive Crossover (PCO) . This indicates that the recent surge, while strong, has not yet been sustained long enough to reverse the short-term trend momentum.
## Key Levels and Outlook
The stock is at a clear decision point.
Bullish Scenario: A decisive breakout above the current resistance trendline, again on high volume , would be a strong bullish signal. If this occurs, the next potential upside target is the ₹56 level.
Bearish Scenario: If the stock fails to breach this resistance and the momentum fades, it could fall back to test support near the ₹30 level.
Wait for further price-action !!
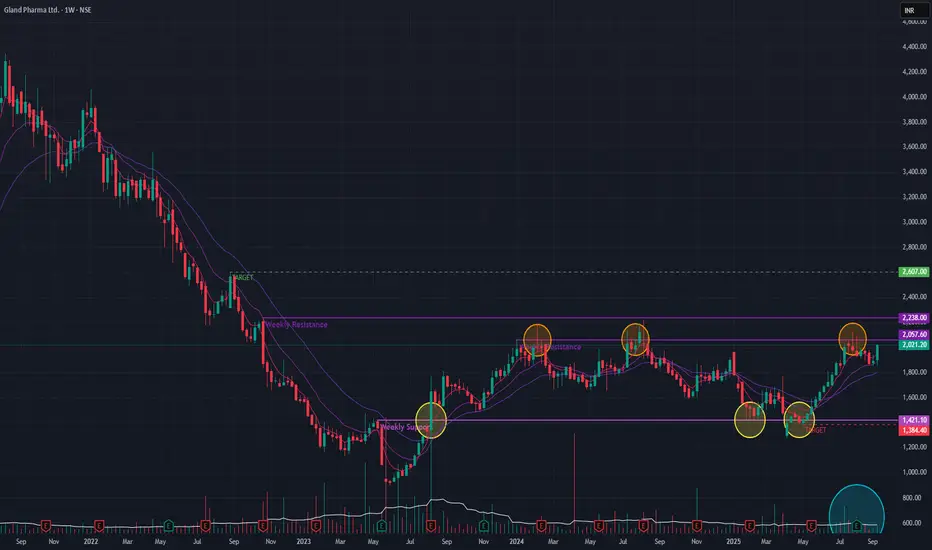
Gland Pharma (Weekly Timeframe) - Breakout of Sideways trend ?After a prolonged downtrend from its all-time high in August 2021, Gland Pharma has been trading in a sideways consolidation range since August 2023. Recent price action suggests that the stock is building momentum for a potential breakout, signaling a possible end to its bearish phase.
## Bullish Developments 📈
Recent Momentum: The stock showed significant buying interest last week, surging +6.82% accompanied by a decent spike in trading volume .
Technical Posture: The short-term Exponential Moving Averages (EMAs) have entered a Positive Crossover (PCO) state , a classic bullish signal indicating that near-term momentum is shifting upwards.
Breakout Potential: This renewed strength positions the stock to challenge its long-term horizontal resistance trendline. A decisive break above this level would confirm a bullish trend reversal.
## Key Price Levels to Watch
Immediate Resistance: The first major hurdle is at the ₹2,238 level. A sustained move above this is required to confirm the breakout.
Upside Target: If the resistance at ₹2,238 is breached, the next potential target for the stock is ₹2,607 .
Downside Support: If the upward momentum fails to continue, the stock could find support near the ₹1,384 level.
Price-action is key !!
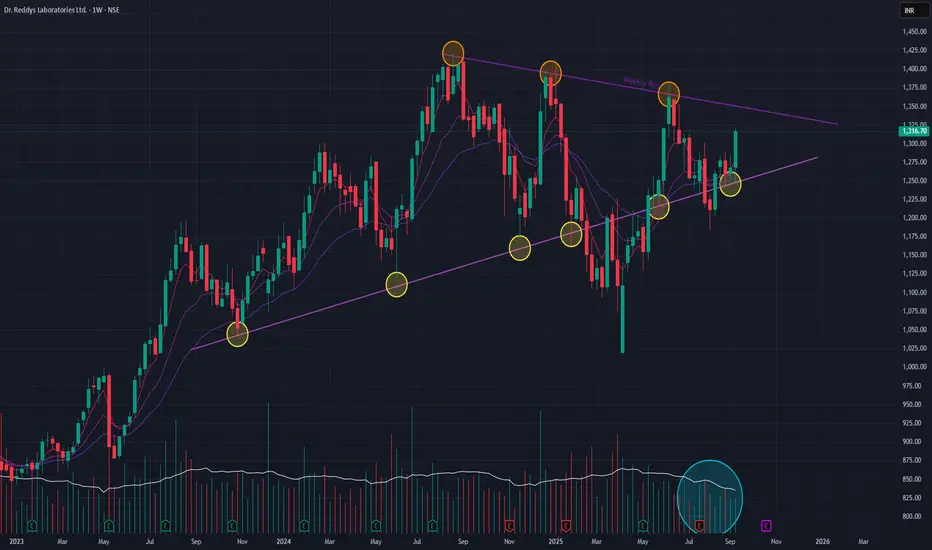
Dr. Reddy's (Weekly Timeframe) - Potential BreakOut?Dr. Reddy's Laboratories is currently in a phase of strategic consolidation. After a remarkable 93.63% uptrend that began in March 2022, the stock has settled into a well-defined triangle formation since August 2024. This pattern suggests a temporary equilibrium between buyers and sellers as the market digests previous gains.
The technical underpinnings remain constructive. The Positive Crossover (PCO) in the short-term EMAs provides a bullish undercurrent, and the resilience of key support levels indicates a solid foundation. The primary scenario we are monitoring is for a bullish continuation.
The key catalyst for the next leg up will be a volume-supported breakout above the triangle's resistance. Such a move would signal the end of the consolidation phase and could propel the stock towards retesting its All-Time High (ATH) . Investors should, however, remain watchful of the trading volume, as it will be the ultimate arbiter of the breakout's validity.
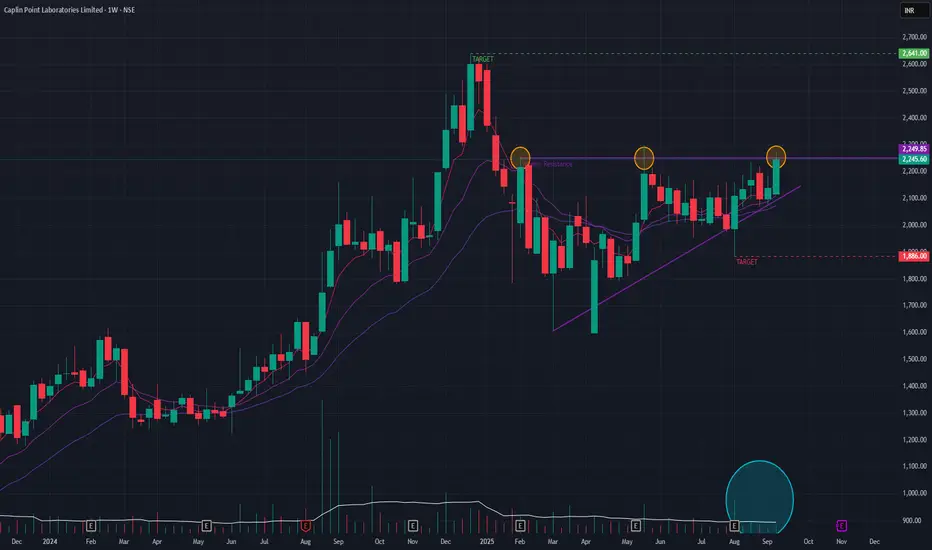
Caplin Point (Weekly Timeframe) - Will the uptrend continue ?After a brief downtrend, Caplin Point has formed a classic triangle pattern , which often acts as a continuation signal for the preceding long-term uptrend. Technical indicators are favorable, with the short-term EMAs arranged in a bullish formation that signals strong underlying momentum.
The one element of caution is that recent trading volumes have been average. Therefore, a breakout from the triangle must be accompanied by a significant increase in volume to validate buyer conviction. If such a breakout occurs, the next logical objective would be the all-time high, which also serves as a key resistance zone at ₹2640 . Conversely, if the pattern fails and momentum wanes, a pullback to the ₹1886 support level is possible.
Watchout for the price-action !!