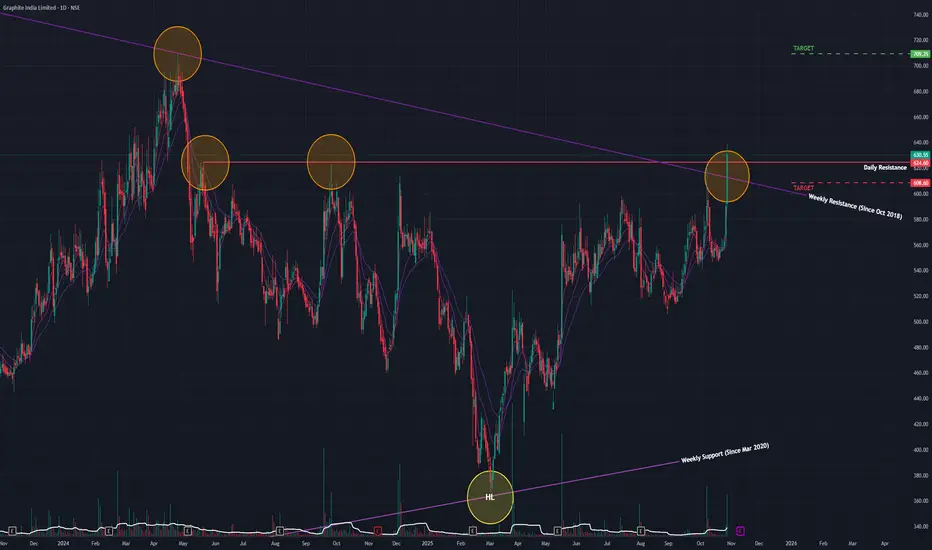
Graphite (D): Mighty Dual-Resistance Breakout Signals Major RevAfter being in a multi-year downtrend since its All-Time High (ATH) in August 2018, Graphite India (GRAPHITE) is showing compelling signs of a major trend reversal. Today's powerful price action has broken through two critical resistance levels, suggesting a new uptrend may be underway.
The Long-Term Bottoming Process
While the stock peaked in 2018, a very long-term bottoming process has been in place. Since April 2020, the stock has been forming a pattern of Higher Lows (clearly visible on the Monthly chart), indicating a gradual shift from supply to demand over the years. Although there was a more recent downtrend from May 2024, that appears to have reversed starting in March 2025.
Today's Decisive Dual Breakout
Today's session (Wednesday, October 29, 2025) was technically very significant:
- Strong Price Surge: The stock rallied by +6.82% .
- Massive Volume: The move was supported by a huge volume of 8.6 million shares , indicating strong buyer conviction.
- Dual Resistance Breach: In a powerful display, the stock broke out and closed above two key resistance levels simultaneously :
1. A long-term angular resistance trendline in place since October 2018.
2. A short-term horizontal resistance trendline formed since May 2024.
Breaking through a confluence of long-term and short-term resistance on high volume is a potent bullish signal.
Broad-Based Technical Strength
This breakout is strongly supported by a clear alignment of momentum indicators across all major timeframes (Monthly, Weekly, and Daily):
- Short-Term EMAs: All three timeframes are in a bullish Positive Crossover (PCO) state.
- RSI (Relative Strength Index): The RSI is also in a rising trend on all three timeframes.
Outlook and Key Levels to Watch
With this dual breakout, the technical landscape has shifted significantly in favor of the bulls.
- Bullish Target: If the stock can sustain this momentum, the next logical area of resistance and potential price target is the ₹709 level. The ideal confirmation, would be a successful re-test of the broken resistance zone followed by a bounce.
- Critical Support: If this breakout proves to be a "fakeout" and the price falls back below the broken resistance, the key support level to watch is ₹608 . A close below this would negate the bullish signal.
In conclusion, today's action represents a potentially major turning point for Graphite India. Confirmation via a successful retest would provide the highest confidence that a new long-term uptrend has begun.
Potentialreversal
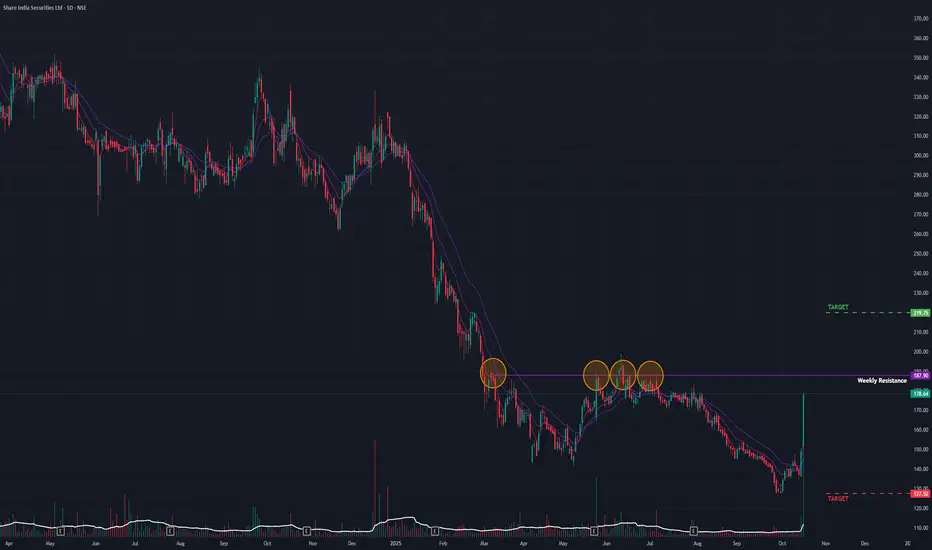
SHAREIND (D) - Explodes 31%, Now Challenges Major ResistanceShare India Securities has shown an incredible burst of strength over the past two sessions, signaling a potential trend reversal. However, this explosive rally has now run directly into a major historical resistance level, setting up a critical test for the bulls.
The Context: A Powerful Reversal Attempt
After a prolonged downtrend from its All-Time High in February 2024, the stock recently began showing signs of life by forming a series of Higher Lows . This subtle shift culminated in an explosive rally over the past two sessions:
- The stock has surged by a massive 31% in just two days.
- Today's session (Thursday, October 16, 2025) saw a gap-up opening and a +19.96% gain on huge volume of 10.5 million shares.
This powerful move has brought the price right up against a key horizontal resistance trendline — a level that has successfully rejected several rally attempts in the past, making it a significant hurdle.
A Nuanced Look at the Indicators
The technical indicators paint a picture of a new, but not yet fully confirmed, uptrend:
- Positives: The Relative Strength Index (RSI) is now rising across the Monthly, Weekly, and Daily timeframes, indicating a broad-based improvement in momentum. The short-term EMAs have also turned bullish on the Daily chart.
- Points of Caution: The short-term EMAs on the longer-term Weekly and Monthly charts have not yet registered a bullish crossover . This suggests that while the short-term trend has reversed, the long-term trend has not yet fully confirmed the move.
Outlook and Key Triggers to Watch
The immediate future of the stock depends entirely on the outcome of the battle at this key resistance.
- Bullish Breakout Scenario: A decisive close above the horizontal resistance on high volume would be a major victory for the bulls. It would confirm the trend reversal and could propel the stock towards the ₹220 level.
- Potential Rejection Scenario: If the stock is unable to breach this strong resistance, the rally may stall, leading to a pullback. In this case, the stock could retrace to the recent support level around ₹125 .
In conclusion, Share India is at a "prove it" moment. While the recent surge is incredibly powerful, it must now overcome a historically significant resistance level to prove that this is the start of a sustainable new uptrend and not just a sharp bear-market rally.
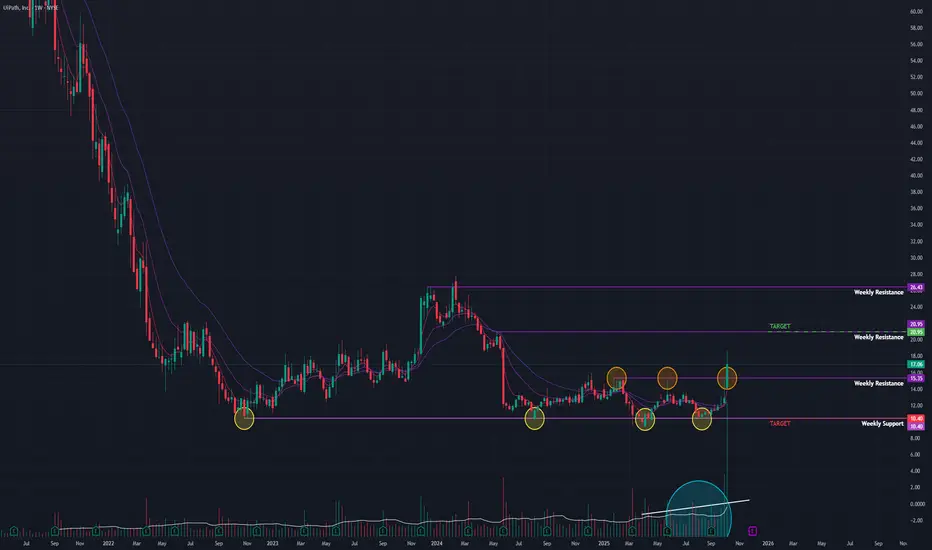
UI Path (W) - A Massive 32% Surge Signals Major Trend ReversalAfter being locked in a severe bear market since its 2021 IPO, UI Path (PATH) has just delivered its most significant bullish signal to date. An explosive, high-volume breakout this past week suggests its multi-year basing phase may be complete and a new major uptrend is beginning.
The Long-Term Bottoming Process
Following its IPO in April 2021, UI Path entered a protracted downtrend. The stock finally stopped making new lows in October 2022, transitioning into a multi-year sideways consolidation range. This long basing period is often where accumulation occurs, setting the stage for a potential trend reversal.
This Week's Explosive Breakout
The week ending Friday, October 10, 2025, marked a dramatic shift in character for the stock:
- Monumental Weekly Gain: The stock skyrocketed by an incredible +32.21% .
- Enormous Volume: This move was validated by a massive trading volume of 366.81 million shares , indicating powerful institutional buying.
- Major Resistance Breach: The surge shattered a key resistance level that had capped prices for the duration of its multi-year consolidation.
This powerful price action has flipped the short-term Exponential Moving Averages (EMAs) into a bullish positive crossover. Concurrently, the Relative Strength Index (RSI) is now strongly rising on both the Monthly and Weekly charts, confirming a significant shift in long-term momentum.
Outlook and Key Levels
The breakout from a multi-year base is a technically powerful event that could define the stock's direction for months to come.
- Bullish Target: If this newfound momentum is sustained, the next major area of resistance and potential target is the $21 level.
- Critical Support: In case of a pullback, the breakout zone around the $10 level is now the most critical new support. A failure to hold this level would invalidate the bullish signal.
This week's action represents a significant technical turning point for UI Path. The key now is to watch for follow-through buying or a successful retest of the $15.35 breakout level to confirm the start of a new, sustained uptrend.
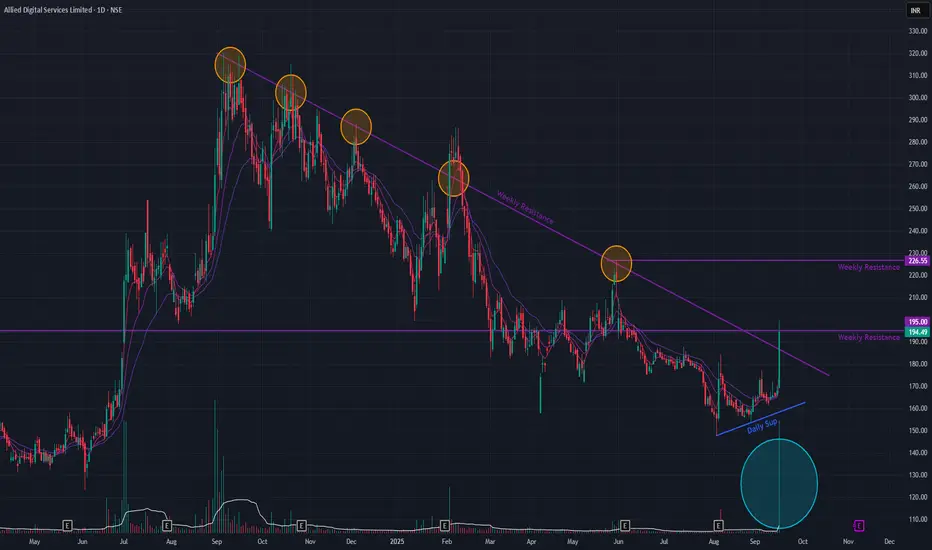
ADSL (Daily Timeframe) - Potential BreakOut / Reversal ?After a sustained downtrend since September 2024, ADSL is exhibiting significant bullish activity that requires careful monitoring.
Today's Action: The stock gained +15.73% on massive volume, challenging its primary descending trendline.
Bullish Indicators: Short-term Exponential Moving Averages (EMAs) have formed a positive crossover, signaling a potential shift in momentum.
Confirmation Required:
Historical Precedent: Similar breakout attempts have failed in the past, raising the possibility of a "false breakout."
Key Levels: To confirm the reversal, ADSL must hold above the trendline (a successful re-test) and decisively break the horizontal resistance established in January 2024.