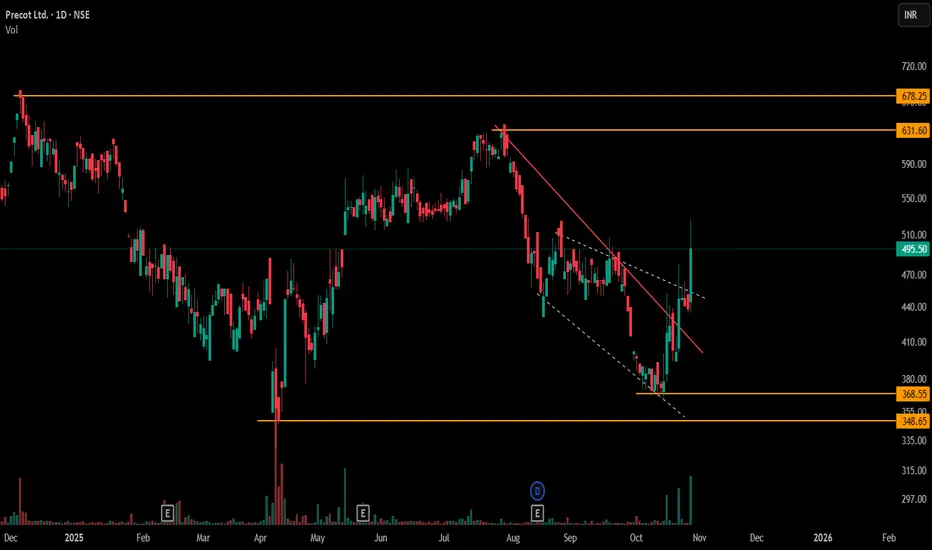
Objective Observation in Sideways Markets1) Sideways market action is clearly depicted here, with price oscillating between well-defined resistance and support bands (marked by orange horizontal lines). The presence of both multiple resistance and support levels typifies a range-bound environment, where relying solely on single breakout/CT patterns may lead to inconsistent observations.
2) To supplement this, a solid red counter-trendline has been drawn across recent swing highs/lows, offering a direct visual of shifting momentum pockets. In sideways phases, such counter-trendlines might limit or expand their analytical usefulness, depending on whether price respects or ignores these boundaries within the broader “box”.
3) Further, layering a secondary dotted formation—a small broadening pattern—provides additional observation reference points. Using both counter-trend and minor broadening structures together helps in mapping probable price responses at key junctions, especially when horizontal supports/resistances cluster.
4) By objectively tracking these intersections and reactions—rather than expecting a directional resolution—traders gain more nuanced insight for potential tactical responses on future moves. No forecasts here; just systematic, multi-pattern observation.
PRECOT
BOTTOM TRIANGLE - PRECOT DAILY CHART ANALYSISPRECOT DAILY CHART ANALYSIS - Showing signs of reversal as it has broken upward after a period of uncertainty or consolidation.
Target: Rs. 198
Self explanatory daily chart analysis for educational purpose
Technicals - Bottom Triangle Pattern / Bottom Wedge
This is just a view by an analyst, please invest at your own risk.
Follow me for more!

PRECOTPRECOT (W):- A falling wedge is formed by two converging trend lines when the stock's prices have been falling for a certain period. Before the line converges the buyers come into the market and as the result, the decline in prices begins to lose its momentum. This results in the breaking of the prices from the upper trend line.

PRECOT educational idea- Precot we expect the stock May go for given target levels to inspire us,Please like the idea If you agree with the analysis.

Precot Meridian LimitedWedge pattern in Precot Meridian Limited. wait for the breakout with high volume.

PRECOT LONG TRADEPRECOT LONG
CONTEXT:
1. STRONG BUYING POWER
2. ALL TIME HIGH
3. CLEAN CONSOLIDATION
4. GOOD FUNDAMENTALS
Precot has an operating revenue of Rs. 665.14 Cr. on a trailing 12-month basis. An annual revenue de-growth of -8% needs improvement, Pre-tax margin of 5% is okay, ROE of 9% is fair but needs improvement. The company has a reasonable debt to equity of 31%, which signals a healthy balance sheet.

PRECOT Swing TradeCan buy above 132.5..Target is on the chart. Do your own analysis before investing.

