BTC Ichimoku 4H: Bears in Top Gear as Every Bull Reclaim FailsBTC Ichimoku 4H: Bears in Top Gear as Every Bull Reclaim Fails
This is one of those phases where Ichimoku structure becomes crystal clear and easy to read.
The Weekly HTF has broken down from the Kumo , establishing a clear bearish higher-timeframe bias.
Within that context, the 4H LTF has printed a textbook hierarchy of breakdowns — price first lost the Kumo, followed by failed reclaim attempts at the Kijun, and most recently at the Tenkan.
This Kumo → Kijun → Tenkan sequence highlights sustained bearish control and confirms that upside moves remain corrective rather than trend-changing .
As long as the 4H fails to close above 83,140 , structure favors downside continuation toward the lower reference levels:
L1: 72,480
L2: 71,500
L3: 70,500
L4: 69,500
Priceactionanalysis

When Broader Market Held the Gap… Why Is NiftyIT the Outlier?When Broader Market Held the Gap… Why Is NiftyIT the Outlier?
Headlines point to explanations like AI bubble fears, US tech weakness, or currency moves.
But are these the real drivers — or just narratives assigned after the move ?
Price leads. News follows.
The weekly price structure appears to have been signaling this divergence well in advance, as price continued to respect higher-timeframe supply while the broader market held firm.
At the same time, the daily Ichimoku structure reflects this conflict . It repeatedly toggled between kumo breakout and kumo breakdown highlighting unresolved higher-timeframe pressure

Axis Bank | Gann Square of 9 Intraday Observation | 18 March 202Disclaimer:
This analysis is for educational purposes only. I am not a SEBI-registered advisor. This is not financial advice.
Symbol: AXISBANK (NSE)
Date Observed: 18 March 2024
Time Frame: 15-Minute Chart
Method Used: Gann Square of 9 (Price–Time Study)
This post documents a historical intraday market observation using the Gann Square of 9, focusing on how price movement capacity and time alignment can highlight potential intraday reaction zones.
📊 Initial Market Structure
Axis Bank displayed upward momentum from the opening 15-minute candle.
The low of the first 15-minute candle (~1043) was treated as the 0-degree reference level.
This reference point marks the start of the intraday price cycle and is used for further Square of 9 calculations.
Correct identification of the 0-degree level is a key requirement for consistent Square of 9 analysis.
🔢 Square of 9 Level Mapping
Using Square of 9 price-degree relationships, the following levels were observed:
0 Degree: ~1043
45 Degree (Observed Normal Capacity): ~1057
The 45-degree level often reflects the normal intraday price expansion range under regular market conditions.
⏱️ Price & Time Interaction (Observed Behavior)
Price interacted with the 45-degree level early in the session (around the second 15-minute candle).
Completion of the normal price capacity well before the later part of the trading day has historically shown temporary price pressure.
After reaching this zone, the market displayed rejection behavior followed by short-term downside expansion.
This observation aligns with a commonly studied Gann principle:
Early completion of expected price capacity may increase the probability of a market reaction.
📘 Educational Takeaways
Gann Square of 9 helps define logical intraday price limits
Normal (45-degree) reactions occur more frequently than exceptional cases
Time context adds important confirmation to price levels
Minor price deviations around calculated levels are part of normal market behavior
The method supports rule-based observation, not prediction
📌 Shared strictly for educational and historical chart-study purposes.
#AxisBank #GannSquareOf9 #WDGann #IntradayAnalysis #MarketEducation #PriceTime #TechnicalAnalysis

Sandhar Technologies cmp 534.05 by Weekly Chart view since listeSandhar Technologies cmp 534.05 by Weekly Chart view since listed
- Support Zone 440 to 480 Price Band
- Resistance Zone 560 to 600 Price Band
- Support Zone acting ground for probable reversal

BEL : High-Quality Setup Despite Market Weakness📊 Technical Catalysts :
This is a perfect VCP structure with a clean breakout supported by strong volume, clearly indicating institutional interest. The stop loss is well placed below the basing formation, keeping risk structurally defined. The 20 EMA crossing above the 50 EMA further confirms a bullish trend shift.
EPS and Sales are continuously increasing for the past few quarter. The only dip was in June and this is not a stock specific event but a market wide scenario.
🏭 Fundamental Catalysts :
Good Results ; EPS and Sales are continuously increasing for the past few quarter. The only dip was in June and this is not a stock specific event but a market wide scenario.
Q3 Beat: Net profit grew 20.4% YoY (₹1,590 Cr), comfortably beating street estimates. Revenue execution is at an all-time high.
The EU FTA Factor: The "Mother of All Deals" signed on Jan 27 opens up a $750B market for Indian defense electronics. BEL is the primary beneficiary as it scales up exports to European nations looking to de-risk from China/Russia.
Budget 2026 Speculation: With the Union Budget on Feb 1, the market is front-running a likely increase in defense capital outlay.
Even though the broader market is showing signs of weakness, the confluence of strong technical structure, volume-backed breakout, moving-average crossover, and improving fundamentals provides enough confidence to take this trade, while still maintaining disciplined risk management with a standard 1% risk per trade.
📢📢📢
If my perspective changes or if I gather additional fundamental data that influences my views, I will provide updates accordingly.
Thank you for following along with this journey, and I remain committed to sharing insights and updates as my trading strategy evolves. As always, please feel free to reach out with any questions or comments.
Other posts related to this particular position and scrip, if any, will be attached underneath. Do check those out too.
Disclaimer : The analysis shared here is for informational purposes only and should not be considered as financial advice. Trading in all markets carries inherent risks, and past performance is not indicative of future results. It’s essential to conduct your own research and assess your risk tolerance before making any investment decisions. The views expressed in this analysis are solely mine. It’s important to note that I am not a SEBI registered analyst, so the analysis provided does not constitute formal investment advice under SEBI regulations.

Axis Bank | Gann Square of 9 Intraday Study (Normal Case)Disclaimer:
This analysis is for educational purposes only. I am not a SEBI-registered advisor. This is not financial advice.
Symbol: AXISBANK (NSE)
Date Observed: 12 November 2024
Time Frame: 15-Minute Chart
This post presents a historical intraday observation using the Gann Square of 9, focusing on how normal price movement capacity and time alignment can highlight potential reaction zones.
📊 Market Structure at the Open
Axis Bank displayed upward strength from the first 15-minute candle.
The low of the opening candle (~1166) was used as the 0-degree reference level, following Square of 9 methodology.
This level acts as the base point for mapping the day’s upward price vibration.
Correct identification of the 0-degree reference is essential for consistent Square of 9 studies.
🔢 Square of 9 Level Mapping
Based on Square of 9 calculations:
0 Degree: ~1166
45 Degree (Observed Normal Capacity): ~1183
In intraday analysis, the 45-degree level often represents the stock’s normal price expansion range under typical market conditions.
⏱️ Price & Time Interaction (Observed Behavior)
Price reached the 45-degree level early in the session (around the second 15-minute candle).
Completion of the normal price capacity well before the later part of the trading day has historically shown temporary price pressure.
After interacting with this zone, the market displayed rejection behavior followed by short-term downside expansion.
This aligns with a commonly observed Gann concept:
Early completion of expected price capacity may increase the probability of a reaction.
📘 Educational Takeaways
Gann Square of 9 helps define logical intraday price limits
Normal (45-degree) reactions occur more frequently than exceptional cases
Combining price structure with time context improves market clarity
Small deviations around calculated levels are part of normal market behavior
This approach supports rule-based observation, not prediction
📌 Shared strictly for educational and historical chart-study purposes.

APLAPOLLO : VCP Breakout with Fundamental ConfirmationInitiated a long position in APLAPOLLO following a high-conviction breakout from a multi-month Volatility Contraction Pattern (VCP). Although the price is currently extended from the 20- and 50-day EMAs, the structural strength of the breakout suggests the beginning of a fresh leg in the uptrend.
From a fundamentals perspective, the company continues to deliver strong and consistent sales and EPS growth, reinforcing its positioning as a proxy for India’s infrastructure-led growth cycle.
To manage the risk associated with being extended from the moving averages, I’ve opted for a wider stop-loss, allowing room for short-term volatility or a potential retest of the breakout zone. This approach gives the trade sufficient breathing space while the moving averages gradually catch up to price.
From a broader market standpoint, the recent ~10% correction in ITC following the government’s cigarette tax announcement has created temporary index-level pressure on the Nifty 50. However, this has triggered a clear sectoral rotation rather than broad-based weakness. Capital is rotating out of regulatory-impacted FMCG names and into high-growth industrial leaders like APL Apollo.
Given its insulation from regulatory shocks and its direct linkage to domestic capex growth, APL Apollo is exhibiting strong relative strength even as the broader market remains range-bound.
Initiated the position with 1% risk.
📢📢📢
If my perspective changes or if I gather additional fundamental data that influences my views, I will provide updates accordingly.
Thank you for following along with this journey, and I remain committed to sharing insights and updates as my trading strategy evolves. As always, please feel free to reach out with any questions or comments.
Other posts related to this particular position and scrip, if any, will be attached underneath. Do check those out too.
Disclaimer : The analysis shared here is for informational purposes only and should not be considered as financial advice. Trading in all markets carries inherent risks, and past performance is not indicative of future results. It’s essential to conduct your own research and assess your risk tolerance before making any investment decisions. The views expressed in this analysis are solely mine. It’s important to note that I am not a SEBI registered analyst, so the analysis provided does not constitute formal investment advice under SEBI regulations.

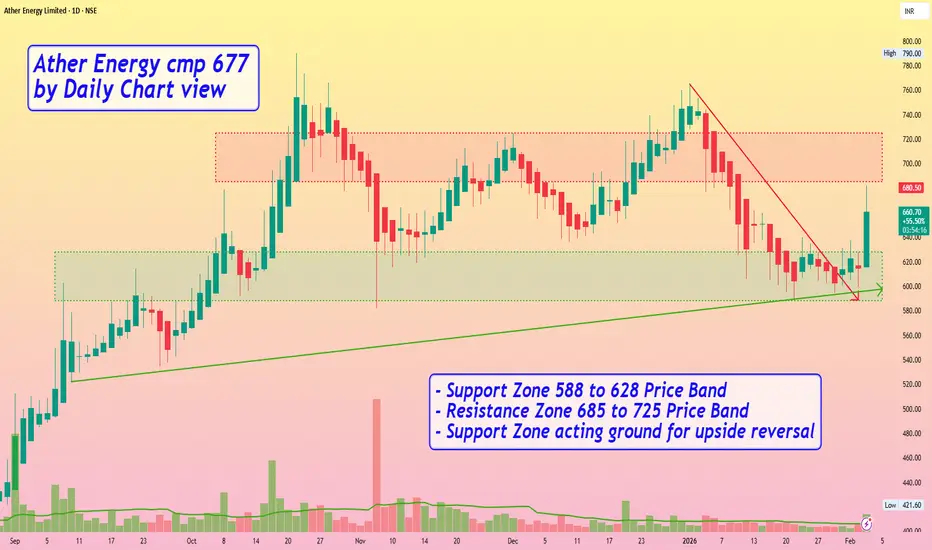
Ather Energy cmp 677 by Daily Chart viewAther Energy cmp 677 by Daily Chart view
- Support Zone 588 to 628 Price Band
- Resistance Zone 685 to 725 Price Band
- Support Zone acting ground for upside reversal
ETHUSD at a crucial support Forming Head and shoulder pattern✅ Pattern Forming: Inverse Head & Shoulders (Early Stage)
Look closely:
Left Shoulder → ~2300
Head (lowest point) → ~2180–2200
Right Shoulder → ~2250–2270
Price now pushing upward again
This is a classic bullish reversal structure.
✅ Key Resistance / Neckline Zone
Marked level around:
2380–2400
Price is currently struggling below this.
That is the neckline / supply barrier.
✅ Bullish Structure Confirmation
Breakout Confirmation = 1H Close Above 2400
If ETH closes above 2400 with volume:
✅ Structure break
✅ Trend shift begins
✅ Upside continuation likely
🎯 Targets After Breakout
Once breakout happens, next targets:
Target Level
Target 1 2494
Target 2 2600
Target 3 2700
🛑 Invalidation / Stop Loss Area
If ETH drops below:
2250 support
Then structure fails and price can revisit:
2200
2100 zone

Repeated Kumo Breakdowns on NIFTY – 2H LTFThe budget-day price action has resulted in yet another Kumo breakdown on the NIFTY 2H timeframe.
Does this add more weight to the already active bears ?
Or is this an opportunity for bulls to attempt base formation near potential bearish exhaustion?
Let’s evaluate the structure.
What would materially improve the odds for Bulls?
- A decisive 2H close above the 0.786 Fibonacci retracement of the budget-day fall.
This would open up the possibility of price action retesting the Kumo bottom.
- A decisive 2H close above the Kumo break candle, indicating improving bullish strength and the ability to penetrate deeper into the cloud.
- A decisive 2H close above the Kumo top, which would signal structural negation of the current Kumo breakdown.
What would materially improve the odds for Bears?
- A decisive 2H close below the 0.618–0.786 Fibonacci zone, preferably with upper wicks, indicating rejection from resistance.
- A decisive 2H close below both Tenkan and Kijun, which are already positioned below the Kumo bottom.
- A decisive 2H close below the recent 2H swing low, confirming continuation beyond equilibrium.
Price action is once again at an important decision-making zone.
Let’s wait and watch how the structure resolves.
This is an educational market-structure analysis and not trading advice.

What happens when major indices (Nifty & BankNifty) align with What happens when major indices (Nifty & BankNifty) align with each other not only in terms of market structure but also in terms of trend direction & timing ?
Well, we end up with high-probability trade environments that allows for asymmetrical risk-to-reward
Note - While the 15-minute chart highlights the broader alignment, the timing and rejection behavior becomes much clearer when drilling down to the 5-minute structure

#NIFTY Intraday Support and Resistance Levels - 02/02/2026Nifty is expected to open with a slightly positive gap, but the broader structure remains weak after the sharp breakdown seen in the previous session. The index has fallen decisively from the 25250–25300 resistance zone and slipped below multiple intraday supports, indicating that selling pressure is still dominant. This small gap-up opening should be seen as a technical pause or minor pullback rather than a clear sign of strength unless price action improves significantly after the open.
From a technical point of view, the zone around 25000 is a crucial psychological and technical level. This area is acting as a make-or-break zone for today’s session. If Nifty manages to reclaim and sustain above 25000 on a closing basis, a short-term reversal bounce can be expected. In such a scenario, the index may gradually move towards 25150, then 25200, and extend up to 25250+. This move would mainly be driven by short covering, so follow-through buying and stability above 25000 will be very important to confirm any bullish reversal.
On the downside, the price structure is still bearish as Nifty is trading below its recent support band of 24950–24900. Any failure to hold above this zone, or rejection near 24950, can invite fresh selling pressure. Below 24900, the index may slide towards 24850, followed by 24800 and 24750. These levels are important intraday supports, and a break below them can further accelerate the downside momentum.
If the selling pressure intensifies and Nifty breaks below 24700, the bearish trend can deepen further. In that case, the next downside targets come in near 24600, 24550, and 24500. Such a move would indicate panic selling or continuation of the broader weakness seen in recent sessions. Volatility is likely to remain high, so traders should be prepared for sharp and fast moves on both sides.
Overall, despite the slightly gap-up opening, the trend remains cautious to bearish. Bulls need a strong hold above 25000 to regain control, while bears will continue to dominate below 24950. Traders should wait for clear confirmation near these key levels before taking positions, keep position sizes light, and follow strict risk management, as whipsaws are highly possible in the current market environment.

#BANKNIFTY PE & CE Levels(02/02/2026)Bank Nifty is expected to open with a slightly positive gap, but the overall structure still reflects weakness after the sharp sell-off seen in the previous session. The index has decisively broken below the important 59050–58950 support zone, which earlier acted as a strong demand area. This breakdown has shifted the short-term trend clearly on the bearish side, and the gap-up opening should be treated more as a pullback rather than a trend reversal unless key levels are reclaimed.
From a technical perspective, the fall from the 59550–59600 region confirms strong supply at higher levels. The current price action is forming lower highs and lower lows on the 15-minute timeframe, indicating sustained selling pressure. Any bounce toward 58950–59050 is likely to face resistance, as this zone now turns into a supply area. If Bank Nifty fails to hold above this range after the opening, fresh selling pressure can re-emerge quickly.
On the downside, the immediate support lies near 58550–58450. A break below 58450 can accelerate the bearish momentum further, opening the gates for deeper targets around 58250, 58150, and potentially 58050. These levels are critical intraday and positional supports, and increased volatility can be expected if they are tested. As long as the index remains below 59000, bears will continue to have an upper hand.
On the upside, only a strong and sustained move above 59050 can provide some relief to the bulls. If Bank Nifty manages to reclaim and hold above 59050–59100, a short-covering bounce toward 59250, 59350, and 59450+ is possible. However, such a move should be confirmed with follow-through buying; otherwise, it may turn into a selling-on-rise opportunity.
Overall, despite the slightly gap-up opening, the market context remains cautious to bearish. Traders should avoid aggressive long positions near resistance zones and focus more on sell-on-rise or breakdown-based strategies. Strict risk management is essential, as volatility is expected to stay elevated after the recent sharp move. Patience during the opening minutes and confirmation of price action near key levels will be crucial for safer trades.

Ujjivan Small Finance cmp 62.35 by Weekly Chart view since listeUjjivan Small Finance cmp 62.35 by Weekly Chart view since listed
- Support Zone 54.50 to 61.50 Price Band
- Resistance Zone 64 to ATH 68 Price Band
- Bullish Rounding Bottoms by Support Zone neckline
- Bullish Cup and Handle within the 2nd Rounding Bottom
- Falling Resistance Trendlines Breakout seems well sustained
- Volumes spiking and well above the average traded quantity
- Rising Price Channel has been well respected and also sustained
- High Target probable by Bullish Chart setup with Support Zone Breakout earlier Resistance Zone

Decoding Today’s Price Action on a Major Event Day(Union Budget)Is today’s market fall because of a negative budget surprise? Maybe yes, maybe no. That debate doesn’t help much.
But what does help is understanding that price action had already started preparing for this move nearly 10 days ago.
Candlesticks do speak — But only to those who have the patience to listen . Here's what they announced in advance:
Event days might trigger big moves — but structure prepares them in advance to facilitate big price movements

NIFTY trapped between two magnets - A flat Kijun & flat Senkou BNIFTY's daily chart price action is stuck between two magnetic levels that tend to attract price towards them - A flat Kijun & a flat Senkou B. Which magnet is more powerful? With union budget round the corner, expecting one of the level to play out very soon
This analysis is for educational purposes only

Silver Weekly Outlook: Post-Exhaustion PhaseSilver has entered a high-volatility post-exhaustion phase after a sharp parabolic rise followed by an equally aggressive correction. The weekly chart clearly shows that price moved too far, too fast, and the recent sell-off is a classic example of mean reversion after euphoric buying. Such phases rarely resolve in a straight line and typically evolve into consolidation, base-building, or deeper corrective structures.
At current levels, Silver is hovering near an immediate demand zone around the 80–85 region, which now acts as a crucial decision area. This zone represents the first major area where buyers are expected to defend aggressively. The way price behaves here will define the next medium-term trend.
Scenario A – Range / Base Formation (High Probability):
The most probable outcome at this stage is sideways consolidation. After a vertical fall, markets often need time to absorb supply and rebuild demand. If Silver manages to hold above the immediate demand zone and starts forming higher lows on lower timeframes, it would indicate base formation rather than trend failure. This scenario favors range traders and patient positional participants, as price may oscillate between support and overhead resistance for several weeks or months.
Scenario B – Breakdown Continuation (Moderate Probability):
If the current support zone fails decisively with strong weekly closes below it, Silver could enter a deeper corrective phase. In such a case, price may gravitate toward the next major demand zone near 73–75, which aligns with prior consolidation and breakout structure. This move would likely be driven by broader risk-off sentiment or macro pressure rather than technical weakness alone. Traders should avoid aggressive longs if this breakdown structure develops.
Scenario C – Bullish Reclaim and Bounce (Low Probability, Needs Confirmation):
A less likely but still possible outcome is a bullish reclaim, where Silver holds current levels, absorbs selling pressure, and reclaims the 90+ zone with strong weekly confirmation. For this scenario to gain credibility, price must show acceptance above resistance with volume and structure. Until then, any bounce should be treated as reactive and corrective, not a confirmed trend reversal.
From a structural perspective, the major resistance remains far above near the 115–120 zone, which was the distribution area before the sharp reversal. This level will act as a long-term supply cap unless Silver builds a strong base over time.
In summary, Silver is no longer in a trending phase but in a transition zone. Patience is critical here. Traders should focus less on prediction and more on reaction to price behavior at key demand levels. Let structure, confirmation, and risk management guide decisions, as this phase can easily trap both early bulls and aggressive bears if approached without discipline.

SHARDACROP: Strong Q3, Descending Trainlge BO, Chart of the WeekFrom Descending Triangle Breakout to Q3FY26 Glory: Why Sharda Cropchem's Could Be Your Next Big Move Lets Understand in "Chart of the Week"
As per the Latest SEBI Mandate, this isn't a Trading/Investment RECOMMENDATION nor for Educational Purposes; it is just for Informational purposes only. The chart data used is 3 Months old, as Showing Live Chart Data is not allowed according to the New SEBI Mandate.
Disclaimer: "I am not a SEBI REGISTERED RESEARCH ANALYST AND INVESTMENT ADVISER."
This analysis is intended solely for informational purposes and should not be interpreted as financial advice. It is advisable to consult a qualified financial advisor or conduct thorough research before making investment decisions.
Price Action Analysis:
Long-Term Trend Overview:
- The stock has demonstrated a multi-year uptrend from 2021 levels around 300-350 to current levels near 1,035
- A significant rally occurred from mid-2021 to early 2025, where the stock surged from approximately 350 to an all-time high of 1,181
- Post the January 2025 peak, the stock has entered a consolidation phase with a descending triangle pattern formation
- Current price of 1,035.85 (as of January 31, 2026) represents a 28.46% gain, showing strong momentum recovery
Recent Price Action Characteristics:
- The stock made an all-time high of 1,181 in early January 2025
- Following the peak, a corrective phase ensued with the formation of lower highs
- A clear descending trendline can be observed connecting the highs from January 2025 peak through subsequent rallies
- The stock found support multiple times around the 750-800 zone, establishing this as a critical demand area
- On January 31, 2026, the stock broke above the descending trendline with a strong bullish candle supported by robust volumes (11.25M shares traded)
Key Technical Patterns:
- Descending Triangle Pattern: The chart clearly shows a descending triangle structure with lower highs and a flat support base around 750-800
- Trendline Break: The recent price action has broken through the descending resistance trendline, which is a classic bullish reversal signal
- The breakout was accompanied by good volumes of 2.03M (shown in green), indicating strong buying interest
- The price action suggests a potential trend reversal from the consolidation phase to a new uptrend
Volume Spread Analysis:
Volume Trends and Characteristics:
- The volume chart shows sporadic high-volume days during the entire period
- The recent breakout candle is accompanied by elevated volumes of 11.25M shares
- Volume of 11M is above average, confirming the validity of the breakout
- Historical volume spikes are observed during significant price movements, both up and down
Volume-Price Correlation:
- During the 2021-2022 rally, several high-volume green bars supported the upward price movement
- The consolidation phase from January 2025 to January 2026 saw relatively lower volumes, typical of a basing pattern
- The recent breakout is validated by the volume surge, a positive technical sign
- Absence of high red volume (selling pressure) during the breakout indicates limited supply
Volume Implications:
- The volume profile suggests strong institutional participation during key price movements
- The current breakout with good volume indicates conviction among buyers
- Sustained volumes above the 2-3M range would confirm continued buying interest
- Any pullback on lower volumes would be healthier and offer better entry opportunities
Support and Resistance Analysis:
Major Support Levels:
- Primary Support Zone: 750-800 (tested multiple times during the consolidation phase, proving to be a strong demand zone)
- Secondary Support: 700 (psychological level and previous consolidation area)
- Critical Support: 600-650 (major swing low from mid-2024, breaking this would invalidate the bullish structure)
- Long-term Support: 500 (aligns with historical resistance turned support from early 2024)
Major Resistance Levels:
- Immediate Resistance: 1,100 (previous consolidation high and psychological barrier)
- All-Time High Resistance: 1,181 (needs to be reclaimed for continuation of uptrend)
- Potential Resistance: 1,200-1,250 (psychological round numbers)
- The broken descending trendline around 900-950 zone may now act as support on any pullbacks
Base Formation Analysis:
- The stock has formed a strong multi-week base between 750 and 800
- This base structure resembles a consolidation platform after a strong uptrend
- The base formation duration provides strong foundation for the next leg up
- The base is indicating accumulation rather than distribution
Technical Pattern Analysis:
Descending Triangle Breakdown and Resolution:
- Pattern Formation: The descending triangle started forming from the January 2025 high at 1,181
- Pattern Characteristics: Lower highs (descending resistance) meeting horizontal support at 750-800
- Pattern Resolution: The recent upward breakout from the descending trendline on January 31, 2026
- Breakout Confirmation: Strong bullish candle with +28.46% gain and volume of 11.25M shares
Short-Term Trend Assessment:
- The recent breakout candle establishes a strong bullish bias in the short term
- The stock has moved from a downtrend (within the triangle) to potentially starting a new uptrend
- Higher high formation above 1,035 would confirm the trend reversal
- The immediate trend is bullish with the breakout above both the trendline and the 900-950 resistance cluster
Medium-Term Outlook:
- The stock needs to sustain above 950-1,000 levels to confirm medium-term bullish structure
- A move above the previous high of 1,181 would resume the primary uptrend
Long-Term Perspective:
- The overall structure from 2021 remains bullish with higher lows and higher highs
- The current consolidation is a healthy correction within a larger uptrend
- Long-term investors can view the 750-800 zone as a strong accumulation area
- The secular trend in the agrochemical sector supports the long-term bullish thesis
Fundamental and Business Overview:
Company Profile and Business Model:
- Sharda Cropchem Ltd is engaged in the marketing and distribution of agrochemicals globally
- The company operates an asset-light business model, focusing on identifying generic molecules, preparing dossiers, seeking registrations, and marketing through distributors
- Core product portfolio includes formulations and generic active ingredients across fungicide, herbicide, and insecticide segments
- The company also operates a non-agrochemicals business including conveyor belts, V-belts, dyes, and industrial chemicals
Geographic Revenue Distribution:
- Europe: Contributes approximately 53% of agrochemical revenue, making it the largest market
- NAFTA (North America): Accounts for around 34% of agrochemical business
- Latin America (LatAm): Represents about 9-10% with high growth potential
- Rest of World: Includes India and other emerging markets
- The company has a presence across 80+ countries with over 150 distributors in India alone
Registration Portfolio and Competitive Moat:
- The company has 2,821 active product registrations globally as of March 2023
- Strong pipeline of 1,143 registrations under process, mainly in EU, US, and LatAm
- The registration process serves as a significant entry barrier due to high costs, complexity, and time requirements
- The company invests approximately 350-400 crores per annum toward new product registrations
- Registrations in highly regulated markets (EU, US) provide sustainable competitive advantages
Recent Financial Performance:
Q3 FY26 Results Highlights (Quarter Ended December 2025)
- Net Sales: Rs 1,288.76 crores, representing 38.7% YoY growth
- Net Profit: Rs 145.12 crores, a stellar 365.87% YoY surge from Rs 31.15 crores in Q3 FY25
- PAT Margin: Expanded dramatically to 11.26% from 3.35% in Q3 FY25, a gain of 791 basis points
- Gross Profit Margin: Stood at 20.32%, significantly improved from 12.36% in Q3 FY25
- The margin expansion reflects improved product mix, better pricing realization, and effective cost management
Nine-Month FY26 Performance (April-December 2025):
- Consolidated Net Sales: Rs 3,202.68 crores, up 27.57% YoY
- Net Profit: Rs 362.21 crores, representing 257.33% YoY growth
- ROCE: Impressive 20.85% for the nine-month period, the highest recorded in recent periods
- The company declared an interim dividend of Rs 6 per share
- Strong cash generation and zero-debt balance sheet underscore financial strength
Financial Trend and Quality Metrics:
- Five-year Sales CAGR: 17.65%, demonstrating consistent top-line growth
- Five-year EBIT CAGR: 21.17%, showing strong operational leverage
- Debt Status: Company is almost debt-free, providing financial flexibility
- EBIT to Interest Coverage: Average of 100 times, indicating negligible debt burden
- Return on Equity: Currently at 9.89% over last 3 years (considered low, but improving)
Sectoral and Industry Backdrop:
Indian Agrochemical Market Overview
- Market Size: The Indian agrochemical market is valued at approximately USD 8-9 billion in 2025
- Growth Trajectory: Expected to grow at a CAGR of 5.5-7.5% during 2026-2032 period
- Market Drivers: Rising population, increasing food demand, agricultural intensification, and government support
- India is ranked as one of the top 10 consumers and producers of agrochemicals globally
Market Dynamics and Growth Drivers:
- Food Security Imperative: India's population projected to reach 1.5 billion by 2030, necessitating enhanced agricultural productivity
- Crop Loss Prevention: Annual crop losses due to pests, weeds, and diseases estimated at 15-25%, valued at USD 10-15 billion
- Land Constraints: Declining arable land per capita due to urbanization drives need for yield optimization
- Technology Adoption: Increasing adoption of precision farming, drone spraying, and fertigation systems
- Export Opportunity: India's status as a net exporter strengthened by global demand for generic agrochemicals
Government Initiatives and Policy Support
- Make in India: Government recognizes agrochemical industry as one of top 12 industries for global leadership
- Subsidy Programs: Continued support through fertilizer subsidies (INR 3.68 lakh crore committed till March 2025)
- PM-PRANAM Scheme: Launched in 2023 to incentivize balanced fertilizer use and alternative technologies
- Drone Subsidies: Up to 40% subsidy on drone purchases for precision spraying
- Digital Infrastructure: Integration of land records, soil health cards, and farmer databases to facilitate input access
Segment-wise Market Trends
- Fertilizers: Hold 55% market share, driven by high applicability across all cropping systems
- Pesticides: Growing at faster CAGR of 10.52% through 2030, with focus on herbicides and fungicides
- Insecticides: Dominate with 72.5% of pesticide market due to tropical climate and pest pressure
- Biopesticides: Emerging segment accounting for 15% of market, driven by sustainability focus
- Regional Dynamics: South India projected to show highest growth due to horticulture and high-value crop expansion
Industry Challenges and Headwinds:
- Chinese Dependence: High reliance on Chinese suppliers for raw materials and active ingredients
- Import Dependency: Trade deficit of around USD 31 billion in chemicals sector due to infrastructure bottlenecks
- Pricing Pressure: Competition from low-priced Chinese products putting pressure on realizations
- Regulatory Complexity: Increasing cost of registrations and re-registrations in developed markets
- Working Capital Intensity: Large inventory and receivables requirements due to wide product portfolio and geography
Competitive Positioning and Business Strengths:
Sharda's Competitive Advantages:
- Asset-Light Model: Focus on registration, marketing, and distribution rather than manufacturing
- Registration Moat: 2,821 active registrations create significant barriers to entry
- Global Footprint: Presence in 80+ countries with diversified revenue streams
- Developed Market Focus: 83-85% revenue from Europe and NAFTA, which are high-value, stable markets
- Debt-Free Balance Sheet: Provides financial flexibility for growth investments
Business Model Strengths:
- Third-Party Manufacturing: Partnerships with manufacturers allow capital-efficient scaling
- Diversified Portfolio: Over 200 products across multiple crop protection categories
- Strong Pipeline: 1,143 registrations in process ensure future revenue visibility
- Direct Sales Force: Building own sales teams in key markets (Europe, US, Canada, Mexico) in addition to distributors
- Non-Agro Diversification: 17% revenue from non-agrochemical business reduces concentration risk
Strategic Positioning in Generic Agrochemicals:
- Generic Focus: Targets off-patent molecules where 75% market share is still held by innovators
- Value Proposition: Offers cost-competitive alternatives to multinational brands
- Regulatory Expertise: Proven capability in navigating complex registration processes in developed markets
- Customer Relationships: Supplies to MNCs as well as end customers, providing multiple revenue channels
- Quality Compliance: Meets stringent regulatory standards of EU and US markets
Valuation Metrics:
- P/E Ratio: Trading at 20x trailing earnings, below industry average of 29x
- EV/EBITDA: 10.61x appears reasonable given the 365.87% profit growth trajectory
- PEG Ratio: 0.18 suggests the stock is significantly undervalued relative to its growth
- Dividend Yield: 0.91% with conservative payout ratio of 84.89% for FY25
Key Strengths:
- Strong quarterly momentum with 365.87% YoY profit growth in Q3 FY26
- Expanding margins (PAT margin up 791 bps YoY) indicating operational improvement
- Record ROCE of 20.85% demonstrating efficient capital deployment
- Zero-debt balance sheet providing safety and growth flexibility
- Technical breakout from year-long consolidation backed by strong volumes
Risk Factors and Concerns:
- Dependence on Chinese Suppliers: Raw material sourcing concentrated in China exposes to currency and policy risks
- Competitive Pricing: Generic nature of business faces pricing pressure from both innovators and other generic players
- Working Capital Intensity: High debtors of 165 days and large inventory requirements
- Regulatory Risks: Stroke of pen risk where simplified registration processes could erode competitive moat
- MNC Competition: Large multinationals with better brand equity and distributor relationships
- Seasonality: 35-40% revenue and 50-55% profit concentrated in certain quarters
Management Guidance and Outlook:
- FY26 Guidance: Company targets 15%+ topline growth with EBITDA margins in 15-18% range
- Capex Plans: Rs 400-450 crore planned investment in registrations for FY26
- Registration Pipeline: Focus on strengthening portfolio across Europe, NAFTA, and LatAm
- Margin Trajectory: Gross margins expected to stabilize around 30-35% range with input cost normalization
- Geographic Expansion: Continued strengthening of sales force in key markets
Sectoral Tailwinds Supporting Growth:
- Indian agrochemical market growing at 5.5-7.5% CAGR through 2032
- Global demand for generic agrochemicals increasing as patents expire
- Government support through Make in India and agricultural modernization programs
- Increasing adoption of precision farming and technology-driven agriculture
- Export opportunities expanding as India becomes a preferred sourcing destination
Monitoring Parameters:
- Volume Consistency: Weekly volumes should sustain above 1.5-2M for continued momentum
- Support Holding: 750-800 zone must hold on any pullbacks
- Quarterly Results: Track margin trends and volume growth in subsequent quarters
- Sectoral Trends: Monitor agrochemical industry news, Chinese raw material prices, and global demand
- Competitive Action: Watch for pricing pressures or market share changes
My 2 Cents:
- Sharda Cropchem has broken out of a descending triangle pattern with strong volumes
- The 750-800 support zone has proven to be a robust demand area tested multiple times
- Volume-backed breakout on January 31, 2026 (+28.46%) confirms buying conviction
- The stock is transitioning from consolidation to a potential new uptrend
- The stock presents a compelling combination of technical breakout and fundamental improvement
- Strong quarterly numbers have acted as a catalyst for the technical pattern resolution
- Valuation at 20x P/E with PEG of 0.18 suggests room for re-rating
- The 750-800 base provides a strong foundation for the next leg of upward movement
Full Coverage on my Mid-Week Newsletter coming Wednesday.
Keep in the Watchlist and DOYR.
NO RECO. For Buy/Sell.
📌Thank you for exploring my idea! I hope you found it valuable.
🙏FOLLOW for more
👍BOOST if you found it useful.
✍️COMMENT below with your views.
Meanwhile, check out my other stock ideas on the right side until this trade is activated. I would love your feedback.
As per the Latest SEBI Mandate, this isn't a Trading/Investment RECOMMENDATION nor for Educational Purposes; it is just for Informational purposes only. The chart data used is 3 Months old, as Showing Live Chart Data is not allowed according to the New SEBI Mandate.
Disclaimer: "I am not a SEBI REGISTERED RESEARCH ANALYST AND INVESTMENT ADVISER."
This analysis is intended solely for informational purposes and should not be interpreted as financial advice. It is advisable to consult a qualified financial advisor or conduct thorough research before making investment decisions.

If You Want to Catch the Bottom, First Wait for RSI.To Do Nothing.
Right now, staying out is already a win.
The market is moving fast, noisy, and uncomfortable. Both buyers and sellers are getting trapped — not because direction is unclear, but because the market has not finished its process yet.
This is a moment to stay calm and observe, not to force a trade.
Observe how price begins to slow down.
Observe how selling pressure fades.
Note:
Stay focused on RSI behavior. When price decelerates and RSI shows clear convergence / stabilization, that’s when it makes sense to start thinking about potential long ideas — not before.
Until then, observation comes first.
Sometimes, doing nothing is the most disciplined decision you can make.

#NIFTY Intraday Support and Resistance Levels - 30/01/2026Nifty is expected to open on a flat note, indicating indecision after the recent recovery from lower levels. The index is currently trading around the 25420–25450 zone, which has emerged as an immediate resistance area. A flat opening near this region suggests that the market is entering a consolidation phase, where buyers and sellers are evenly matched. Early session movement may remain choppy as participants wait for a clear directional trigger.
Technically, the broader structure of Nifty has improved after holding strong support near 25000–25200 and bouncing back sharply. This recovery has shifted the short-term trend from bearish to neutral-to-positive. However, the zone between 25450 and 25550 remains a crucial supply area. Until Nifty gives a decisive breakout above this range, upside momentum may stay limited and profit booking can appear near higher levels.
On the upside, a sustained move above 25250–25300 keeps the bullish bias intact for intraday trades. If the index manages to break and hold above 25550, it can trigger fresh long positions with upside targets of 25650, 25700, and potentially 25750+ in extension. Such a breakout would indicate strength and continuation of the recovery move, especially if supported by good volume and broader market participation.
On the downside, failure to sustain above 25400–25450 can lead to a short-term reversal. A rejection from this resistance zone may drag Nifty back toward 25350 and 25300 initially. If selling pressure increases and the index slips below 25200, the downside may extend toward 25100, 25050, and even the psychological 25000 level. The 25000–25050 zone remains a strong demand area where buyers are expected to defend aggressively.
Overall, Nifty is currently placed in a consolidation range with clearly defined support and resistance levels. Traders should avoid aggressive positions during the opening phase and wait for a confirmed breakout or breakdown. Range-bound strategies with strict stop-losses can work better in such conditions, while trend trades should only be taken after a clear move beyond the key levels. Discipline and patience will be crucial as volatility may expand once the consolidation resolves.

#BANKNIFTY PE & CE Levels(30/01/2026)Bank Nifty is expected to open on a flat note, indicating a pause after the recent sharp upside move. The index is currently hovering near the 59950–60000 zone, which is acting as an important decision-making area. A flat opening around this range suggests that the market is digesting recent gains and waiting for confirmation before choosing the next direction. Early session price action may remain range-bound, with whipsaws possible near key intraday levels.
From a technical perspective, Bank Nifty has shown strong bullish momentum over the last few sessions, recovering sharply from lower support zones near 59000–59200. This bounce reflects aggressive buying interest and short covering, which has helped the index reclaim crucial resistance levels. However, the zone around 60000–60050 remains a major supply area. Unless the index sustains above this level with strong volumes, upside continuation may face temporary hurdles.
On the bullish side, if Bank Nifty manages to hold above 59550–59600 and shows strength above 60050, fresh long positions can be considered. A sustained move above 60050 may open the path for upside targets of 60250, 60350, and potentially 60450+ in extension. Traders should look for a strong 15-minute close above resistance to avoid false breakouts. Partial profit booking near each target is advisable, given the recent sharp rally.
On the bearish or corrective side, rejection near the 60000–60050 zone can lead to profit booking. If Bank Nifty slips below 59950–59900, short-term weakness may emerge, dragging the index toward 59750 and 59650. Further breakdown below 59450 would indicate a deeper correction, with downside targets around 59250, 59150, and 59050. The 59000–59050 zone remains a strong support area, where buyers are expected to re-enter if the decline is gradual.
Overall, the structure remains bullish as long as Bank Nifty holds above 59500, but the current flat opening hints at consolidation rather than an immediate trending move. Traders should remain patient in the opening hour, avoid chasing prices, and focus on clear break-and-sustain setups. Strict stop-loss management and disciplined execution will be crucial, as volatility may increase once the range resolves in either direction.

#NIFTY Intraday Support and Resistance Levels - 29/01/2026Nifty is expected to open on a flat to mildly positive note, indicating stability after the recent recovery from lower levels. The index is currently trading around the 25340–25350 zone, which is an important intraday pivot. A flat opening near this level suggests that the market is waiting for fresh cues before committing to a directional move. Volatility may remain moderate in the initial phase, with price action largely driven by how Nifty behaves around key support and resistance zones.
From a technical structure point of view, Nifty has shown a decent pullback from the 25000 support area, where strong buying interest was seen earlier. This bounce indicates that buyers are still active at lower levels. However, the upside is capped near the 25450–25500 resistance zone, which has repeatedly acted as a supply area. Until this zone is decisively broken, the index may continue to trade in a defined range, offering selective intraday opportunities rather than trending moves.
On the bullish side, if Nifty manages to sustain above 25250 on a 15-minute closing basis, it would indicate strength and continuation of the short-term upmove. In this scenario, long positions can be considered above 25250 with an initial target of 25350. If momentum builds further, the index can move toward 25400 and then 25450+, where partial profit booking is advisable due to expected selling pressure. A strong close above 25450 would further improve the bullish outlook for the coming sessions.
On the downside, failure to hold above 25200 would weaken the immediate structure. If Nifty breaks and sustains below 25200, it may trigger a short-term correction. In such a case, downside targets of 25100 and 25050 come into play, followed by the psychological 25000 level. The 25000–25050 zone remains a crucial support area, where fresh buying or a reversal attempt can be expected. A clean breakdown below 25000 would increase bearish momentum and may lead to deeper correction, though that seems less likely without strong negative cues.
For intraday traders, the zone between 25200 and 25250 should be treated as a wait-and-watch area, as price action here can be choppy and directionless. The best trades are expected only after a clear breakout above resistance or a confirmed breakdown below support. Strict stop-loss, partial profit booking, and disciplined position sizing are essential, as the market is still in a consolidation-to-reversal phase rather than a strong trend.
Overall, Nifty is positioned at a crucial juncture. Holding above 25250 keeps the bias mildly positive, while a break below 25200 shifts the bias toward a short-term corrective move. The session is likely to reward traders who focus on levels, confirmation, and risk management rather than aggressive directional bets.

#BANKNIFTY PE & CE Levels(29/01/2026)Bank Nifty is expected to open flat, indicating a pause in momentum after the recent sharp recovery from lower levels. Such flat openings generally signal indecision in the market, especially when the index is trading close to an important resistance zone. At present, Bank Nifty is hovering near the 59550–59600 area, which has acted as a strong supply zone in recent sessions. This makes today’s trade more level-driven, with higher chances of range-bound movement and sudden volatility around key levels.
From a broader structure perspective, the index has bounced strongly from the sub-58500 region, mainly due to short covering. However, as price approaches higher resistance zones, fresh buying strength needs confirmation. Until that happens, the market may either consolidate in a narrow range or show false breakouts followed by quick reversals. Traders should avoid anticipating moves and instead react to confirmed price action.
On the bullish side, if Bank Nifty manages to sustain above 59550 on a 15-minute closing basis, it would indicate that buyers are gaining control despite the overhead supply. In such a scenario, call options can be considered above 59550. The first upside target would be around 59750, which is a minor resistance and a good zone for partial profit booking. If momentum continues, the next levels to watch are 59850 and then 59950 or higher. Near the 60000 psychological level, strong profit booking is expected, so trailing stop-loss becomes crucial for long positions.
On the bearish side, failure to hold above 59550 followed by a breakdown below the 59450–59400 zone would indicate rejection from higher levels. This would open the door for a corrective move. In that case, put options can be considered around 59450–59400. The immediate downside targets would be 59250 and then 59150. If selling pressure increases, the index could drift toward the 59050–59000 support zone. A clear break below 59050 would weaken the structure further, though such a move would likely require negative global cues or heavy institutional selling.
For intraday traders, the zone between 59450 and 59550 should be treated as a no-trade area, as price action here can be choppy and misleading. The best trades are expected only after the market shows clear acceptance above resistance or below support. Partial profit booking at every target and strict risk management are essential due to the possibility of sudden spikes on either side.
Overall, Bank Nifty is at a crucial decision point. Sustained trade above 59550 favors bullish continuation, while rejection and breakdown below 59400 may lead to a pullback. The session is likely to be volatile but structured, rewarding traders who stick to levels, wait for confirmation, and avoid emotional or over-leveraged positions.
