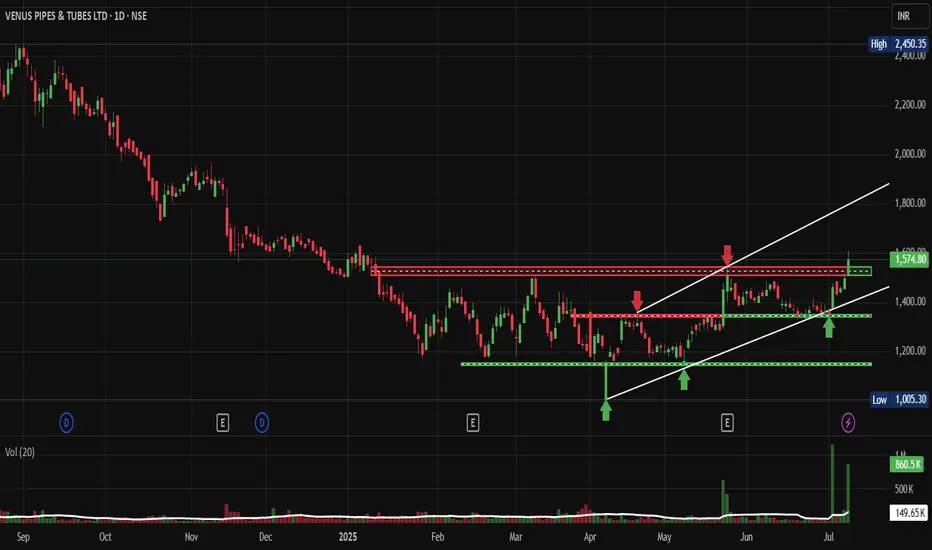
Venus Pipes: A Breakout Story in the MakingNSE:VENUSPIPES : A Breakout Story in the Making
Price Action Analysis:
• Price consolidated between 1,200-1,600 levels from January 2025 to June 2025
• Recent breakout above 1,600 resistance with strong volume confirmation
• Currently trading at 1,574.80 after hitting a high of 2,450.35
• Pullback to retest the breakout level suggests healthy consolidation
Volume Spread Analysis:
• Significant volume spike during the recent breakout phase
• Volume increased from an average of 149.65K to 860.5K, indicating institutional interest
• Higher volume during up moves compared to down moves shows buying pressure
• Volume pattern supports the breakout thesis with strong participation
Key Technical Levels:
Support Levels:
• Primary Support: 1,200 (previous base level)
• Secondary Support: 1,400 (mid-range support)
• Immediate Support: 1,500 (recent pullback low)
Resistance Levels:
• Immediate Resistance: 1,650 (recent high)
• Major Resistance: 2,450 (lifetime high)
• Psychological Resistance: 2,000 and 2,500
Base Formation:
• Strong base formed between 1,200-1,400 levels over 6 months
• Multiple retests of support levels showing accumulation
• Base provides a strong foundation for upward movement
Technical Patterns:
Primary Pattern:
• Bullish continuation pattern with horizontal resistance at 1,600 and rising support line
• Pattern duration: 8 months (Jan 2025 to July 2025)
• Breakout confirmed with volume expansion
Secondary Patterns:
• Higher low pattern indicating underlying strength
• Volume-price divergence resolved with a recent breakout
Trade Setup:
Entry Strategy:
• Conservative Entry: On pullback to 1,500-1,520 levels
• Aggressive Entry: Current levels around 1,570-1,580
• Breakout Entry: Above 1,650 with volume confirmation
Exit Strategy:
• Target 1: 1,800 (immediate target)
• Target 2: 2,100 (50% retracement of lifetime high)
• Target 3: 2,400-2,500 (lifetime high retest)
Stop-Loss Levels:
• For entries around 1,570: Stop at 1,450 (below base support)
• For entries around 1,500: Stop at 1,350 (below key support)
• Trailing stop: 8-10% below recent swing highs
Risk Management:
Position Sizing:
• Risk per trade: Maximum 2% of portfolio
• Position size calculation: Portfolio value × 2% ÷ (Entry price - Stop loss)
• Gradual position building is recommended, given the volatility
Risk Assessment:
• Risk-Reward Ratio: 1:2 to 1:3 for current setup
• Time horizon: 3-6 months for primary targets
• Market correlation: Monitor broader market sentiment
Sectoral Backdrop:
Steel Pipes and Tubes Industry:
• Infrastructure spending boost under government initiatives
• Demand from the oil and gas sector supports growth
• Housing sector recovery driving construction demand
• Water supply projects creating additional opportunities
Industry Trends:
• Consolidation phase in the sector, favouring established players
• Raw material cost pressures being managed through pricing power
• Export opportunities emerging in neighbouring markets
• Technology upgrades improving operational efficiency
Fundamental Backdrop:
Company Overview:
• Venus Pipes & Tubes is a leading manufacturer of steel pipes and tubes
• Established presence in water supply, structural, and industrial applications
• Strong distribution network across India
• Focus on quality and customer service
Recent Developments:
• Capacity expansion plans to meet growing demand
• Strategic partnerships with infrastructure companies
• Improved working capital management
• Strong order book visibility for coming quarters
Financial Health:
• Steady revenue growth trajectory
• Improving margin profile
• Healthy balance sheet with manageable debt levels
• Strong cash flow generation capabilities
My Take:
Short-term View (1-3 months):
• Consolidation expected around current levels
• Potential for retest of breakout levels
• Volume patterns to be monitored for direction
Medium-term View (3-6 months):
• Upside potential to 2,000-2,200 levels
• Sector rotation could benefit the stock
• Infrastructure spending cycle supporting fundamentals
Long-term View (6-12 months):
• Structural growth story intact
• Market leadership position strengthening
• Potential for significant value creation
Keep in the Watchlist.
NO RECO. For Buy/Sell.
📌Thank you for exploring my idea! I hope you found it valuable.
🙏FOLLOW for more
👍BOOST if you found it useful.
✍️COMMENT below with your views.
Meanwhile, check out my other stock ideas on the right side until this trade is activated. I would love your feedback.
Disclaimer: "I am not a SEBI REGISTERED RESEARCH ANALYST AND INVESTMENT ADVISER."
This analysis is intended solely for informational and educational purposes and should not be interpreted as financial advice. It is advisable to consult a qualified financial advisor or conduct thorough research before making investment decisions.
Priceactionanalysis
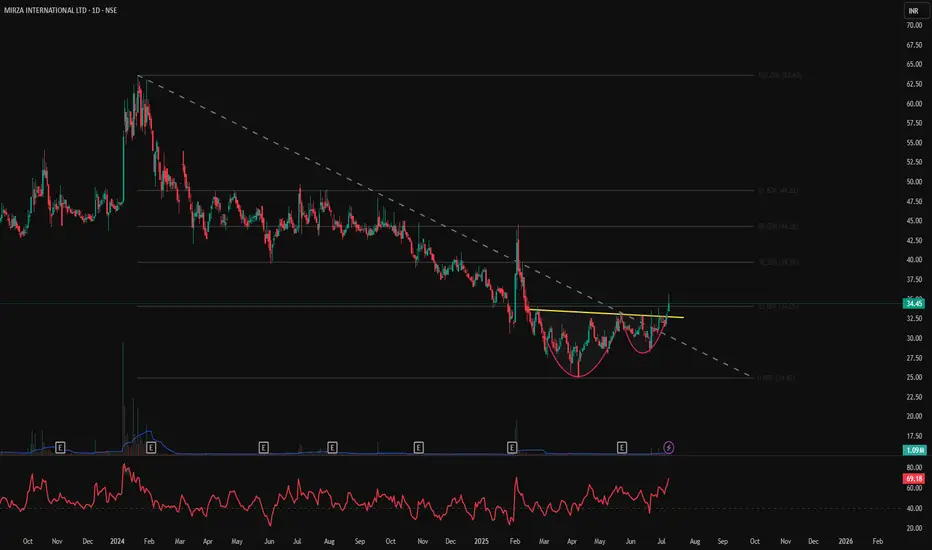
MIRZAINT – Cup & Handle Breakout | Daily Chart📊 MIRZAINT – Cup & Handle Breakout from Order Block | RVol 349% | RSI Near Overbought | Daily Chart
📅 Chart Date: July 8, 2025
📍 CMP: ₹34.45 (+4.71%)
📈 Symbol: NSE:MIRZAINT
🔍 Technical Analysis Breakdown
☕ Cup & Handle Breakout
Classic Cup & Handle pattern breakout above neckline resistance at ~₹33.
Smooth rounding bottom base followed by tight consolidation and bullish breakout.
🟥 Volumized Order Block (OB) Analysis
Previous Supply Zone: Between ₹41–₹49.5.
Demand Zone: ~₹24–₹26, previously respected.
Breakout occurred from a fresh bullish 1D OB .
📈 Relative Volume (RVol%): 349%
Significant volume spike confirms strong buying interest behind the breakout.
📐 Measured OB Data
1.542M (44%) red OB supply previously pushed price down.
Bullish OB of 795.893K (18%) supported accumulation phase pre-breakout.
📊 RSI (14, close): 69.18
Approaching overbought zone (>70), confirming strong trend but may see minor consolidation.
🏁 Key Technical Levels
Breakout Level (Neckline): ₹33.00
CMP: ₹34.45
Resistance Ahead: ₹41.00 → ₹49.50 (previous OB supply zone)
Support: ₹30.00 / ₹26.00 (OB base)
💡 Trade Setup Insight
Entry: CMP on breakout or retest near ₹33
Target 1: ₹41
Target 2: ₹49+
Stoploss: Below ₹30 or ₹26 (OB base zone)
Risk Profile: Moderate to Aggressive
⚠️ Disclaimer: This is an educational chart setup and not trading advice. Please conduct your own research and risk management.
📣 Follow @PriceAction_Pulse for more such clean breakouts and chart pattern analysis!
🔁 Drop a comment if TFCILTD is on your radar for the next breakout rally 📈
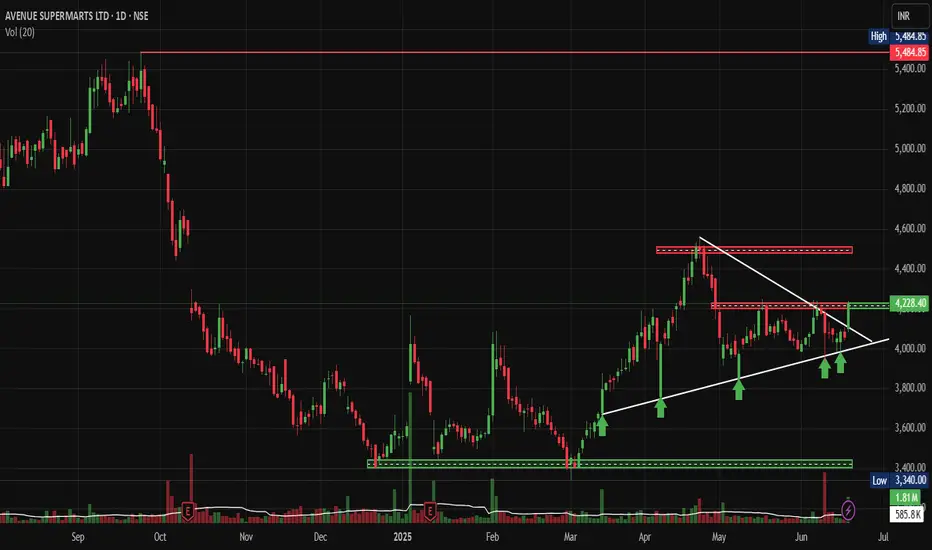
JP Power: Breaking Out After 6-Month ConsolidationNSE:JPPOWER : Breaking Out After 6-Month Consolidation
Price Action Analysis:
• Long-term Trend: Stock has been in a prolonged downtrend from highs of ₹23.77, finding support around ₹12.36
• Recent Pattern: Clear consolidation phase from December 2024 to May 2025 within a rectangular range
• Current Movement: Sharp breakout from consolidation with strong volume confirmation
• Momentum: Bullish momentum building with gap-up opening and sustained buying
Volume Analysis:
• Volume Pattern: Significant volume spike during current breakout session
• Volume Confirmation: Current volume of 195.09M vs average of 41.29M indicates strong institutional participation
• Historical Volume: Notable volume spikes during previous breakout attempts in October 2024
• Volume Quality: Expansion on up-moves and contraction during consolidation phases
Key Technical Levels:
Support Levels:
• Immediate Support: ₹16.35 (previous resistance turned support)
• Strong Support: ₹15.50-16.00 (consolidation base)
• Critical Support: ₹12.36 (52-week low and major support zone)
• Long-term Support: ₹12.00-12.50 (multiple bounce zone)
Resistance Levels:
• Immediate Resistance: ₹18.50-19.00 (previous swing high zone)
• Major Resistance: ₹20.00-20.50 (psychological level and previous rejection zone)
• Target Resistance: ₹22.00-23.00 (measured move target)
• Ultimate Resistance: ₹23.77 (52-week high)
Base Formation:
• Base Type: Rectangular consolidation base
• Base Duration: Approximately 6 months (December 2024 to May 2025)
• Base Range: ₹12.36 to ₹16.35
• Base Depth: Approximately 25% from highs
• Base Quality: Well-defined with multiple tests of support and resistance
Technical Patterns Identified:
Primary Pattern:
• Pattern: Rectangle/Box Consolidation with Breakout
• Formation Period: December 2024 to May 2025
• Breakout Confirmation: Volume-backed breakout above ₹16.35
• Pattern Reliability: High, given the extended consolidation period
Trade Setup:
Entry Strategy:
• Primary Entry: ₹17.50-17.80 (current levels with momentum)
• Pullback Entry: ₹16.50-17.00 (if stock retraces to test breakout level)
• Aggressive Entry: ₹18.00+ (breakout continuation trade)
• Conservative Entry: Wait for weekly close above ₹17.50 for confirmation
Exit Levels:
• Target 1: ₹19.50-20.00 (10-12% upside, resistance zone)
• Target 2: ₹22.00-22.50 (25-27% upside, measured move)
• Target 3: ₹24.00+ (35%+ upside, extension target)
• Trail Stop: Use a 15-20% trailing stop once the first target is achieved.
Stop Loss Strategy:
• Initial Stop Loss: ₹15.50 (below consolidation base)
• Risk: 12-15% from current levels
• Tight Stop: ₹16.00 (for aggressive traders)
• Weekly Close Stop: Below ₹15.80 on weekly closing basis
Position Sizing & Risk Management:
Position Sizing Guidelines:
• Conservative Approach: 2-3% of portfolio (given sector risks)
• Moderate Approach: 3-5% of portfolio
• Aggressive Approach: 5-7% of portfolio (only for risk-tolerant investors)
• Maximum Allocation: Not more than 10% due to sector concentration risk
Risk Management Framework:
• Risk per Trade: Limit to 1-2% of total capital
• Reward-to-Risk Ratio: Minimum 1:2, targeting 1:3
• Portfolio Heat: Consider correlation with other power/infrastructure stocks
• Sector Exposure: Monitor total exposure to the power sector
Sectoral Backdrop:
Power Sector Overview:
• Sector Trend: Power sector showing signs of revival with government's focus on renewable energy
• Policy Support: Government initiatives for power infrastructure development
• Demand Scenario: Growing power demand with industrial recovery
• Investment Climate: Increased capex allocation for power infrastructure
Industry Dynamics:
• Renewable Push: Shift towards renewable energy, creating opportunities
• Transmission Focus: Grid strengthening and transmission line expansion
• Financial Health: Gradual improvement in power sector financials
• Regulatory Environment: Supportive policies for power sector growth
Fundamental Backdrop:
Company Profile:
• Business: Power generation, transmission, and infrastructure development
• Promoter Group: Jaiprakash Associates Group
• Market Cap: Mid-cap power sector player
• Operational Status: Multiple power projects across different states
Key Fundamental Factors:
• Debt Levels: High debt burden remains a key concern
• Asset Quality: Mix of operational and under-construction assets
• Revenue Visibility: Power purchase agreements providing revenue stability
• Execution Risk: Project completion and commissioning risks
• Financial Stress: Historical financial challenges and restructuring efforts
Recent Developments:
• Debt Resolution: Ongoing efforts for debt restructuring and resolution
• Project Status: Updates on project commissioning and operations
• Regulatory Approvals: Progress on pending regulatory clearances
• Strategic Initiatives: Focus on operational efficiency and cost optimization
Risk Factors:
Technical Risks:
• False Breakout: Risk of failure at higher resistance levels
• Volume Sustainability: Need for sustained volume support
• Market Sentiment: Dependency on overall market conditions
• Sector Rotation: Risk of sector-specific selling pressure
Fundamental Risks:
• High Leverage: Elevated debt levels impacting financial flexibility
• Execution Risk: Project execution and commissioning challenges
• Regulatory Risk: Changes in power sector policies
• Liquidity Risk: Working capital and cash flow management issues
My Take:
My Technical Outlook:
• Short-term: Bullish momentum with breakout confirmation
• Medium-term: Potential for 25-30% upside if breakout sustains
• Long-term: Dependent on fundamental improvements and sector revival
My Investment Recommendation:
• Recommendation: Cautious Buy for technical traders
• Time Horizon: 3-6 months for technical targets
• Suitability: Risk-tolerant investors with sector understanding
• Monitoring: Close watch on volume patterns and sector developments
This analysis is based on technical patterns and should be combined with thorough fundamental research and professional advice before making investment decisions.
Keep in the Watchlist.
NO RECO. For Buy/Sell.
📌Thank you for exploring my idea! I hope you found it valuable.
🙏FOLLOW for more
👍BOOST if you found it useful.
✍️COMMENT below with your views.
Meanwhile, check out my other stock ideas on the right side until this trade is activated. I would love your feedback.
Disclaimer: "I am not a SEBI REGISTERED RESEARCH ANALYST AND INVESTMENT ADVISER."
This analysis is intended solely for informational and educational purposes and should not be interpreted as financial advice. It is advisable to consult a qualified financial advisor or conduct thorough research before making investment decisions.

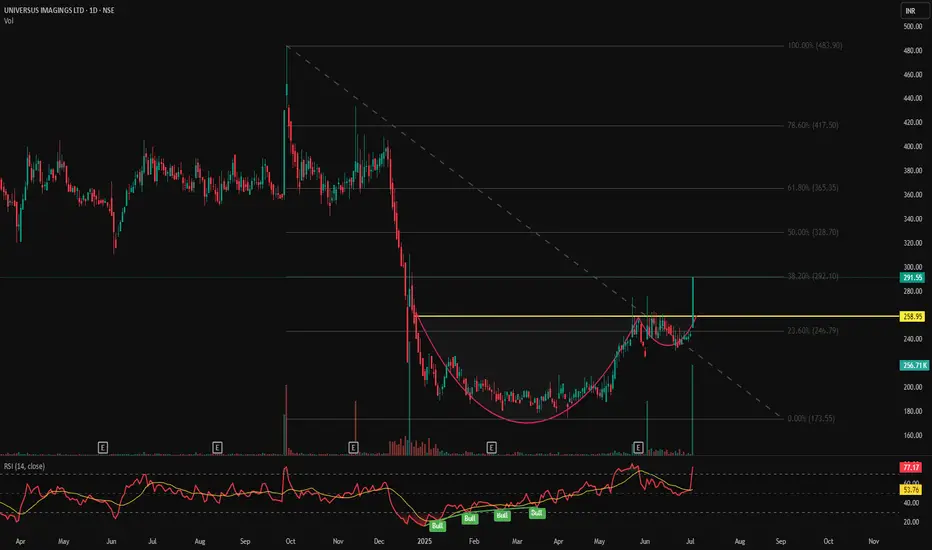
UNIVPHOTO - Cup & Handle Breakout | Daily Chart📊 UNIVPHOTO – Cup & Handle Breakout | Strong Volume | RSI Overbought | Fibonacci Confluence | Daily Chart
📅 Chart Date: July 3, 2025
📍 CMP: ₹291.55 (+20.00%)
📈 Symbol: NSE:UNIVPHOTO
🔍 Technical Analysis Summary
✅ Cup & Handle Breakout
Price has broken out above the neckline of the Cup & Handle pattern at ₹258.95 with strong bullish momentum.
Post-consolidation breakout visible with a solid bullish candle.
📊 Fibonacci Retracement Levels (Swing: ₹173.55 to ₹483.90)
23.60% – ₹246.79
38.20% – ₹292.10 ✅ (Price nearing this level – short-term resistance)
50.00% – ₹328.70
61.80% – ₹365.35
78.60% – ₹417.50
100% – ₹483.90 🎯
📈 RSI Indicator (14)
RSI has surged to 77.17, indicating strong momentum but entering overbought territory.
RSI breakout with multiple prior bullish divergences validated the upside move.
📉 Volume
Current breakout supported by above-average volume (256.71K) adds credibility to the move.
🏁 Key Technical Levels
Neckline Breakout: ₹258.95 ✅
Immediate Resistance: ₹292.10 (Fib 38.2%)
Next Targets: ₹328.70 → ₹365.35
Support Levels: ₹258.95 → ₹246.79
Major Swing Low: ₹173.55
💡 Trade Setup
Entry: On breakout confirmation above ₹259
SL: Below ₹246
Short-term Target: ₹292
Mid-term Target: ₹328 → ₹365
Risk Level: Medium (due to RSI overbought – may see retracement)
⚠️ Disclaimer
This chart is for educational and analytical purposes only. Please consult your financial advisor before making investment decisions.
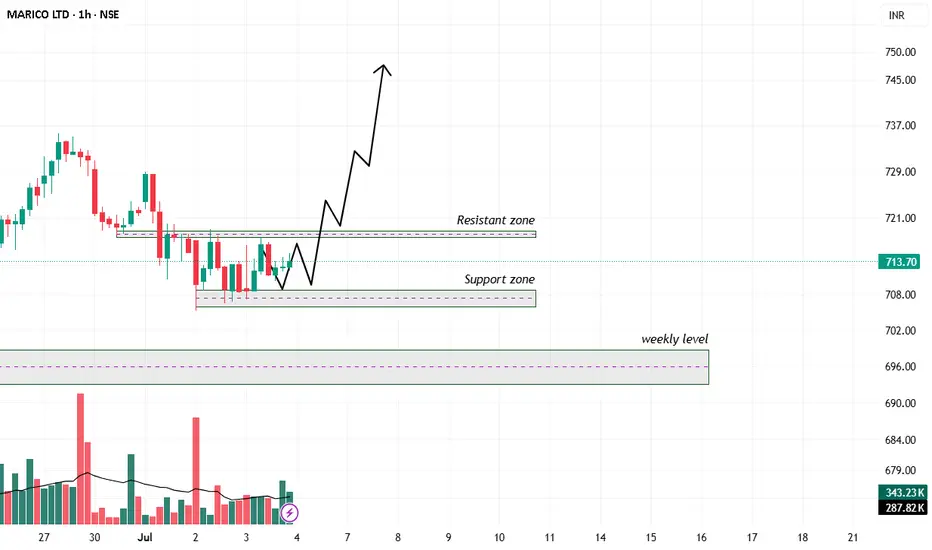
Technical Analysis: MERICO LTDTrend and Structure:
The chart shows a strong uptrend leading up to a recent pullback.
After the pullback, price is consolidating between a support zone (~708 INR) and a resistance zone (~720 INR).
There is a clear weekly support level marked around 690-695 INR below the support zone.
Volume is moderate but showing no large spikes, indicating potential consolidation.
Support and Resistance:
Immediate resistance zone is around 718-721 INR, acting as short-term overhead supply.
The support zone is roughly between 707-710 INR, serving as a base for potential bounce.
The weekly level below (roughly 690-695 INR) may act as a strong support if price breaks current support.
Price Projections:
The drawn projection suggests a short-term dip toward the support zone, followed by a strong bounce above the resistance.
This implies a possible bullish continuation after a minor correction or consolidation.
Volume:
Volume during consolidation is relatively steady.
Watch for volume pickup on a breakout above resistance for confirmation.
Trading plan:
Entry:
Consider entering a long position near or just above the support zone (~708-710 INR) when there is confirmation of buying interest (e.g., bullish reversal candlestick or volume spike).
Alternatively, a breakout entry can be taken above the resistance zone (~720-722 INR) with volume confirmation.
Stop Loss:
Place a stop loss below the support zone or slightly below the weekly level, around 700-705 INR to protect against downside risk.
Targets:
Initial target near the resistance breakout level (~720-725 INR).
Secondary target around 745-750 INR based on the upward arrow projection, representing the next resistance area.
Risk-Reward:
Risk: Approximately 8-10 INR per share.
Reward: Potential gain of 35-40 INR per share.
Favorable risk-reward ratio around 3:1 or better.
Additional Notes:
If the price falls below the support zone and weekly level with strong volume, consider exiting or avoiding long positions.
Look for confirmation signals before entry to reduce false breakouts or breakdowns.
Summary:
Table
Parameter Details
Entry Price ~708-710 INR (on support)
Stop Loss ~700-705 INR
Target 1 ~720-725 INR
Target 2 ~745-750 INR
Trend Pullback in uptrend
Risk-Reward Ratio ~3:1 or better
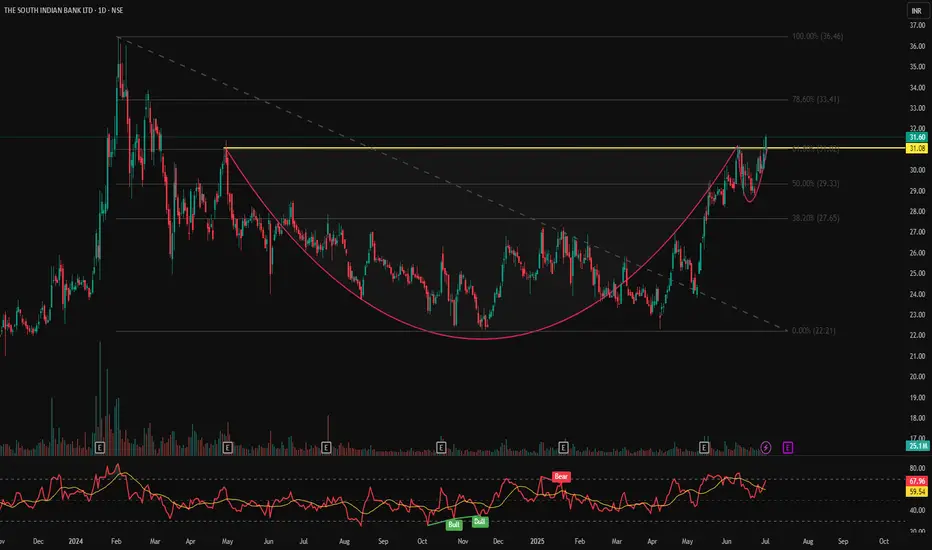
SOUTHBANK – Breakout From Cup & Handle | Daily Chart📊 SOUTHBANK – Breakout From Cup & Handle | RSI Bullish | High Volume | Fibonacci Levels | Daily Chart
📅 Chart Date: July 2, 2025
📍 CMP: ₹31.60 (+2.63%)
📈 Symbol: NSE:SOUTHBANK
🔍 Technical Breakdown
✅ Cup & Handle Breakout
A perfect cup & handle pattern breakout is visible
Price breaks out above the neckline at ₹31.08, which was a strong resistance zone
Breakout supported by rising volume (25.1M) adds conviction
📊 RSI Momentum
RSI (14) reading at 67.96 signals bullish strength, approaching overbought but not yet extreme
RSI crossover and previous bullish divergence helped initiate the move
📐 Fibonacci Retracement Levels (Swing: ₹22.21 to ₹36.46)
38.2% – ₹27.65
50.0% – ₹29.33
61.8% – ₹31.08 ✅ (Breakout zone)
78.6% – ₹33.41
100% – ₹36.46 🎯
🏁 Key Levels
Breakout Zone (Neckline): ₹31.08
CMP: ₹31.60
Resistance Levels: ₹33.41 → ₹36.46
Support Levels: ₹29.33 → ₹27.65
💡 Trade Idea
Entry: Above ₹31.10 on volume confirmation
SL: Below ₹29.30
Targets: ₹33.40 → ₹36.40+
Momentum + Breakout = High Conviction Setup
⚠️ Disclaimer
This analysis is for educational purposes only. Always do your own research and consult a registered advisor before investing.
Ambuja Cement Chart Analysis with Confirm Targets 2025 Cement Industry: A Strong Pillar of India’s Growing Economy
India remains the world’s second-largest cement producer as of 2025, and the pace of its growth continues to accelerate.
The demand for cement has surged due to infrastructure development projects such as housing construction, road expansion, railways, metro projects, and Smart Cities initiatives.
To boost infrastructure development, the Indian government has announced an interest-free assistance package of approximately ₹1.5 lakh crore.
Schemes like "Housing for All" and rural-urban housing programs have intensified construction activities across the country.
In this dynamic environment, the cement sector is receiving solid support and is expected to grow significantly in the coming years.
Ambuja Cement Company Profile
Ambuja Cements is one of India’s leading cement companies, established in 1983. It is now a part of the **Adani Group, a diversified and rapidly expanding conglomerate. The company primarily manufactures and sells grey cement and ready-mix concrete (RMC).
As the Smart City Mission, metro rail networks, expressways, flyovers, and industrial corridors progress rapidly, cement consumption continues to rise. Several large-scale cement road and railway infrastructure projects are underway across the country, expected to sustain the sector’s momentum over the next few years.
Ambuja Cement Technical Analysis
Major Resistance Zone: ₹590 – ₹700
₹590 acts as a strong resistance level, where the stock has previously faced multiple rejections.
A weekly candle closing above ₹590 would signal a strong bullish breakout.
Once this level is breached convincingly, the stock may **quickly move towards ₹700, testing its previous all-time high.
Trading Plan:
1.If the stock gives a weekly close above ₹590, it could be a buy signal.
2. The next potential target would be ₹700** based on the breakout confirmation.
Strong Demand Zone: ₹450 – ₹460
Significance of this zone:
1.The range of ₹450–₹460 has consistently shown bounce-back behavior, indicating strong buying interest.
2.Swing traders and investors** can consider accumulating when the stock nears this zone, as historical data shows this level has acted as **strong support**.
Stop-loss Strategy:
If any **weekly candle closes below ₹445, it could indicate a breakdown of support, and exiting the position would be advisable.
Support Zone Trading Plan
If the stock drops to ₹450–₹460 and **buying volume** increases, it could present a good buying opportunity.
Short-Term Potential Targets
First Target: ₹578
Second Target: ₹640
Manoj Strengthen Support – ₹413.50
The level of ₹413.50 is recognized on the chart as a strong psychological and emotional support, named “Manoj Strengthen Support.”
Why is this level important?
1. In case of a sudden market correction due to war, global recession, or political instability, this level may act as a temporary strong support.
2. It may prevent further decline and hold price levels in such events.
Investor Tip:
1. If the stock declines but this level holds, it becomes a **critical risk-management zone**.
2. Investors can look for potential **bounce-back** opportunities and strengthen their conviction around this level.
Ambuja Cement Long-Term Targets (2025–2028)
The long-term structure of Ambuja Cement appears bullish, and based on technical charts, the following major targets have been identified:
First Target: ₹700
Expected during 2025–26 if the stock gives a strong closing confirmation above ₹590.
Second Target: ₹840
If the stock decisively breaks above ₹700 (its all-time high), this target could be achievable in 2026.
Third Target: ₹1040
In the long term, if the stock sustains above ₹840, a move towards ₹1040 is likely by 2027–2028.
This analysis is based on technical breakouts, price action, and support-resistance principles, and can serve as a strategic guideline for long-term investors.

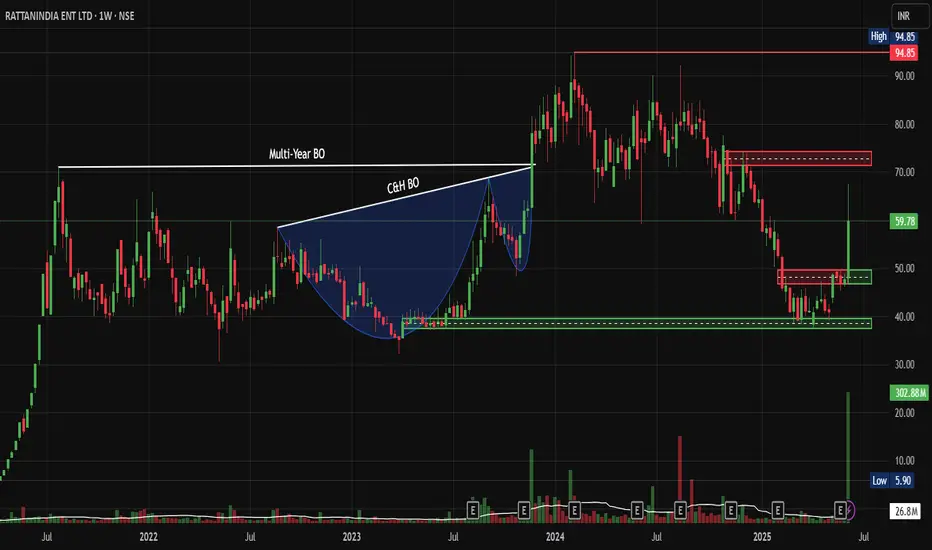
RattanIndia: Next New-Age Multi-Bagger Play ? Chart of the WeekWhy NSE:RTNINDIA Could Be Your Next Multi-Bagger Play, let's analyse my "Chart of the Week" Idea.
Price Action:
• Multiple base formations visible across the timeline from 2021-2025
• Classic cup and handle pattern formation during the 2023-2024 consolidation phase
• Rectangle consolidation pattern between ₹35-40 levels during Early 2025
• Strong breakout from multi-year resistance around the ₹75-80 zone
• Current pullback to retest breakout levels around the ₹47-50 range
Key Supports and Resistance Levels:
• Primary Support: ₹47-50 (previous resistance turned support)
• Secondary Support: ₹35-40 (rectangle pattern base)
• Major Support: ₹25-30 (long-term base level)
• Immediate Resistance: ₹65-70 (previous consolidation zone)
• Major Resistance: ₹75-80 (breakout level)
• Target Resistance: ₹94-95 (measured move projection)
Base Analysis:
• Stage 1 Base: ₹10-25 range from 2021-2022 (Accumulation phase)
• Stage 2 Base: ₹35-45 range during 2023-2024 (Re-accumulation)
• Current Base: ₹47-50 retest zone (Healthy pullback after breakout)
Volume Spread Analysis:
Volume Characteristics:
• Massive volume spike during recent breakout (300+ million shares)
• Above-average volume during consolidation phases
• Volume expansion on upward price movements
• Volume contraction during pullback phases indicates a healthy correction
• Volume profile shows strong institutional participation
Volume Patterns:
• Accumulation is visible during base formation periods
• Distribution avoided during recent highs
• Current pullback on lower volume suggests buying interest at support
Trade Setup:
Entry Strategy:
• Primary Entry: ₹48-50 (current support retest)
• Secondary Entry: ₹52-55 (breakout reconfirmation)
• Aggressive Entry: ₹45-47 (deeper pullback opportunity)
Exit Levels:
• Target 1: ₹65-70 (38% upside from ₹50)
• Target 2: ₹80-85 (65% upside from ₹50)
• Target 3: ₹95-100 (90% upside from ₹50)
Stop Loss Levels:
• Conservative: ₹42-43 (below rectangle support)
• Moderate: ₹45-46 (below recent lows)
• Tight: ₹47-48 (below immediate support)
Risk Management:
Position Sizing:
• Risk 1-2% of portfolio capital per trade
• Use a 2-3% position size for a conservative approach
• Maximum 5% allocation for aggressive traders
Risk-Reward Ratios:
• Entry at ₹50 with ₹45 stop: Risk-Reward of 1:3 to 1:9
• Entry at ₹52 with ₹47 stop: Risk-Reward of 1:2.6 to 1:8.6
Portfolio Allocation:
• Small-cap allocation: 10-15% maximum
• Individual stock limit: 2-5% of total portfolio
• Sector diversification recommended
Sectoral and Fundamental Backdrop:
Business Overview:
• NSE:RTNINDIA comprises of tech-focused new age businesses, including e-commerce, electric vehicles, and drones
• The company is completely focused on providing world-class electric mobility products that are affordable and accessible to every Indian
• Multi-business model spanning fintech, e-commerce, and drone technology
Sector Dynamics:
• The electric vehicle sector is experiencing government policy support
• The e-commerce segment is benefiting from the Digital India initiatives
• Drone technology is gaining traction in commercial applications
• Tech-focused businesses aligned with India's digital transformation
Financial Highlights:
• Market cap of RattanIndia Enterprises Ltd stood at Rs. 8,263 Cr
• RattanIndia Enterprises Ltd's net Sales rose by 22% since the same period last year to ₹ 6,866 Cr in the FY2025
• The company is in a growth investment phase with expanding business verticals.
Investment Thesis:
• Diversified exposure to high-growth sectors
• Potential beneficiary of India's transition to electric mobility
• Strong technical setup after multi-year base formation
• Early-stage company with significant scaling potential ahead
Risk Factors:
Technical Risks:
• Small-cap volatility and liquidity concerns
• Dependence on broader market sentiment
• Potential for gap-down moves in adverse conditions
Fundamental Risks:
• Current losses and cash burn in the growth phase
• Execution risk across multiple business verticals
• Competition in the electric vehicle and e-commerce segments
• Regulatory changes affecting drone and fintech operations
My Take:
This technical setup presents a compelling opportunity with the stock breaking out of a well-defined pattern, supported by decent enough fundamentals in the Growth Sectors of New Age Company and favourable sector dynamics. The risk-reward profile appears attractive for traders and investors willing to manage position size appropriately.
Keep in the Watchlist.
NO RECO. For Buy/Sell.
📌Thank you for exploring my idea! I hope you found it valuable.
🙏FOLLOW for more
👍BOOST if you found it useful.
✍️COMMENT below with your views.
Meanwhile, check out my other stock ideas on the right side until this trade is activated. I would love your feedback.
Disclaimer: "I am not a SEBI REGISTERED RESEARCH ANALYST AND INVESTMENT ADVISER."
This analysis is intended solely for informational and educational purposes and should not be interpreted as financial advice. It is advisable to consult a qualified financial advisor or conduct thorough research before making investment decisions.
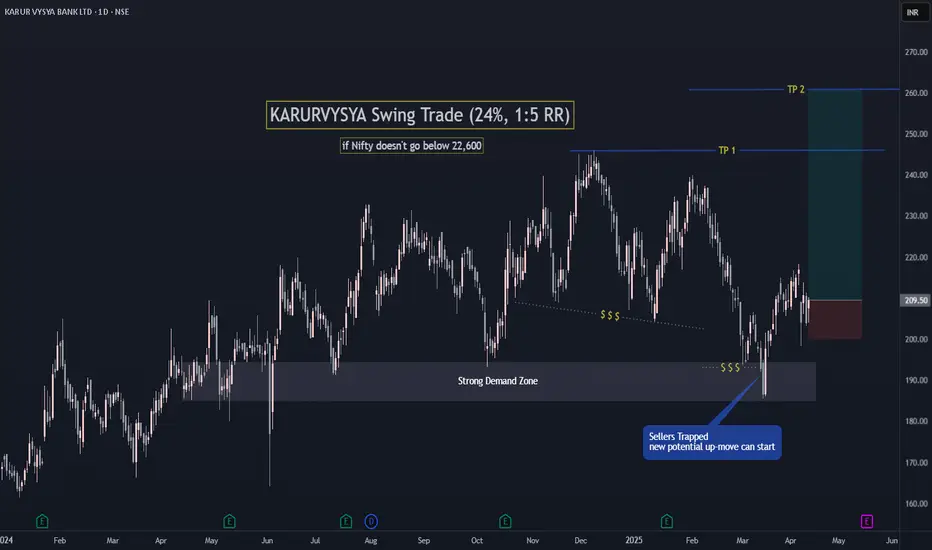
KARURVYSYA Swing Trade (24% potential, with 1:5 RR)Pretty much everything self explanatory in chart.
A very good potential trade if Nifty holds it current level ie 22,700.
Also a very good fundamental stock.
Follow for such good setups.
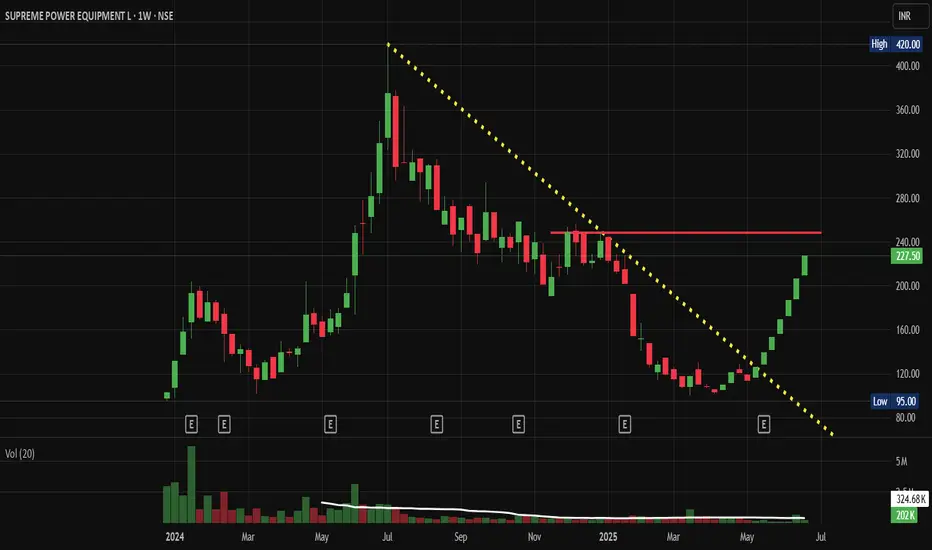
Supreme Power Equipment: Technically Strong, Chart of the MonthNSE:SUPREMEPWR Technically Strong Momentum is my pick in this month's "Chart of the Month"
Price Action Analsis:
- Stock currently trading at ₹227.50, up 21.35 (+10.36%), showing strong bullish momentum
- Recent breakout from a prolonged Correction phase that lasted from July 2024 to May 2025
- Price has successfully cleared multiple resistance levels and is now approaching previous highs
- Strong recovery from the March 2025 lows around ₹95-100 levels
Volume Spread Analysis:
- Current volume at 324.68K shares, significantly higher than the 20-day average
- Volume spike during the recent breakout confirms institutional participation
- Volume pattern shows accumulation during the consolidation phase
- Strong volume support during the current upward move validates the breakout
Key Technical Levels:
Support Levels:
- Immediate support: ₹210-215 (recent breakout level)
- Secondary support: ₹190-195 (previous resistance turned support)
- Major support: ₹160-170 (consolidation zone)
- Critical support: ₹120-130 (long-term moving average zone)
Resistance Levels:
- Immediate resistance: ₹240-250 (previous high zone)
- Major resistance: ₹280-290 (historical resistance)
- Ultimate target: ₹350-370 (measured move from base)
Base Formation:
- Clear accumulation base formed between ₹120-250 from July 2024 to May 2025
- Base depth of approximately 130 points provides a strong foundation
- Base duration of 10+ months indicates strong institutional accumulation
- Recent breakout from this base suggests potential for significant upward move
Technical Patterns:
- The cup and Handle pattern formation is visible on the monthly timeframe
- The ascending triangle breakout pattern recently completed
- Moving average convergence suggesting trend reversal
- RSI is likely showing bullish divergence from the March lows
Trade Setup:
Entry Strategy:
- Primary entry: ₹225-230 on any pullback to the breakout level
- Aggressive entry: Current market price ₹227.50 for momentum traders
- Conservative entry: Wait for retest of ₹210-215 support zone
- Scale-in approach: 50% at current levels, 50% on any dip to ₹215
Exit Levels:
- Target 1: ₹280 (24% upside) - Previous resistance zone
- Target 2: ₹320 (41% upside) - Measured move target
- Target 3: ₹370 (63% upside) - Ultimate breakout target
- Trailing stop: Use a 10% trailing stop once Target 1 is achieved
Stop-Loss:
- Initial stop-loss: ₹195 (14% downside risk)
- Breakeven stop: Move to ₹230 once price reaches ₹260
- Trailing stop: 8-10% below recent swing high
Position Sizing:
- Conservative investors: 2-3% of portfolio
- Moderate risk tolerance: 3-5% of portfolio
- Aggressive traders: 5-7% of portfolio (with tight stops)
- Maximum exposure: Not more than 7% given single stock concentration risk
Risk Management:
- Risk-reward ratio: 1:2 minimum for all positions
- Never risk more than 2% of the total portfolio on this single trade
- Use position sizing calculators to determine the exact share quantity
- Consider partial profit booking at each target level
- Monitor sector rotation and overall market conditions
Sectoral Backdrop:
Power Equipment Sector Overview:
- India's power sector is undergoing a massive transformation with a renewable energy push
- The government's target of 500 GW of renewable capacity by 2030 is driving equipment demand
- Infrastructure spending and rural electrification programs supporting sector growth
- PLI scheme for manufacturing provides additional tailwinds
Sector Challenges:
- Raw material cost inflation is impacting margins
- Supply chain disruptions affecting delivery timelines
- Intense competition from Chinese manufacturers
- Regulatory changes and policy uncertainties
Sector Opportunities:
- Make in India initiative favours domestic manufacturers
- Rising power demand from industrial and commercial sectors
- Smart grid implementation creating new revenue streams
- Export opportunities in emerging markets
Fundamental Backdrop:
Company Strengths:
- Established player in power transmission and distribution equipment
- Strong order book providing revenue visibility
- Diversified product portfolio, reducing concentration risk
- Experienced management team with industry expertise
Financial Health:
- Need to verify recent quarterly results for revenue and profit trends
- Debt levels and interest coverage ratios require monitoring
- Cash flow generation capability is important for sustained growth
- Return on equity and asset turnover metrics need evaluation
Growth Catalysts:
- Government infrastructure spending on the power sector
- Rural electrification and grid modernization projects
- Renewable energy integration requires specialized equipment
- Potential for export market expansion
Risk Factors:
- Dependence on government orders and policy changes
- Working capital-intensive business model
- Competition from larger players and imports
- Raw material price volatility affecting margins
My Take:
NSE:SUPREMEPWR exhibits a strong technical setup, characterised by a clear breakout from a well-formed base. The combination of volume confirmation, sector tailwinds, and government policy support creates a favourable risk-reward scenario. However, traders should maintain disciplined risk management and avoid overexposure to this single position.
Honourable Mentions:
Other stocks that have a good Setup
NSE:KIRLOSBROS , NSE:CGCL , NSE:SUNDRMFAST
Keep in the Watchlist.
NO RECO. For Buy/Sell.
📌Thank you for exploring my idea! I hope you found it valuable.
🙏FOLLOW for more
👍BOOST if you found it useful.
✍️COMMENT below with your views.
Meanwhile, check out my other stock ideas on the right side until this trade is activated. I would love your feedback.
Disclaimer: "I am not a SEBI REGISTERED RESEARCH ANALYST AND INVESTMENT ADVISER."
This analysis is intended solely for informational and educational purposes and should not be interpreted as financial advice. It is advisable to consult a qualified financial advisor or conduct thorough research before making investment decisions.
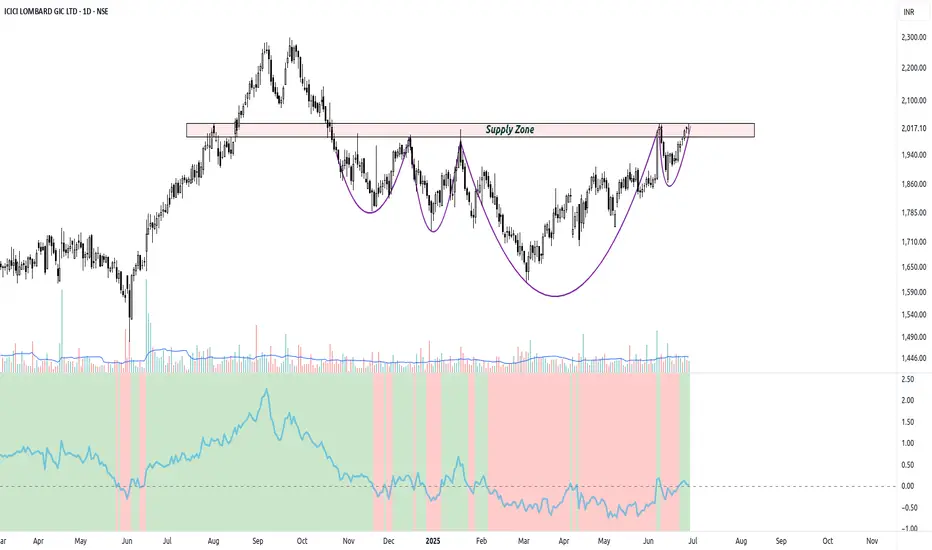
ICICIGITechnical Analysis Breakdown:
1. Rounded Bottom + Multi-stage Base Formation
The stock has carved out a long rounded bottom, forming three notable cup-like bases over the past year.
Each time the price pulled back, it found support near key demand zones (highlighted in blue), forming higher lows — a sign of accumulation.
The current price action shows a smooth rounding structure that suggests growing buyer interest and waning seller pressure.
2. Supply Zone Test in Progress
Price is now approaching a strong supply zone (~₹2,030–2,050), where it has previously faced rejection multiple times.
The presence of long wicks in this zone in the past signals institutional selling pressure.
Watch for a decisive breakout with strong volume to confirm that supply has been absorbed.
3. Relative Strength Turning Up
The RS line vs Nifty has moved into positive territory after several months of underperformance.
This shift is crucial — especially if confirmed on the weekly chart — it implies sector rotation or renewed leadership from ICICIGI.
4. Moving Averages in Bullish Alignment
The stock is now trading above all key moving averages (20, 50, 100, 200 EMA), all of which are curling upwards.
This signals a strong trend resumption, especially as the 200 EMA acts as long-term support.
The breakout above the 200 EMA (around ₹1,940) was a major structural shift.
5. Volume and VCP Context
Recent price action shows tighter price ranges with reduced volatility near resistance, a characteristic of Volatility Contraction Pattern (VCP).
Volume has remained subdued but consistently stable, which is constructive as long as it expands on breakout attempts.
Interpretation & Trade Strategy
✅ Bullish Scenario:
A strong breakout above ₹2,050 with above-average volume can lead to a fresh rally, possibly retesting the previous all-time high zone (₹2,250+).
Follow-up candle should ideally close strong with range expansion.
⚠️ Risk Management:
Any rejection around ₹2,030–2,050 accompanied by high volume selling could lead to another correction within the base.
Traders should be cautious of false breakouts and manage entries based on volume confirmation or wait for a pullback entry near ₹1,970–1,990 if risk/reward improves.
📝 Conclusion
ICICIGI is showing classic signs of long-term accumulation, emerging strength, and trend reversal.
With the supply zone being tested now, the stock is at a critical inflection point. If buyers can overcome this hurdle with conviction, ICICIGI may rejoin the list of strong performers in the insurance space.
📌 Watch for:
Volume confirmation on breakout
Retest and hold of the ₹2,000–2,020 zone
RS staying above zero
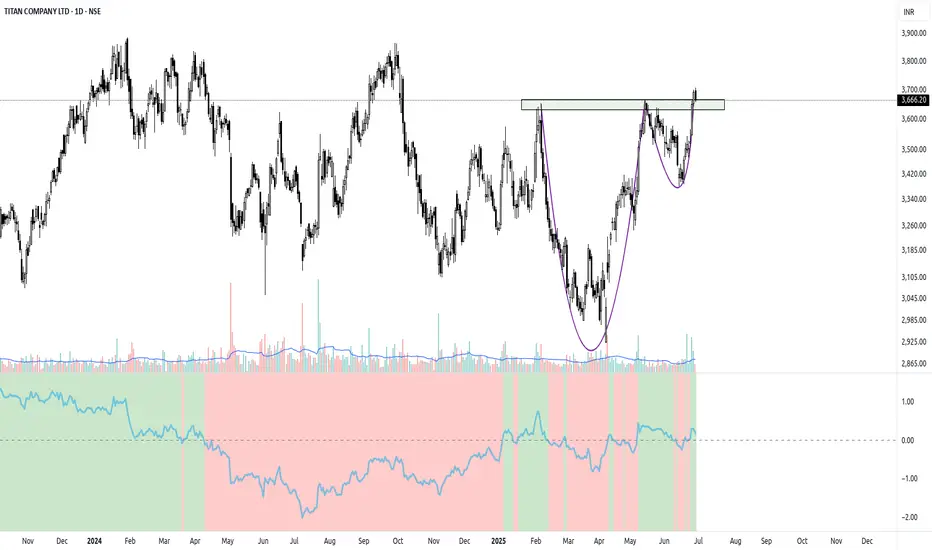
TITAN – Preparing for the Next Move?🔍 Technical Structure:
1. Base Formation & Breakout
Titan was consolidating in a well-defined sideways range between ~₹3,400 and ₹3,670 for the last four months.
A clean breakout above the range occurred recently, marking a bullish change of character.
The breakout was accompanied by above-average volume, suggesting institutional activity.
2. Retest in Progress
After the breakout, price is pulling back to retest the breakout zone (~₹3,640–₹3,670).
This retest is healthy as long as it stays above previous resistance. If it dips too far below ₹3,640 and sustains, it may invalidate the breakout (a.k.a. false breakout).
3. Volatility Contraction Pattern (VCP)
Leading up to the breakout, Titan displayed progressively tighter price contractions.
This Volatility Contraction Pattern is a classic setup where price compresses before expanding explosively.
If the stock consolidates for a few more sessions with lower volatility and tight ranges near support, it could form a final contraction leg, potentially followed by a strong breakout.
4. Relative Strength
The Relative Strength (RS) line vs Nifty has turned positive on the weekly chart – an early sign that Titan may start outperforming the index again.
On the daily, RS has been rising steadily since early June, aligning with bullish price structure.
5. Moving Averages Alignment
The stock is currently trading above all major moving averages (20, 50, 100, 200 EMA), which are now in a bullish alignment.
The 200 EMA acted as dynamic support in the earlier stages of the base.
📈 Trading Plan & Bias
Bullish Bias (if base retest holds):
A successful retest of the breakout zone (around ₹3,640–₹3,670) with a bounce on volume could trigger the next leg higher.
Potential target zones: previous swing highs and psychological levels (₹3,800+, possibly ₹4,000 over time).
Invalidation / Risk:
A breakdown back into the range and sustained trade below ₹3,600 could imply a false breakout.
Wait for a decisive reclaim in that case.
Conclusion
Titan looks technically strong after breaking out from a multi-month range.
While the current pullback might look like weakness on the surface, this could be a textbook retest or a final contraction before a strong upside move.
Keep this stock on your radar for:
Bounce confirmation near support
Breakout from a tighter VCP
Volume-led upmove resumption
Edelweiss - Double Bottom Reversal PatternNSE:EDELWEISS Made Beautiful Chart Structure today Before Q4 Results with Good Price and Volume action.
Today's Price Action:
- The stock has been in a clear downtrend since December 2024, forming a descending resistance line (white trendline)
- Recently broke above this major downtrend line with strong momentum
- Current price at ₹86.44, up 5.50 points (+6.80%) in today's session
- The stock appears to have formed a Double bottom Pattern around the ₹75 levels, confirming a potential reversal
Volume Analysis:
- Volume spike visible in today's session (13.85M shares traded)
- The previous volume averaged around 5.6M shares
- This high-volume breakout suggests strong buying conviction
- Volume confirms the price movement, adding credibility to the breakout
Key Supports and Resistances:
- Strong resistance zone at ₹87-90 (previous consolidation area marked by red horizontal line)
- Key support established at ₹75-77 (green horizontal line)
- Previous support at ₹86-87 may now act as resistance that needs to be cleared decisively
Trade Setup:
Entry Points:
1. Aggressive Entry: Current level (₹86.44) with partial position size
2. Conservative Entry: On breakout confirmation above ₹90 with closing price
3. Pullback Entry: If price retraces to the ₹82-83 range (previous breakout level)
Exit Strategy:
- Target 1: ₹95 (first resistance level)
- Target 2: ₹105 (previous support turned resistance)
- Target 3: ₹115-120 (major resistance zone from January-February 2025)
- Trailing Stop: Consider implementing a 5% trailing stop after achieving Target 1
Stop Loss Placement:
- Aggressive Stop: Below today's low (approximately ₹82)
- Conservative Stop: Below the green support line at ₹75
- Double Bottom Pattern-Based Stop: Below ₹73
Risk Management:
- Position sizing: Limit to 1-2% risk of total capital per trade
- Risk-reward ratio: Minimum 1:1 for aggressive entry, 1:1.5 for conservative entry
- Consider scaling out of position at each target level (e.g., 33% at each target)
The improved price action comes after several months of decline, with the potential Double Bottom pattern suggesting a possible trend reversal if completed successfully.
Keep in the Watchlist.
NO RECO. For Buy/Sell.
📌Thank you for exploring my idea! I hope you found it valuable.
🙏FLLOW for more
👍BOOST if useful
✍️COMMENT below with your views.
Meanwhile, check out my other stock ideas on the right side until this trade is activated. I would love your feedback.
Disclaimer: "I am not SEBI REGISTERED RESEARCH ANALYST AND INVESTMENT ADVISER."
This analysis is intended solely for informational and educational purposes and should not be interpreted as financial advice. It is advisable to consult a qualified financial advisor or conduct thorough research before making investment decisions.

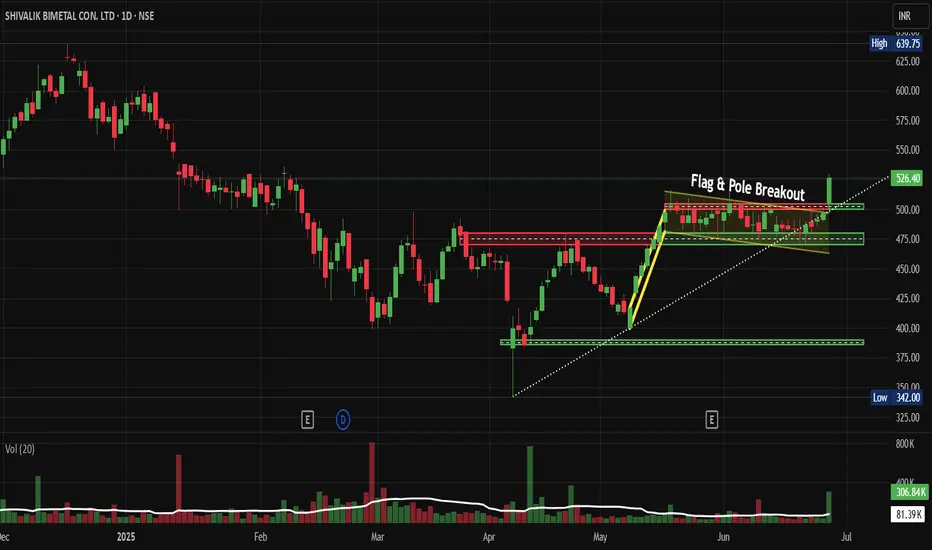
Shivalik Bimetal Controls Breaks Out Flag & Pole Pattern NSE:SBCL Breaks Out: Flag Pattern Signals Bullish Momentum in Speciality Metals Space
Price Action Analysis:
- Current Price: ₹526.40 (as of June 26, 2025)
- Daily Gain: +29.05 (+5.84%)
- 52-Week High: ₹639.75
- 52-Week Low: ₹342.00
- Trading Volume: 306.84K (compared to 20-day average of 81.39K)
Volume Spread Analysis:
- Breakout Volume: 306.84K (nearly 4x the 20-day average)
- Volume Confirmation: Strong volume surge supports genuine breakout
- Volume Pattern: Declining volume during flag formation, followed by expansion on breakout
Base Formation:
- Consolidation Base: Formed between April-May 2025 around ₹400-450 levels
- Duration: Approximately 6-8 weeks of sideways movement
- Characteristics: Healthy consolidation after initial rally from ₹375 lows
Chart Pattern Analysis:
- Primary Pattern: Bull Flag & Pole Breakout
- Flag Formation: Formed between May and June 2025 in the ₹475-500 range
- Pole Height: Approximately ₹125 (from ₹375 to ₹500)
- Breakout Confirmation: Stock broke above ₹500 resistance with strong volume
- Target Projection: ₹625-650 based on flag pole measurement
Key Technical Levels:
Support Levels:
- Immediate Support: ₹500 (previous resistance turned support)
- Secondary Support: ₹475 (flag pattern lower boundary)
- Major Support: ₹400 (psychological level and previous consolidation zone)
Resistance Levels:
- Immediate Resistance: ₹550-560 (short-term target)
- Major Resistance: ₹625-650 (flag pattern target)
- All-Time High: ₹639.75 (to be watched closely)
Trade Setup Analysis:
Long Position Setup:
- Entry Strategy: Breakout above ₹500 with volume confirmation
- Risk-Reward Ratio: 1:3 (favourable setup)
- Time Horizon: 3-6 months for target achievement
- Pattern Reliability: High (bull flag patterns have 70%+ success rate)
Entry Levels:
- Aggressive Entry: ₹526-530 (current market price)
- Conservative Entry: ₹510-515 (on pullback to breakout level)
- Accumulation Zone: ₹500-520 (for larger positions)
Exit Levels:
- Target 1: ₹580-590 (intermediate target - 15% upside)
- Target 2: ₹625-640 (pattern target - 22-25% upside)
- Final Target: ₹650-670 (extended target based on momentum)
Stop-Loss Strategy:
- Initial Stop-Loss: ₹475 (below flag pattern support)
- Trailing Stop: Implement an 8-10% trailing stop after 15% gains
- Conservative Stop: ₹490 (closer stop for risk-averse traders)
Position Sizing Recommendations:
- Conservative Allocation: 2-3% of portfolio
- Moderate Allocation: 4-5% of portfolio
- Aggressive Allocation: 6-8% of portfolio (for high-risk tolerance)
Risk Management Framework:
Risk Assessment:
- Pattern Risk: 25-30% (typical bull flag failure rate)
- Market Risk: Consider broader market conditions
- Sector Risk: Speciality metals and electronics component sector exposure
- Liquidity Risk: Moderate (average daily volume of 81.39K)
Risk Mitigation Strategies:
- Diversification across multiple positions
- Gradual position building rather than lump sum entry
- Regular monitoring of volume and price action
- Adherence to predetermined stop-loss levels
- Profit booking at intermediate targets
Money Management Rules:
- Maximum loss per trade: 2-3% of portfolio
- Position sizing based on stop-loss distance
- Avoid averaging down on losing positions
- Scale out profits at predetermined levels
Fundamental Backdrop:
Company Overview:
- Business Focus: Manufacturing and sales of Thermostatic Bimetal/Trimetal strips, Current Sense Metal Strip Shunts/Resistors, and electron beam welded products
- Operating Since: Commercial production since October 1986
- Headquarters: New Delhi, India
Financial Performance:
- Market Capitalization: ₹3,027 crores
- Annual Revenue: ₹508.35 crores (TTM)
- Pre-tax Margin: 20% (considered great)
- Return on Equity: 20.6% (exceptional performance)
- Debt-to-Equity: 0.08 (healthy balance sheet)
Recent Quarterly Results:
- Q4 FY2025 Revenue: ₹132 crores
- Q4 FY2025 Net Profit: ₹21 crores
- Q3 FY2025 Net Profit Growth: 7.55% YoY to ₹18 crores
Promoter Holding Concerns:
- Current Promoter Holding: 33.18% (considered low)
- 3-Year Trend: Decreased by 27.4% over the last 3 years
Sectoral Analysis:
Industry Positioning:
- Sector: Speciality Metals and Electronic Components
- Niche Market: Thermostatic bimetal strips for temperature control applications
- End Markets: Electronics, automotive, appliances, and industrial equipment
- Market Position: Established player with specialized manufacturing capabilities
Sector Outlook:
- Growing demand for temperature control solutions in electronics
- Increasing automation in the automotive and industrial sectors
- Focus on energy efficiency, driving demand for precision components
- Import substitution opportunities in specialised metal products
Competitive Advantages:
- Financial Stability: Appears financially stable compared to competitors
- Specialized manufacturing expertise in electron beam welding
- Established customer relationships since 1986
- Low debt levels provide financial flexibility
Technical Indicators Summary:
Momentum Indicators:
- RSI: In overbought territory post-breakout (monitor for divergence)
- MACD: Bullish crossover expected on breakout
- Volume: Strong confirmation of breakout validity
Trend Indicators:
- Moving Averages: Stock trading above key moving averages
- Trend Direction: Bullish short to medium term
- Support Levels: Well-defined support structure
Risk Indicators:
- Volatility: Moderate to high given recent breakout
- Liquidity: Adequate for position sizes recommended
- Market Correlation: Monitor broader market trends
My Take:
The technical setup for NSE:SBCL presents a compelling bull flag breakout opportunity with strong volume confirmation. The pattern projects targets of ₹625-650, representing potential upside of 22-25% from current levels. However, the declining promoter holding and moderate liquidity require careful position sizing and risk management.
Recommended approach is to enter on any pullback to ₹510-515 levels with a stop-loss at ₹475, targeting ₹580-590 for the first leg of the move. The company's strong financial metrics and niche market positioning support the technical breakout, making this an attractive medium-term opportunity for technically oriented investors.
Keep in the Watchlist.
NO RECO. For Buy/Sell.
📌Thank you for exploring my idea! I hope you found it valuable.
🙏FOLLOW for more
👍BOOST if you found it useful.
✍️COMMENT below with your views.
Meanwhile, check out my other stock ideas on the right side until this trade is activated. I would love your feedback.
Disclaimer: "I am not a SEBI REGISTERED RESEARCH ANALYST AND INVESTMENT ADVISER."
This analysis is intended solely for informational and educational purposes and should not be interpreted as financial advice. It is advisable to consult a qualified financial advisor or conduct thorough research before making investment decisions.
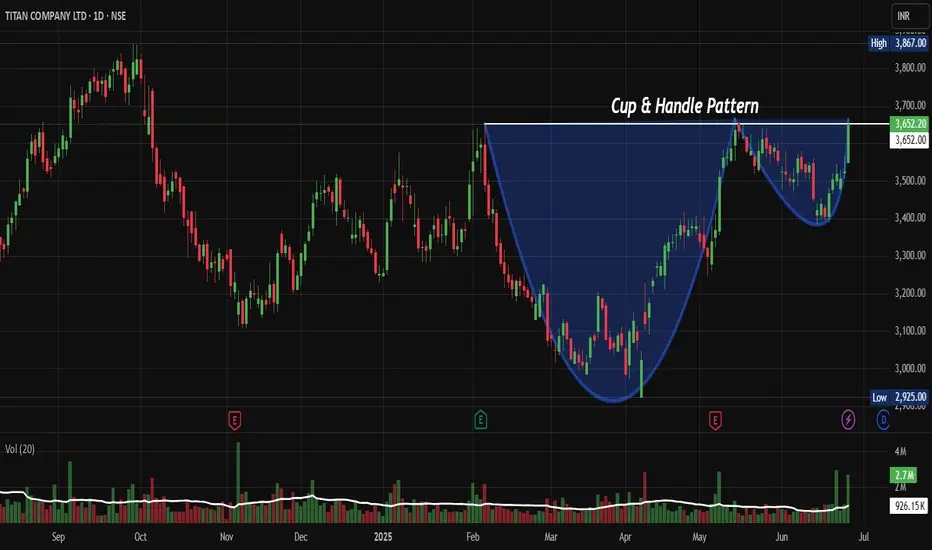
Titan: Cup & Handle Pattern Signals Major Uptrend ContinuationNSE:TITAN Cup & Handle Pattern Signals Major Uptrend Continuation after Macquarie sees Q1 growth on jewellery demand
Price Action Analysis:
• Stock has formed a classic Cup & Handle pattern over an 8-month period from February 2025 to June 2025
• Cup formation shows a rounded bottom with depth of approximately 800 points (3,700 to 2,900 levels)
• Handle formation displays controlled consolidation with lower volatility, indicating institutional accumulation
• Price action demonstrates strong momentum with a 3.58% daily gain and healthy volume expansion
Volume Spread Analysis:
• Volume pattern confirms the Cup & Handle formation with classic volume characteristics
• During cup formation, volume contracted during the decline and expanded during recovery
• Handle formation shows diminishing volume, indicating reduced selling pressure
• Recent breakout accompanied by significant volume spike (2.7M vs average), confirming institutional participation
• Volume-price correlation remains positive, supporting the bullish breakout thesis
Key Technical Levels:
Support Levels:
• Primary Support: 3,500
• Secondary Support: 3,400
• Major Support: 3,200
Resistance Levels:
• Immediate Resistance: 3,700 (Previous highs and psychological level)
• Major Resistance: 3,867 (52 Week high marked on chart)
• Extended Target: 4,200 (Cup & Handle measured move target)
Technical Patterns Identified:
• Cup & Handle Pattern: Primary bullish continuation pattern spanning 5 months
• Ascending Triangle: Within the handle formation, showing higher lows
• Volume Accumulation Pattern: Consistent with institutional buying during consolidation phases
Trade Setup:
Entry Strategy:
• Primary Entry: 3,650-3,680 (Current levels on any minor pullback)
• Secondary Entry: 3,580-3,620
• Aggressive Entry: Market price for momentum traders
Exit Levels:
• Target 1: 3,800 (Near-term resistance, book 30% profits)
• Target 2: 3,950 (Previous highs breach, book 40% profits)
• Target 3: 4,200 (Cup & Handle measured move, remaining 30%)
Risk Management:
• Stop Loss: 3,480 (Below handle low with 5% buffer)
• Risk-Reward Ratio: 1:3 (Risk of 170 points vs reward of 500+ points to first major target)
• Maximum Risk per Trade: 2% of portfolio capital
Position Sizing:
• Conservative Approach: 1-1.5% of portfolio given the strong setup
• Moderate Approach: 2-2.5% for traders comfortable with mid-cap volatility
• Scale-in Strategy: 50% on initial entry, 30% on any dip to secondary entry, 20% on momentum confirmation
Sectoral and Fundamental Backdrop:
Sector Analysis:
• Consumer Discretionary sector showing resilience amid economic recovery
• Jewellery and watches segment benefiting from the wedding season demand and festival purchases
• Luxury consumption trends supporting the premium positioning of Titan's brands
• Rural demand recovery provides an additional growth catalyst for the company
Fundamental Highlights:
• Strong brand portfolio including Tanishq, Titan, Fastrack, and Sonata
• Consistent market share gains in the organised jewellery retail segment
• Digital transformation initiatives are improving operational efficiency
• Expansion in tier-2 and tier-3 cities driving geographical diversification
Macroeconomic Factors:
• Favourable gold price trends supporting jewellery business margins
• Rising disposable income in Indian households is boosting luxury spending
• The government's focus on organized retail supporting compliant players like Titan
• Wedding season and festival demand provide seasonal tailwinds
Key Risks to Monitor:
• Gold price volatility is impacting raw material costs and consumer demand
• Competition from online jewellery platforms and regional players
• Economic slowdown potentially affecting discretionary spending
• Regulatory changes in gold import duties or GST rates
My Take:
This technical setup presents a compelling risk-reward opportunity with the Cup & Handle pattern completion, strong volume confirmation, and favourable sectoral backdrop supporting the bullish thesis for Titan Company.
Keep in the Watchlist.
NO RECO. For Buy/Sell.
📌Thank you for exploring my idea! I hope you found it valuable.
🙏FOLLOW for more
👍BOOST if you found it useful.
✍️COMMENT below with your views.
Meanwhile, check out my other stock ideas on the right side until this trade is activated. I would love your feedback.
Disclaimer: "I am not a SEBI REGISTERED RESEARCH ANALYST AND INVESTMENT ADVISER."
This analysis is intended solely for informational and educational purposes and should not be interpreted as financial advice. It is advisable to consult a qualified financial advisor or conduct thorough research before making investment decisions.
Indian Metals & Ferro Alloy: Flag & Pole BONSE:IMFA Breaks out of the Flag & Pole Pattern with Huge Volumes today.
Price Action Analysis:
- Stock experienced a significant decline from highs around 998.80 to lows near 549.80, representing approximately a 45% correction
- Recent breakout above 720 levels shows strong momentum reversal
- Current price at 772.50 (+ 7.77%) indicates bullish sentiment returning
- Higher highs and higher lows pattern emerging on the right side of the chart
Volume Spread Analysis:
- Volume spike coinciding with recent breakout confirms genuine buying interest
- Volume of 202.22K appears elevated compared to previous months
- Green volume bars during the recent rally suggest an accumulation phase
- Low volume during the consolidation phase indicates smart money positioning
Key Technical Levels:
Support Levels
- Primary Support: 720-730 (recent breakout zone)
- Secondary Support: 680-690 (previous resistance turned support)
- Major Support: 600-620 (previous consolidation zone)
Resistance Levels:
- Immediate Resistance: 800-820
- Major Resistance: 880-900
- Long-term Resistance: 950-998 (previous highs)
Base Formation:
- Cup and Handle pattern visible with base formation between 550-680 levels
- Duration of base: Approximately 4-5 months (February to June 2025)
- Handle formation in the May-June period before the breakout
- Flag & Pole Pattern Broke today
Technical Patterns Identified:
Primary Pattern: Cup and Handle
- Well-defined cup formation with rounded bottom
- Handle shows controlled pullback with lower volume
- Breakout above handle resistance confirms pattern completion
- Target projection: 950+ levels based on pattern height
Secondary Patterns:
- Descending trendline resistance tested today
- Double bottom formation around 550-580 levels
- Bullish flag formation post-breakout
Trade Setup Recommendations:
Entry Strategy:
- Aggressive Entry: Current levels 770-775 on any minor dip
- Conservative Entry: 720-730 on pullback to breakout zone
- Momentum Entry: Above 800 for trend continuation
Exit Strategy:
- Target 1: 850 (10% upside from current levels)
- Target 2: 920 (19% upside potential)
- Target 3: 980 (27% upside to retest previous highs)
Stop-Loss Levels:
- For aggressive entries: 720 (7% risk)
- For conservative entries: 680 (6% risk from 720 entry)
- Trailing stop: 8-10% below recent swing lows
Risk Management Framework:
Position Sizing:
- Risk per trade: Maximum 2% of portfolio
- Position size calculation: Portfolio value × 2% ÷ stop-loss distance
- For ₹1 lakh portfolio with 7% stop: ₹2,000 ÷ 0.07 = ₹28,571 position size
Risk Controls:
- Maximum exposure to single stock: 5% of portfolio
- Sector concentration limit: 15% in the metals sector
- Use of position sizing calculator mandatory
- Weekly portfolio review and rebalancing
Sectoral Backdrop Analysis:
Metals Sector Dynamics:
- Global steel demand recovery supporting Indian metal stocks
- Infrastructure spending by the government boosts domestic demand
- Raw material cost stabilization improves margins
- Export opportunities are increasing with global supply chain shifts
Industry Tailwinds:
- The government's focus on infrastructure development
- PLI schemes supporting the manufacturing sector
- Green energy transition requiring metal inputs
- Automotive sector recovery driving steel demand
Fundamental Considerations:
Company Specific Factors:
- Debt reduction initiatives improving balance sheet strength
- Capacity expansion plans supporting long-term growth
- Technology upgrades enhancing operational efficiency
- ESG compliance improving institutional investor interest
Macroeconomic Factors:
- Rupee stability supporting import-dependent operations
- Interest rate environment favourable for the capital-intensive sector
- Government policy support for domestic manufacturing
- Global commodity cycle showing signs of recovery
Trading Psychology Notes:
Behavioural Considerations:
- Stock showing classic accumulation after major decline
- Institutional buying is likely during the base formation period
- Retail sentiment improving with breakout confirmation
- FOMO factor may drive further momentum
Market Sentiment Indicators:
- Relative strength improving against the broader market
- Sector rotation favours cyclical stocks
- Technical breakout attracting momentum traders
- Long-term investors find value after the correction
My take:
This technical setup presents a compelling risk-reward opportunity with clearly defined entry, exit, and risk management parameters. The combination of a strong technical breakout and improving sectoral fundamentals creates a favourable environment for potential gains.
Keep in the Watchlist.
NO RECO. For Buy/Sell.
📌Thank you for exploring my idea! I hope you found it valuable.
🙏FOLLOW for more
👍BOOST if you found it useful.
✍️COMMENT below with your views.
Meanwhile, check out my other stock ideas on the right side until this trade is activated. I would love your feedback.
Disclaimer: "I am not a SEBI REGISTERED RESEARCH ANALYST AND INVESTMENT ADVISER."
This analysis is intended solely for informational and educational purposes and should not be interpreted as financial advice. It is advisable to consult a qualified financial advisor or conduct thorough research before making investment decisions.

Midhani: Breaks Out of Consolidation: Ready for Lift-Off ?NSE:MIDHANI Breaks Out of Consolidation: A Technical Powerhouse Ready for Lift-Off ?
Price Action Analysis:
- Current Price: ₹463.60 (as of June 23, 2025)
- Price Movement: +20.30 points (+4.58%) on the day
- The stock has demonstrated a spectacular breakout from a lengthy consolidation phase
- Sharp vertical surge from ₹340 levels to current highs of ₹463.60
- Strong momentum evident with substantial volume expansion
Volume Spread Analysis:
- Current Volume: 6.03M shares (significantly elevated)
- Average Volume: 2.36M shares
- Volume surge of approximately 155% above average indicates strong institutional participation
- Volume spike during breakout confirms genuine buying interest
- The previous consolidation period showed declining volume, typical of accumulation phases
Key Technical Levels:
Base Formation:
- Primary Base: ₹220-₹340 range (March 2025 to May 2025)
- Base Duration: Approximately 3 months
- Base Type: Cup and Handle pattern with rectangular consolidation
- Base Depth: From ₹463 high to ₹220 low (52.5% correction)
- Quality: High-quality base with proper volume characteristics
Support Levels:
- Immediate Support: ₹420-₹440 (previous resistance turned support)
- Secondary Support: ₹380-₹400 (50% retracement of recent move)
- Major Support: ₹340-₹360 (breakout point and upper base boundary)
- Ultimate Support: ₹280-₹300 (middle of base formation)
Resistance Levels:
- Immediate Resistance: ₹480-₹500 (psychological round numbers)
- Next Resistance: ₹520-₹540 (measured move from base)
- Major Resistance: ₹580-₹600 (long-term projection target)
Technical Patterns Identified:
Primary Pattern:
- Cup and Handle Formation: Completed with successful breakout
- Handle Formation: Tight consolidation between ₹320-₹340 levels
- Breakout Volume: Exceptional with 155% above average volume
Secondary Patterns:
- Ascending Triangle: Formed during the handle phase
- Flag Pattern: Brief consolidation after initial breakout surge
- Higher Lows: Consistent pattern throughout base formation
Trend Analysis:
- Primary Trend: Strongly Bullish (breakout confirmed)
- Intermediate Trend: Bullish momentum accelerating
- Short-term Trend: Overbought but maintaining strength
Trade Setup and Strategy:
Entry Levels:
- Aggressive Entry: ₹445-₹460 (current levels on minor pullbacks)
- Conservative Entry: ₹420-₹440 (on deeper retracement to support)
- Breakout Entry: ₹350-₹360 (for those who missed the initial move)
Exit Levels:
- Target 1: ₹500 (near-term psychological resistance)
- Target 2: ₹540 (measured move from base)
- Target 3: ₹600 (extended target based on base width)
Stop-Loss Strategy:
- Tight Stop: ₹420 (for aggressive entries)
- Standard Stop: ₹380 (below key support zone)
- Conservative Stop: ₹340 (below breakout point)
Position Sizing and Risk Management:
Position Sizing Guidelines:
- Conservative Allocation: 2-3% of portfolio
- Moderate Allocation: 3-5% of portfolio
- Aggressive Allocation: 5-7% of portfolio (for high-risk tolerance)
Risk Management Framework:
- Maximum Risk per Trade: 2% of total capital
- Risk-Reward Ratio: Minimum 1:3 for all entries
- Scaling Strategy: Add positions on pullbacks to support levels
- Profit Booking: Book 30% at Target 1, 40% at Target 2, 30% at Target 3
Portfolio Considerations:
- Sector Allocation: Limit defence/aerospace exposure to 10-15% of portfolio
- Correlation Risk: Monitor other defence stocks for overexposure
- Market Timing: Consider broader market conditions before position sizing
Sectoral and Fundamental Backdrop:
Defence and Aerospace Sector Overview:
- India's defence budget targeting ₹1.75 lakh crore turnover by 2025
- The government focus on Atmanirbharta (self-reliance) in defence manufacturing
- The global aerospace and defence market is showing a strong growth trajectory
- Space economy growing at 7.4% year-over-year globally
Company Fundamentals:
- Market Cap: ₹8,693 crore
- Revenue: ₹1,074 crore (FY2025)
- Net Profit: ₹110 crore with 21.28% growth in Q4 FY2025
- Promoter Holding: 74% (strong management confidence)
- Specialisation: High-grade alloys, aerospace materials, defence components
Recent Developments:
- Strong presence at Aero India 2025 with indigenous aerospace materials
- Launch of High-Temperature Nickel Alloy Billets and Superni 41 Plates
- Strategic partnerships with HAL, GTRE, ADA, and the Indian Air Force
- Focus on critical materials for defence and aerospace applications
Industry Catalysts:
- Increasing defence procurement by the Indian government
- Export opportunities in aerospace components
- Technological advancement in the space and defence sectors
- The government push for indigenous manufacturing capabilities
Risk Factors and Considerations:
Technical Risks:
- Overbought conditions in the near term may lead to consolidation
- High volatility expected due to recent breakout
- Potential for profit booking at psychological resistance levels
Fundamental Risks:
- Dependence on government orders and policy changes
- Competition from private sector players
- Raw material cost fluctuations
- Execution risks in scaling up production
Market Risks:
- Broader market correction could impact momentum
- Sector rotation away from defence stocks
- Geopolitical factors affecting defence spending
- Interest rate environment impacting valuations
My Take:
NSE:MIDHANI presents a compelling technical setup with a successful breakout from a well-formed base pattern. The combination of strong volume confirmation, favourable sector dynamics, and improving fundamentals creates an attractive investment opportunity. However, investors should be mindful of the recent sharp move and consider appropriate position sizing and risk management strategies.
The stock appears well-positioned to benefit from India's growing defence and aerospace sector, supported by government initiatives and increasing focus on indigenous manufacturing capabilities. Technical indicators suggest further upside potential, making it suitable for both momentum and growth-oriented investment strategies.
Keep in the Watchlist.
NO RECO. For Buy/Sell.
📌Thank you for exploring my idea! I hope you found it valuable.
🙏FOLLOW for more
👍BOOST if you found it useful.
✍️COMMENT below with your views.
Meanwhile, check out my other stock ideas on the right side until this trade is activated. I would love your feedback.
Disclaimer: "I am not a SEBI REGISTERED RESEARCH ANALYST AND INVESTMENT ADVISER."
This analysis is intended solely for informational and educational purposes and should not be interpreted as financial advice. It is advisable to consult a qualified financial advisor or conduct thorough research before making investment decisions.

BEML: Breaks Multi-Month Resistance: Perfect Cup & Handle SetupNSE:BEML Breaks Multi-Month Resistance: Perfect Cup and Handle Setup Signals Major Upside Potential
Price Action Analysis:
Current Price Movement:
-Current Price: ₹4,291.50 (as of June 20, 2025)
-Daily Change: +₹351.70 (+8.20%) - Strong bullish momentum
-High: ₹4,728.40 | Low: ₹4,261.00
-Opening: ₹4,291.50 | Volume: 1.57M shares
Key Price Action Points:
Phase 1: Initial Decline (Sep 2024 - Dec 2024)
-Price Range: 4,400 to 3,600 levels
-Characteristics: Controlled selling with no panic dumping
-Volume: Moderate selling pressure
-Significance: Formation of the cup's left rim
Phase 2: Deep Correction (Dec 2024 - Feb 2025)
-Price Range: 3,600 to 2,350 (Cup Bottom)
-Characteristics: Capitulation phase with heavy selling
-Volume: High volume during the decline indicates washout
-Key Level: 2,350 marked the absolute low and cup base
Phase 3: Recovery Rally (Feb 2025 - Apr 2025)
-Price Range: 2,350 to 3,400 levels
-Characteristics: Strong bounce from cup bottom with increasing volume
-Price Action: Higher lows formation indicating accumulation
-Recovery Strength: 45% bounce from lows
Phase 4: Handle Formation (Apr 2025 - May 2025)
-Price Range: 3,400 to 3,000 levels (shallow pullback)
-Characteristics: Light volume decline, healthy consolidation
-Duration: Approximately 4-6 weeks of sideways action
-Volume Pattern: Drying up volume during pullback - classic handle behaviour
Phase 5: Breakout Phase (May 2025 - Current)
-Breakout Level: Above 3,400-3,500 resistance
-Price Acceleration: From 3,000 to the current 4,639 levels
-Volume Confirmation: Massive volume surge during breakout
-Momentum: 43% rally from handle lows in just 6-8 weeks
Candlestick Patterns and Price Behaviour
-Recent Action: Large green candles with minimal upper shadows indicating strong buying pressure
-Volume-Price Relationship: Price advancing on expanding volume - healthy trend
-Pullback Quality: Any pullbacks have been shallow with quick recoveries
-Support Holding: Price consistently holding above key moving averages
Price Structure Analysis:
-Higher Highs: Consistent pattern of higher peaks since February 2025
-Higher Lows: Each pullback finds support at higher levels
-Trend Strength: Steep angle of ascent indicates strong institutional buying
-Momentum Characteristics: Price moving in strong trending phases rather than choppy action
Critical Price Levels Based on Price Action:
-Breakout Confirmation: 3,500 level successfully held as support after breakout
-Momentum Continuation: 4,000 psychological level cleared with ease
-Current Resistance Test: Approaching the 4,800 level with strong momentum
-Volume at Key Levels: Each significant level break is accompanied by volume expansion
Chart Patterns:
-Cup and Handle Formation: The chart displays a classic cup and handle pattern spanning from late 2024 to mid-2025, with the cup formation completing around June 2025 at approximately 4,639 levels
-Breakout Confirmation: Stock has successfully broken above the handle resistance levels with strong volume confirmation
-Time Frame: The pattern has developed over approximately 9 months, indicating strong institutional accumulation
Support and Resistance Levels:
Major Support Levels:
-Immediate Support: 4,000-4,100 (psychological and technical level)
-Primary Support: 3,800-3,900 (previous resistance turned support)
-Secondary Support: 3,400-3,500 (breakout level)
-Long-term Support: 2,800-3,000 (cup base formation)
Resistance Levels:
-Immediate Resistance: 4,800-4,900 (current test level)
-Major Resistance: 5,200-5,400 (projected target based on cup depth)
-Extended Target: 5,800-6,000 (long-term projection)
Volume Spread Analysis:
-Breakout Volume: Significant volume spike observed during the recent breakout from handle formation
-Volume Confirmation: Above-average volume during the entire cup formation phase indicates institutional interest
-Current Volume: 1.57M shares showing continued institutional participation
-Volume Trend: Consistent volume buildup supporting price advancement
Base Formation Analysis:
Primary Base Characteristics:
-Base Type: Cup and Handle pattern with 7-month consolidation
-Base Depth: Approximately 47% correction from highs of 4,400 to lows of 2,350
-Base Duration: Extended consolidation period allowing for proper shake-out of weak hands
-Base Quality: Clean consolidation with clear support and resistance levels
Trade Setup Analysis:
Entry Strategy:
-Primary Entry: 4,100-4,200 (on pullback to support zone)
-Aggressive Entry: Current market price around 4,300 with tight stop-loss
-Conservative Entry: Wait for retest of 3,800-4,000 support levels
Exit Levels:
Target 1: 5,200 (21% upside from current levels)
Target 2: 5,600 (30% upside potential)
Target 3: 6,000 (40% upside - long-term target)
Stop-Loss Management:
Initial Stop-Loss: 3,800 (below key support)
Trailing Stop: Move to 4,000 once Target 1 is achieved
Risk-Reward Ratio: 1:2.5 (favourable risk-reward setup)
Position Sizing Recommendations:
-Conservative Approach: 2-3% of portfolio allocation
-Moderate Risk: 3-5% allocation for growth-oriented portfolios
-Risk Management: Maximum 5% position size due to single stock concentration risk
Risk Management Framework:
Key Risk Factors:
Market Risk: Overall market volatility can impact individual stock performance
Sector Risk: Defence and infrastructure sector cyclicality
Execution Risk: Pattern failure if stock breaks below 3,800 support
Risk Mitigation Strategies:
Diversification: Avoid over-concentration in a single position
Stop-Loss Discipline: Strict adherence to predetermined exit levels
Position Monitoring: Regular review of technical and fundamental developments
Sectoral and Fundamental Backdrop:
Business Verticals:
-BEML operates across Defence, Rail, Power, Mining and Infrastructure sectors, serving India's core industries BemlindiaBemlindia
-The company manufactures heavy earthmoving equipment for mining and construction, defence vehicles, and coaches for metro and Indian Railways, Bharat Earth Movers Limited
Financial Performance:
-Market Cap: ₹19,324 Crore with revenue of ₹4,022 Cr and profit of ₹293 Cr
-Promoter holding stands at 54.0%, indicating strong government backing.
-The board has recommended a final dividend of ₹1.20 per share for FY25, reflecting confidence in financial performance.
Growth Drivers:
-Company targeting ₹30bn annual opportunity in the mining sector with state-of-the-art equipment.
-Defence projects, including DATRAN prototypes, are expected to be completed by mid-2025
-The company has grown from ₹5 Cr turnover in 1965 to over ₹4,300 Cr currently.
Sector Outlook:
-Defence Modernization: Beneficiary of India's defence modernization and Make in India initiatives
-Infrastructure Push: The Government's focus on infrastructure development supports mining and construction equipment demand
-Railway Expansion: Metro and railway coach manufacturing aligned with India's transportation infrastructure growth
Investment Thesis:
-PSU Re-rating: Part of the broader PSU re-rating theme in Indian markets
-Diversified Revenue: Multi-sector exposure provides revenue stability
-Government Support: Strong backing from the Ministry of Defence ensures policy support
-Technical Breakout: Pattern completion suggests an institutional accumulation phase
My Take:
The combination of strong price action momentum with improving fundamental backdrop makes BEML an attractive investment opportunity for medium to long-term investors, with the cup and handle breakout providing clear entry and exit parameters for risk management.
Keep in the Watchlist.
NO RECO. For Buy/Sell.
📌Thank you for exploring my idea! I hope you found it valuable.
🙏FOLLOW for more
👍BOOST if you found it useful.
✍️COMMENT below with your views.
Meanwhile, check out my other stock ideas on the right side until this trade is activated. I would love your feedback.
Disclaimer: "I am not a SEBI REGISTERED RESEARCH ANALYST AND INVESTMENT ADVISER."
This analysis is intended solely for informational and educational purposes and should not be interpreted as financial advice. It is advisable to consult a qualified financial advisor or conduct thorough research before making investment decisions.
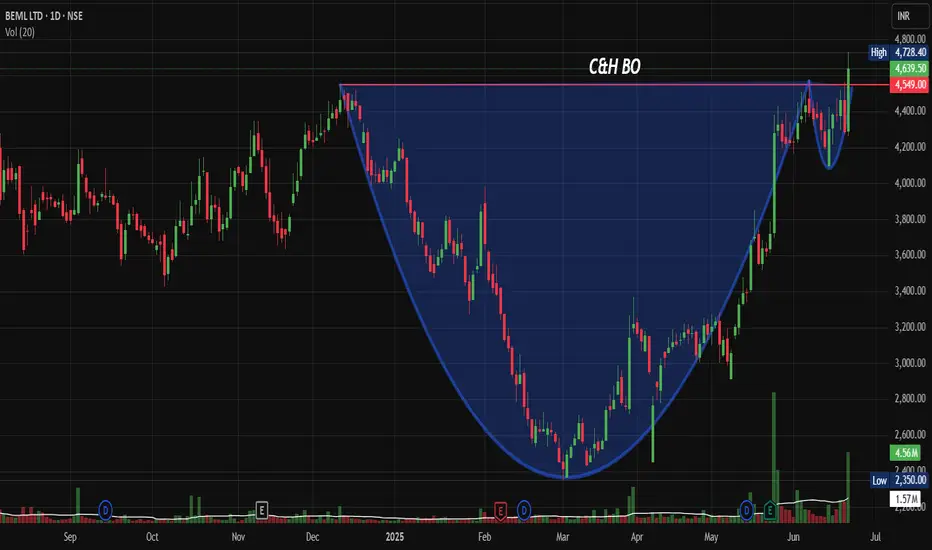
CANFINHOME - Higher Highs & Higher LowsCANFINHOME is making HH-HL formation.
Now giving breakout of resistance, moving above 20ema, RSI is also looking strong.
There is probability of an upside move, looks good above 759.
✅ If you like my analysis, please follow me as a token of appreciation :)
in.tradingview.com/u/SatpalS/
📌 For learning and educational purposes only, not a recommendation. Please consult your financial advisor before investing.

Sterlite Tech: From Despair to Breakout – A Textbook Turnaround NSE:STLTECH : From Despair to Breakout – A Textbook Turnaround Story in the Making. It makes it to my chart of the week Idea after breaking out with good volumes.
Price Action Analysis:
-Recent Action: Strong green candle with significant body suggesting institutional accumulation
-Candle Structure: Minimal upper shadow indicates buying pressure throughout the session
-Previous Action: Series of consolidation candles around ₹85-95 showing accumulation phase
-Breakout Candle: Wide-range bar breaking above downtrend resistance with conviction
Price Swing Analysis:
-Higher Highs/Higher Lows: Recent price action shows initial signs of trend reversal
-Momentum Shift: Price moving from range-bound to trending behaviour
-Gap Analysis: No significant gaps visible, suggesting organic price discovery
Volume Spread Analysis (VSA):
Current Weekly Bar Analysis:
-Volume: 302.33M (Exceptionally high - 12x average volume)
-Spread: Wide range bar with substantial price movement
-Close Position: Closing in the upper 75% of the range
-VSA Interpretation: Professional Money Accumulation - High volume with wide spread and strong close
Volume-Price Relationship Breakdown:
Phase 1 (2022-2023): Distribution & Selling Climax
-High volume on down bars during the initial decline
-Volume spikes coinciding with major price drops
-Classic distribution pattern with professional selling
Phase 2 (2023-2024): Accumulation Phase
-No Supply Bars: Low volume on down bars indicates selling exhaustion
-Testing for Supply: Multiple tests of the ₹50-60 zone with reducing volume
-Background Volume: Consistently low volume, suggesting minimal selling pressure
Phase 3 (Late 2024-2025): Mark-up Beginning
-Effort vs Result: Increasing volume with improving price action
-Spring Action: False break below support, followed by quick recovery
-Current Bar: Classic "Upthrust After Accumulation" with massive volume
Volume Spread Analysis Summary:
Key VSA Signals Identified:
-Selling Climax: Evident in 2022 with high volume and wide down bars
-No Supply: Consistent pattern during 2023-2024 base formation
-Spring/Shakeout: Brief dip below ₹58 with immediate recovery
-Effort to Rise: Current massive volume surge on breakout attempt
-Professional Interest: Volume pattern suggests smart money accumulation
Chart Structure Breakdown:
-Base Formation: Classic Multi-Year Cup Base spanning approximately 3 years (2022-2025)
-Base Duration & Depth: 36+ months with a devastating 85% decline from peak (₹318 to ₹50 lows)
Volume Characteristics:
- Volume dried up significantly during the base formation phase
- Massive volume surge (302.33M vs 24.45M average) accompanying the recent breakout attempt
- Classic accumulation pattern with low volume during decline and high volume on breakout
Key Levels:
Support Levels:
- Primary Support: ₹58-60 (recent low and base formation floor)
- Secondary Support: ₹75-80 (previous resistance turned support)
Resistance Levels:
- Immediate Resistance: ₹125-130 (downtrend line resistance)
- Major Resistance: ₹193-200 (previous significant level)
- Ultimate Resistance: ₹242-250 (prior consolidation zone)
- Breakout Zone: ₹108-112 (current breakout level with volume confirmation)
Price Patterns:
-Primary Pattern: Multi-year Cup Base with potential Handle formation
-Current Action: Breakout from 3-year downtrend line with explosive volume
-Volume Confirmation: 12x volume surge validates the breakout authenticity
-Pattern Reliability: High probability setup given the extended base duration and volume characteristics
Trade Setup:
Entry Strategy:
Primary Entry: ₹110-112 on sustained breakout with volume above 50M
Add-on Entry: ₹115-118 on momentum continuation or successful retest of breakout zone
Early Entry: ₹105-107 for aggressive traders betting on breakout confirmation
Exit Strategy:
Initial Target: ₹140-145 (measured move from base depth)
Secondary Target: ₹175-180 (intermediate resistance zone)
Ultimate Target: ₹200+ (major resistance retest)
Trail SL: Use a 20% trailing stop once the initial target is achieved
Stop-Loss and Risk Management:
Ideal Stop-Loss: ₹95-98 (below breakout zone invalidation)
Conservative SL: ₹88-90 (below recent swing low with buffer)
Position Sizing: Risk 1.5-2% of portfolio capital given the high-conviction setup
Risk-Reward: Attractive 1:3 to 1:4 ratio to initial targets
Sectoral and Fundamental Backdrop:
Sector Outlook:
Sector: Telecom Infrastructure & Optical Fiber - benefiting from 5G rollout momentum
Relative Strength: Telecom capex cycle turning positive with the government's digital infrastructure push
Peer Performance: Optical fiber and telecom equipment stocks showing renewed interest
Stock Fundamentals:
Business Turnaround: The Company has been restructuring operations and reducing its debt burden
Growth Catalyst: 5G infrastructure deployment and the government's Digital India initiatives provide tailwinds
Financial Health: Improving operational efficiency, though still in recovery phase
Technical-Fundamental Alignment: Multi-year base formation coincides with business restructuring completion
Overall Trade Summary:
Reward-to-Risk Ratio: 3.5:1 to initial target, extending to 5:1+ for swing targets
Conviction Level: High- Textbook cup base with volume confirmation.
Ideal Trader Profile:
- Swing Traders: 4-8 week holding period for initial targets
- Positional Traders: 6-12 month horizon for major resistance retest
- Momentum Players: Quick 15-20% moves on breakout continuation
Key Insight: "After 3 years of pain, Sterlite Tech is displaying all the hallmarks of a classic turnaround story - the kind that can deliver multi-bagger returns for patient capital."
Key VSA Insight: "The 12x volume surge represents the moment when smart money stops accumulating and starts marking up - a classic VSA signal for trend initiation."
My Take:
Trade Thesis: This represents a high-probability, low-risk entry into a fundamentally improving story at a technically optimal juncture. The combination of multi-year base, volume breakout, and sector tailwinds creates a compelling risk-adjusted opportunity.
Keep in the Watchlist.
NO RECO. For Buy/Sell.
📌Thank you for exploring my idea! I hope you found it valuable.
🙏FOLLOW for more
👍BOOST if you found it useful.
✍️COMMENT below with your views.
Meanwhile, check out my other stock ideas on the right side until this trade is activated. I would love your feedback.
Disclaimer: "I am not a SEBI REGISTERED RESEARCH ANALYST AND INVESTMENT ADVISER."
This analysis is intended solely for informational and educational purposes and should not be interpreted as financial advice. It is advisable to consult a qualified financial advisor or conduct thorough research before making investment decisions.
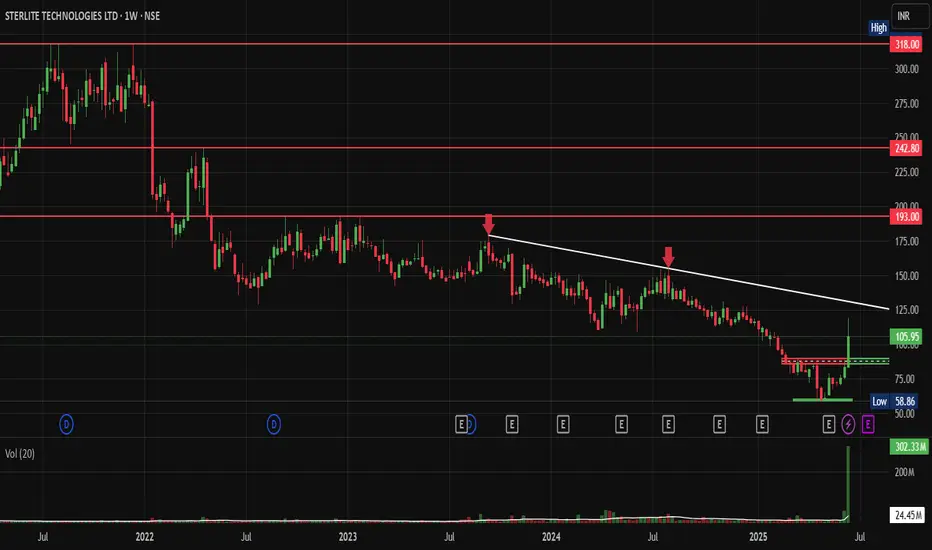
Swiggy Base and Trendline BONSE:SWIGGY gains as Morgan Stanley starts coverage with 'overweight' rating; sees 22% upside.
On Daily Chart, it Could Signal a 35% Breakout - Here's the Exact Level Every Trader is Watching
Price Action Analysis:
The chart reveals a classic consolidation phase following Swiggy's IPO debut in November 2024. After an initial surge to highs around 465 levels post-listing, the stock underwent a significant correction, falling to lows near 297 in March 2025. Currently trading at 362.75, the stock shows signs of building a base in the 310-370 range.
Volume Analysis:
Volume patterns indicate institutional interest with notable spikes during key price movements. The stock gained nearly 17% on its trading debut, signalling growing investor confidence in food and grocery delivery firms. The recent volume of 22.31M shares suggests active participation, though lower than peak trading days.
Key Technical Levels:
Support Levels:
- Primary Support: 305-310 (marked by green horizontal line)
- Secondary Support: 297 (March 2025 low)
- Critical Support: 280 (psychological level)
Resistance Levels:
- Immediate Resistance: 370-375 (red horizontal line marking recent highs)
- Major Resistance: 420-430 (post-IPO consolidation zone)
- Ultimate Target: 465 (all-time high)
Base Formation:
The stock has formed a rectangular consolidation base between 310-370 levels over the past 3-4 months. This 4-month base-building phase indicates potential accumulation by institutional investors, typical behaviour post-IPO as initial volatility settles.
Technical Patterns:
A descending trendline resistance (marked in white) from the March highs is being breached. The current price action suggests a potential breakout from this falling wedge pattern, which is typically bullish.
Trade Setup:
Entry Strategy:
- Conservative Entry: 375+ on breakout above resistance with volume confirmation
- Aggressive Entry: 365-368 on current levels for base play
Exit Levels:
- Target 1: 400 (intermediate resistance)
- Target 2: 430 (major resistance zone)
- Target 3: 465 (all-time high retest)
Stop Loss:
- For breakout trade: 355 (below recent consolidation)
- For base play: 305 (below primary support)
Position Sizing and Risk Management:
- Risk per trade: Maximum 2% of portfolio
- Position size calculation: (Portfolio value × 2%) ÷ (Entry price - Stop loss)
- For a 100,000 portfolio: (100,000 × 2%) ÷ (365 - 305) = 33 shares maximum
- Reward-to-risk ratio: 1:2.5 minimum
Sectoral and Fundamental Backdrop:
NSE:SWIGGY food delivery business achieved profitability in March, with a current market cap of 83,088 crores and revenue of 15,227 crores. However, the company still reports losses of 3,117 crores, indicating it's in a growth investment phase.
The IPO was priced at ₹390 per share, raising ₹11,327.43 crores, providing substantial capital for expansion. The company operates a hyperlocal on-demand delivery model, connecting nearby restaurants and service providers to customers, with diversification into grocery delivery (Instamart) and logistics services.
The food-tech sector in India remains attractive due to increasing digitization and changing consumer behaviour. Recent antitrust concerns regarding discount practices by fast-delivery companies, including Swiggy, indicate regulatory scrutiny, which could impact future growth strategies.
Risk Factors:
- High cash burn rate despite revenue growth
- Intense competition with Zomato, Zepto and other players
- Regulatory challenges in the quick commerce space
- Market volatility affecting new-age tech stocks
My Take:
The technical setup suggests accumulation phase completion with potential for a significant move higher, supported by improving fundamentals in the core food delivery business, achieving profitability. Follow the Strict Trade Plan as Explained Above.
Keep in the Watchlist.
NO RECO. For Buy/Sell.
📌Thank you for exploring my idea! I hope you found it valuable.
🙏FOLLOW for more
👍BOOST if you found it useful.
✍️COMMENT below with your views.
Meanwhile, check out my other stock ideas on the right side until this trade is activated. I would love your feedback.
Disclaimer: "I am not a SEBI REGISTERED RESEARCH ANALYST AND INVESTMENT ADVISER."
This analysis is intended solely for informational and educational purposes and should not be interpreted as financial advice. It is advisable to consult a qualified financial advisor or conduct thorough research before making investment decisions.
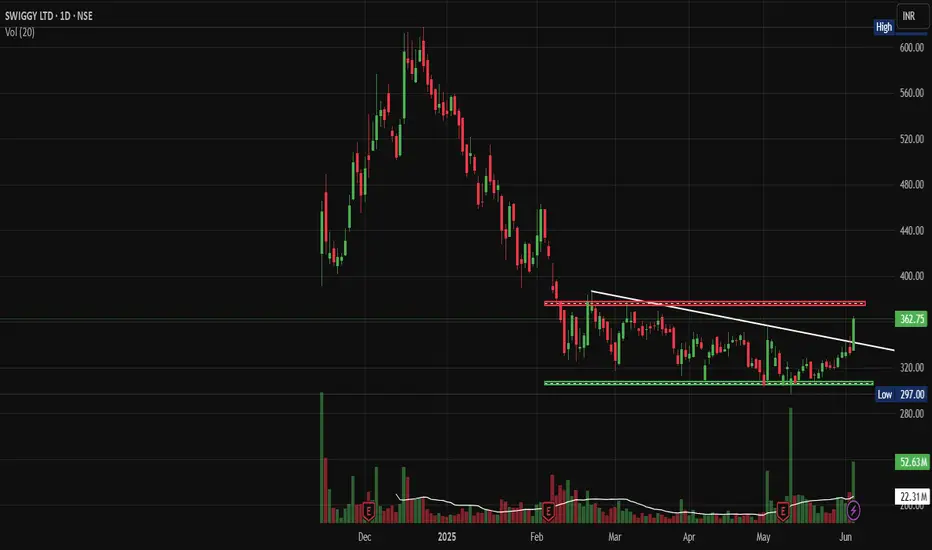
Eicher Motors: Hits Swing Highs, Signal More Upside AheadNSE:EICHERMOT Hits Swing Highs: This Technical Setup Could Signal More Upside Ahead
Price Action Analysis:
- Current Price: ₹5,493.50 (as of June 19, 2025)
- Day's Range: ₹5,410.00 - ₹5,506.50
- Price movement shows strong bullish momentum with recent breakout above resistance
- The stock has gained approximately 100.50 points (+1.86%) in the session
Volume Spread Analysis:
- Current session volume: 923.4K (89% above average)
- Average volume: 488.6K
- Volume surge during breakout phases confirms institutional buying
- Declining volume during consolidation phases shows controlled profit-taking
- Volume spike of 923.4K against average of 488.6K indicates institutional participation
- Volume has been increasing over the past 3 Days.
Volume Pattern Insights:
- Volume expansion on up moves and contraction on down moves
- Accumulation pattern visible in the base formation phase
- Recent volume spike suggests renewed buying interest
Chart Patterns:
- A clear ascending triangle pattern formed between March and May 2025
- Breakout above the ₹5,800 resistance level in April with strong volume confirmation
- Current consolidation phase between ₹5,300-₹5,500 range
- Higher lows pattern since March 2025 indicates underlying bullish sentiment
Key Technical Levels:
Support Levels:
- Immediate Support: ₹5,300 (previous resistance turned support)
- Secondary Support: ₹5,100 (20-day moving average zone)
- Major Support: ₹4,800 (previous consolidation base)
- Critical Support: ₹4,500 (long-term uptrend line)
Resistance Levels
- Immediate Resistance: ₹5,600 (short-term ceiling)
- Key Resistance: ₹5,800 (previous breakout level)
- Major Resistance: ₹5,900 (all-time high zone)
- Extended Target: ₹6,200 (measured move projection)
Base Formation
- Primary base formed between September 2024 - March 2025
- Consolidation range: ₹4,400 - ₹5,200
- Duration: 6 months (healthy accumulation phase)
- Breakout confirmation in April 2025 with volume expansion
Technical Indicators Assessment:
Momentum Indicators:
- Price trading above key moving averages
- Bullish crossover pattern maintained
- Momentum favours bulls in the short to medium term
Trend Analysis:
- Primary trend: Bullish (uptrend intact since September 2024)
- Secondary trend: Consolidation within an uptrend
- Trend strength: Strong (confirmed by volume analysis)
Trade Setup:
Long Position Strategy:
- Entry Strategy: Buy on dips approach
- Accumulation zone: ₹5,300 - ₹5,400
- Momentum entry: Above ₹5,550 with volume confirmation
- Investment horizon: 3-6 months
Entry Levels:
- Conservative Entry: ₹5,320 (near support)
- Aggressive Entry: ₹5,480 (current levels)
- Breakout Entry: ₹5,560 (above resistance)
Exit Strategy:
- Target 1: ₹5,800 (12% upside from current levels)
- Target 2: ₹6,000 (20% upside potential)
- Target 3: ₹6,200 (extended target for long-term holders)
Stop-Loss Levels:
- Conservative SL: ₹5,200 (below key support)
- Aggressive SL: ₹5,350 (tight stop for short-term trades)
- Investment SL: ₹4,800 (major support violation)
Position Sizing & Risk Management:
Position Sizing Guidelines:
- Conservative approach: 2-3% of portfolio allocation
- Moderate approach: 4-5% of portfolio allocation
- Aggressive approach: 6-8% of portfolio allocation (only for high-risk tolerance)
Risk Management Framework:
- Maximum risk per trade: 2% of total capital
- Risk-reward ratio: Minimum 1:2 preferred
- Portfolio correlation: Consider auto sector exposure
- Stop-loss discipline: Strict adherence to predetermined levels
Capital Allocation Strategy:
- Entry in tranches during the consolidation phase
- Average up strategy on breakout confirmation
- Profit booking at predetermined target levels
- Position sizing adjustment based on volatility
Sectoral Backdrop:
Automobile Sector Overview:
- The two-wheeler segment is showing a strong recovery post-COVID
- Rural demand improvement supporting premium motorcycle sales
- Electric vehicle transition creating new opportunities
- Government infrastructure spending boosts commercial vehicle demand
Industry Trends:
- The premium motorcycle segment is growing faster than the mass market
- Export opportunities expanding in international markets
- Supply chain normalisation is improving production efficiency
- Raw material cost pressures are stabilizing
Fundamental Backdrop:
Company Fundamentals:
- May 2025 sales up 26% YoY with a total of 89,429 units sold
- International sales up 82%, showing strong export growth
- Achieved a significant milestone of selling over 100,000 units in March with 33.7% YoY growth
- Fundamentals look strong and suitable for long-term investment
Market Position:
- Continues to dominate >350cc space with >85% market share
- Increased market share from 32.9% in Q4FY22 to ~36% in Q1FY23 in >125cc segment
- Market cap of ₹1,50,676 crores, appearing financially stable compared to competitors
- Average analyst price target of ₹5,426 from 21 research reports
Financial Health:
- Trailing 12-month revenue of $2.19 billion as of March 2025
- Strong balance sheet with healthy cash flows
- Consistent dividend payment track record
- Efficient capital allocation and ROE metrics
Growth Catalysts:
- New product launches, including Hunter 350, are receiving a positive response
- Market share expansion in the premium segment
- International market penetration opportunities
- Electric vehicle portfolio development
Risk Factors:
Company-Specific Risks:
- Dependence on Royal Enfield brand performance
- Raw material cost inflation impact on margins
- Competition intensification in the premium motorcycle segment
- Regulatory changes in emission norms
Market Risks:
- Economic slowdown affecting discretionary spending
- Interest rate changes may impact vehicle financing
- Commodity price volatility
- Currency fluctuation impact on exports
Technical Risks:
- Breakdown below ₹5,200 could trigger selling pressure
- Volume declining during upward moves would be concerning
- Broader market correction affecting sector sentiment
- Profit booking pressure at higher levels
My Take:
Overall Assessment:
The technical setup for NSE:EICHERMOT appears constructive, with the stock maintaining its uptrend structure. The recent consolidation phase provides an opportunity for fresh accumulation. Strong fundamentals support the technical outlook with robust sales growth and market share expansion.
Investment Recommendation
Buy on dips strategy recommended for medium to long-term investors. The risk-reward profile remains favourable with multiple technical targets achievable. However, strict stop-loss discipline and position sizing are crucial for risk management.
Time Horizon:
- Short-term (1-3 months): Consolidation with upward bias
- Medium-term (3-6 months): Bullish with a target of ₹6,000
- Long-term (6-12 months): Positive outlook with potential for new highs
The combination of strong fundamentals, healthy technical setup, and favourable sector dynamics makes NSE:EICHERMOT an attractive investment proposition for quality-focused portfolios.
Keep in the Watchlist.
NO RECO. For Buy/Sell.
📌Thank you for exploring my idea! I hope you found it valuable.
🙏FOLLOW for more
👍BOOST if you found it useful.
✍️COMMENT below with your views.
Meanwhile, check out my other stock ideas on the right side until this trade is activated. I would love your feedback.
Disclaimer: "I am not a SEBI REGISTERED RESEARCH ANALYST AND INVESTMENT ADVISER."
This analysis is intended solely for informational and educational purposes and should not be interpreted as financial advice. It is advisable to consult a qualified financial advisor or conduct thorough research before making investment decisions.
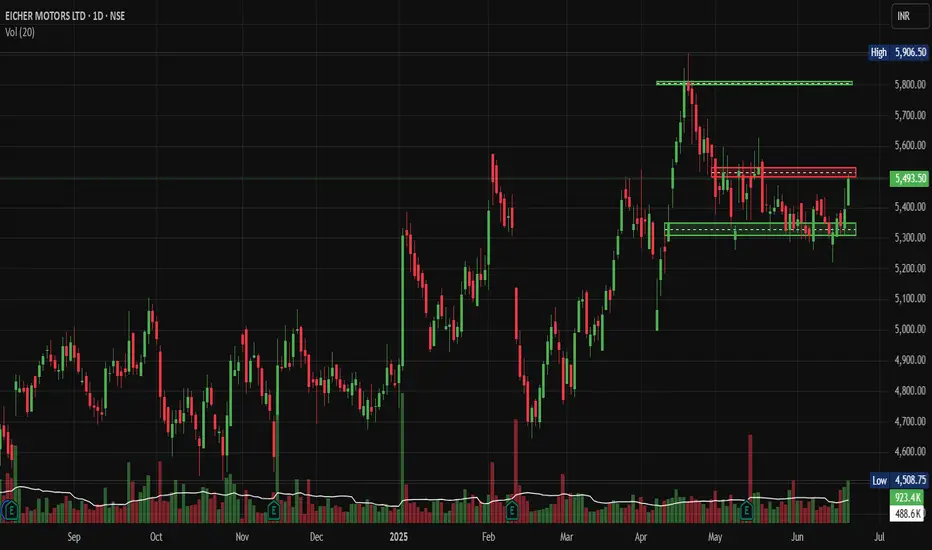
DMART: Technical Breakout Signals Major Rally AheadNSE:DMART Technical Breakout Signals Major Rally Ahead after news of its Entry in Uttar Pradesh as the First Store Opened in Agra.
Price Action:
• Current Price: ₹4,228.40 (up 4.17% or ₹169.30)
• 52-Week Range: ₹3,340 (Low) to ₹5,484.85 (High)
• Stock is trading in the upper half of its annual range, showing strong momentum
• Recent price action indicates a successful breakout from the consolidation phase
Volume Spread Analysis:
• Volume spike visible during recent breakout sessions
• Above-average volume of 585.8K shares traded, confirming institutional participation
• Volume pattern supports the bullish price movement
• Higher volume on green candles indicates genuine buying interest
Key Technical Levels:
Support Levels:
• Primary Support: ₹4,100-4,150 (recent breakout level)
• Secondary Support: ₹3,900-3,950 (previous resistance turned support)
• Major Support: ₹3,600-3,700 (demand zone from March-April consolidation)
• Critical Support: ₹3,400-3,450 (psychological level and volume-based support)
Resistance Levels:
• Immediate Resistance: ₹4,400-4,450 (supply zone marked on chart)
• Major Resistance: ₹4,600-4,700 (previous swing high area)
• Target Resistance: ₹5,200-5,300 (approaching 52-week high zone)
• Ultimate Target: ₹5,484 (52-week high)
Base Formation:
• Stock formed a strong accumulation base between December 2024 and April 2025
• Base depth: Approximately 25-30% from peak to trough
• Duration: A 5-month consolidation period indicates institutional accumulation
• Base breakout occurred with strong volume confirmation in May 2025
Technical Patterns:
• Cup and Handle formation visible from October 2024 to May 2025
• Ascending triangle pattern during the consolidation phase
• Higher lows formation indicating strong underlying demand
• Breakout from falling wedge pattern in early May 2025
Trend Analysis:
• Primary Trend: Bullish (upward sloping trendline from December lows)
• Intermediate Trend: Bullish breakout from consolidation
• Short-term Trend: Strong upward momentum with minor pullback potential
Trade Setup:
Bull Case Scenario:
• Entry Strategy: Buy on dips approach recommended
• Momentum continues toward ₹4,600-4,800 levels
• Volume expansion supports further upside
• Sector rotation favouring retail stocks
Entry Levels:
• Aggressive Entry: ₹4,200-4,250 (current market price area)
• Conservative Entry: ₹4,050-4,100 (on pullback to support)
• Ideal Entry: ₹4,000-4,050 (strong support retest)
Exit Levels:
• Partial Profit Booking: ₹4,500-4,600 (book 30-40% position)
• Second Target: ₹4,800-4,900 (book another 30-40%)
• Final Target: ₹5,200-5,300 (ride remaining 20-30% position)
Stop-Loss Strategy:
• Initial Stop-Loss: ₹3,950 (below recent support)
• Trailing Stop-Loss: Trail stops by ₹150-200 as price advances
• Final Stop-Loss: ₹3,800 (if major support breaks)
Risk Management:
Position Sizing:
• Conservative Allocation: 2-3% of total portfolio
• Moderate Allocation: 3-5% of total portfolio
• Aggressive Allocation: 5-7% of total portfolio (only for high-conviction traders)
Risk Factors:
• Market volatility during the quarterly results season
• Retail sector sensitivity to economic cycles
• High valuations may limit upside potential
• Profit booking pressure near previous highs
Risk Mitigation:
• Diversify across multiple retail stocks
• Use a staggered entry approach
• Maintain strict stop-loss discipline
• Monitor sector rotation trends
Sectoral Backdrop:
Retail Sector Overview:
• The Indian retail sector is following the "Everyday Low Cost - Everyday Low Price" strategy
• Strong, organised retail penetration growth expected
• Consumer spending recovery supporting sector growth
• E-commerce competition intensifying, but offline retail remains resilient
Sector Catalysts:
• Festival season approaching (positive for retail)
• Rural consumption recovery expected
• Urban consumption remains steady
• Government policies supporting organised retail
Fundamental Backdrop:
Company Overview:
• Avenue Supermarts follows a competitive procurement, operational efficiency, and cost-effective distribution strategy
• Market Cap: ₹2,75,237 Crores with almost debt-free status
• Leading hypermarket chain with strong brand presence
Financial Performance:
• Q4 FY25: Sales of ₹14,872 crore (16.9% YoY growth)
• Revenue projected to grow 15% to ₹68,000 to ₹70,000 crore
Business Strengths:
• Strong operational efficiency and supply chain management
• Consistent store expansion strategy
• High customer loyalty and repeat business
• Strong cash generation and a debt-free balance sheet
Growth Drivers:
• New store openings in Tier-2 and Tier-3 cities
• Same-store sales growth improvement
• Category expansion and private label growth
• Digital initiatives and omnichannel presence
My Take:
NSE:DMART presents a compelling technical setup with strong fundamental backing. The stock has successfully broken out from a 5-month consolidation base with volume confirmation. Risk-reward ratio favours bulls with proper position sizing and stop-loss management. Traders should consider entering on minor pullbacks, while investors can accumulate on any meaningful corrections toward support levels.
Keep in the Watchlist.
NO RECO. For Buy/Sell.
📌Thank you for exploring my idea! I hope you found it valuable.
🙏FOLLOW for more
👍BOOST if you found it useful.
✍️COMMENT below with your views.
Meanwhile, check out my other stock ideas on the right side until this trade is activated. I would love your feedback.
Disclaimer: "I am not a SEBI REGISTERED RESEARCH ANALYST AND INVESTMENT ADVISER."
This analysis is intended solely for informational and educational purposes and should not be interpreted as financial advice. It is advisable to consult a qualified financial advisor or conduct thorough research before making investment decisions.