#BANKNIFTY PE & CE Levels(23/01/2026)A flat opening is expected in Bank Nifty, indicating a pause after the recent volatile swings and suggesting that the market is entering a short-term consolidation phase. Price action over the last few sessions clearly shows sharp intraday moves on both sides, followed by quick pullbacks, which reflects indecision and lack of strong directional conviction among participants. This kind of structure usually favors level-based trading rather than aggressive trend-following trades, especially during the first half of the session.
From a technical perspective, the 59050–59100 zone is acting as a crucial intraday pivot and demand area. As long as Bank Nifty holds above this region, the bias remains mildly positive with scope for a gradual upside move. Sustained trading above 59100 can trigger fresh long interest and short covering, which may push the index towards 59250, followed by 59350 and 59450+. However, this upside is likely to be slow and grindy, not impulsive, unless there is a strong breakout candle with volume confirmation above the higher resistance.
On the flip side, the 59450–59400 zone continues to behave as a strong supply and selling area. Any rejection from this region, especially if the price forms long upper wicks or fails to sustain above it, can invite renewed selling pressure. In such a scenario, PE buying near 59450–59400 becomes valid, with downside targets towards 59250, then 59150, and 59050. This makes the 59400–59500 band a critical area where traders should be extremely cautious and avoid chasing breakouts without confirmation.
If selling pressure intensifies and Bank Nifty breaks decisively below 59050, the structure may again turn weak. A breakdown below this support can open the gates for a deeper correction towards 58950–58900, and further down to 58750, 58650, and 58550. These lower levels are strong higher-timeframe supports, so any sharp fall into these zones could again attract bounce-based buying, keeping volatility elevated.
Overall, the broader trend still leans sideways to mildly bearish, with repeated failures near resistance and limited follow-through on rallies. Traders should focus on support-resistance reactions, avoid overtrading during choppy moves, and wait for clear confirmation before committing to large positions. A disciplined approach with strict risk management will be crucial, as Bank Nifty is likely to remain range-bound with sudden spikes on either side during the session.
Priceactionanalysis

NIFTY – Bearish Structure Playing Out as AnticipatedIn my previous posts, I had clearly highlighted the possibility of a trend shift and warned that the ongoing price action could resolve to the downside. Over the last few sessions, price has started to play out exactly along those lines.
1. Bearish crossover (mini death cross)
A bearish crossover between the short-term and medium-term moving averages has now occurred. This was already anticipated and mentioned in earlier posts, and it marks a loss of bullish momentum after the ATH zone.
2. Clean breakdown below key support
Price has decisively broken below an important support and trendline structure. This confirms the bearish bias and strengthens the view that the broader market is under distribution rather than accumulation.
3. Next immediate support zone
The marked zone below acts as the next immediate support, where we may expect temporary consolidation or a technical bounce. However, unless there is strong follow-through buying, this should be treated cautiously.
4. Caution on bullish moves
Any signs of bullishness from here are likely to be temporary retracements, which may eventually trigger further sell-offs.
➡️ Avoid fresh swing longs until overall market sentiment turns favorable.
➡️ Existing positions should be managed with strict stop-losses and disciplined risk management.
The market is behaving in line with what was discussed earlier. Until structure changes and strength is proven, the risk remains on the downside. Patience and capital protection are more important than chasing trades in such phases.
📢📢📢
If my perspective changes or if I gather additional fundamental data that influences my views, I will provide updates accordingly.
Thank you for following along with this journey, and I remain committed to sharing insights and updates as my trading strategy evolves. As always, please feel free to reach out with any questions or comments.
Other posts related to this particular position and scrip, if any, will be attached underneath. Do check those out too.
Disclaimer : The analysis shared here is for informational purposes only and should not be considered as financial advice. Trading in all markets carries inherent risks, and past performance is not indicative of future results. It’s essential to conduct your own research and assess your risk tolerance before making any investment decisions. The views expressed in this analysis are solely mine. It’s important to note that I am not a SEBI registered analyst, so the analysis provided does not constitute formal investment advice under SEBI regulations.

#NIFTY Intraday Support and Resistance Levels - 22/01/2026A gap-up opening is expected in Nifty, indicating a short-term relief bounce after the recent sharp decline and high volatility seen over the last few sessions. This gap-up suggests that buying interest has emerged near the lower demand zones, but the broader trend still remains weak and corrective, so traders should stay cautious and avoid assuming a full trend reversal too early. The market structure clearly shows lower highs and lower lows on the higher timeframe, which means the current upside move should be treated as a pullback within a downtrend unless key resistance levels are reclaimed with strong follow-through.
From a price-action perspective, the 25250–25300 zone is acting as an important reversal and decision-making area. If Nifty manages to sustain above 25250, it may attract short-covering and fresh buying, leading to a gradual upside move towards 25350, followed by 25400 and 25450+. This move will largely depend on whether the gap-up is defended in the first 30–45 minutes of trade. A strong bullish candle with volume confirmation above this zone would support a reversal long setup, but traders should trail profits aggressively as overhead supply is still heavy.
On the downside, the 25200–25250 range remains a critical resistance-turned-supply zone. Any rejection from this area, especially if accompanied by weak candles or long upper wicks, can invite selling pressure. In such a scenario, short positions near 25250–25200 may push the index back towards 25100, then 25050, and potentially 25000. If selling intensifies and Nifty breaks decisively below 24950, the downside could extend further towards 24850, 24800, and even 24750, confirming bearish continuation.
Overall, while the gap-up opening brings short-term positivity, the broader bias remains cautious to bearish unless Nifty sustains above higher resistance levels. Traders should focus on level-based trading, avoid chasing the gap, and wait for confirmation near key zones before taking positions. Intraday volatility is expected to remain high, making risk management and disciplined execution far more important than aggressive directional bets.

#BANKNIFTY PE & CE Levels(22/01/2026)A slightly gap-up opening is expected in Bank Nifty, indicating a mild positive sentiment after the recent sharp sell-off and recovery from lower levels. However, despite the gap-up bias, the broader structure still reflects high volatility and a weak-to-range-bound trend, so traders should avoid aggressive directional bets at the open and wait for price confirmation around key levels.
Market Structure & Price Context
Bank Nifty has witnessed a strong bearish impulse in the previous sessions, followed by a sharp bounce from the lower demand zone near 58,550–58,450. This bounce looks more like a technical pullback rather than a confirmed trend reversal. The index is now trading below major resistance zones, suggesting that upside may remain capped unless key levels are decisively reclaimed.
The slightly gap-up opening is likely to test nearby resistance areas quickly. If the gap sustains with follow-through buying, short-term upside moves are possible; otherwise, selling pressure may re-emerge from higher levels.
Key Resistance Zones (Sell on Rise / Short Bias Areas)
- 59,450–59,500: This is a crucial supply zone and previous breakdown area. Any move towards this level without strong volume confirmation may face selling pressure.
- Above 59,450, if price shows rejection or bearish candles, PE buying / short trades can be considered with targets around 59,250 → 59,150 → 59,050.
- A decisive breakout and sustain above 59,500 would weaken the bearish bias and open the door for a larger pullback.
Reversal Buy Zone (Intraday / Short-term Bounce Setup)
- 59,050–59,100 is an important reversal demand zone.
- If Bank Nifty holds above this zone and shows bullish confirmation (strong candles, higher low formation), a reversal Buy CE setup is possible.
- Upside targets for this move are 59,250 → 59,350 → 59,450+.
- This trade should be treated as a counter-trend or pullback trade, so strict stop-loss discipline is essential.
Breakdown & Bearish Continuation Levels
- Below 58,950–58,900, selling pressure may increase again.
- PE buying below 58,950–58,900 can be planned with targets at 58,750 → 58,650 → 58,550.
- A further breakdown below 58,450 would confirm bearish continuation and may drag the index towards 58,250 → 58,150 → 58,050 in the coming sessions.
Trading Approach for the Day
- Expect initial volatility due to the slightly gap-up opening.
- Avoid trading immediately at the open; let the first 15–30 minutes define direction.
- Focus on level-based trades, not emotional entries.
- Prefer sell-on-rise strategy near resistance unless the index shows strong acceptance above 59,500.
- Keep position sizes light and trail profits aggressively due to fast intraday swings.
Overall View
The broader trend remains bearish to sideways, with the current gap-up likely to be a relief move rather than a trend change. Clear directional strength will only emerge if Bank Nifty sustains above major resistance or breaks decisively below key supports. Until then, disciplined, level-driven trading with strict risk management is the best approach.

#NIFTY Intraday Support and Resistance Levels - 21/01/2026A flat opening is expected in Nifty, indicating continued consolidation after the recent sharp decline and volatile price action near lower demand zones. The index has shown strong selling pressure from higher levels and is now hovering close to a critical support area, suggesting that the market is at an important decision point. Early trade is likely to remain range-bound with heightened volatility, as both buyers and sellers assess whether the recent support will hold or break further.
On the support side, the immediate demand zone is placed around 25,250–25,200. This area has already witnessed a sharp reaction, indicating short-term buying interest and the possibility of a technical bounce. If Nifty manages to hold above 25,250, a reversal long setup may come into play with upside targets of 25,350, 25,400, and 25,450+. Any pullback followed by strong bullish candles or higher low formation near this zone can be used as a confirmation for intraday or short-term long trades, keeping strict stop-losses below the support.
On the upside, the immediate resistance lies near 25,450–25,400, which is a previous breakdown zone. Sustaining above this level is crucial for bulls to regain control. Failure to cross this resistance may again attract selling pressure, keeping the index trapped in a sideways-to-bearish structure. Hence, profit booking is advised near resistance levels for long positions, and fresh longs should be considered only on a decisive breakout with volume confirmation.
On the downside, a clear break below 25,200 would weaken the structure further and open the door for fresh short trades. In such a scenario, downside targets are placed at 25,100, 25,050, and 25,000, which are the next major psychological and technical support levels. Below 25,000, the selling momentum can accelerate, so traders should be cautious and trail profits aggressively in short positions.
Overall, the broader trend remains bearish with short-term consolidation, and today’s flat opening suggests a wait-and-watch approach during the initial phase of the session. Traders should focus on level-based trading, avoid chasing moves, and strictly follow risk management. Directional clarity is expected only after a confirmed breakout above resistance or a breakdown below the key support zone.

[INTRADAY] #BANKNIFTY PE & CE Levels(21/01/2026)A flat opening is expected in Bank Nifty, indicating indecision after the recent sell-off and rejection from higher levels. The index is currently trading below its immediate resistance zone, reflecting weak momentum and cautious sentiment among market participants. Early trade is likely to remain volatile but range-bound, as both buyers and sellers wait for confirmation near the marked support and resistance levels before committing to fresh positions.
On the upside, the key resistance zone is placed near 59,550–59,600. If Bank Nifty manages to sustain above 59,550, it can trigger a buy-on-breakout setup with upside targets of 59,750, 59,850, and 59,950+. A move above this zone would indicate short-covering and fresh buying interest, potentially leading to a recovery rally towards the upper resistance band near 59,950. Long trades should be considered only after clear acceptance above resistance with stable price action.
On the downside, the immediate support is seen around 59,450–59,400. Failure to hold this level can invite fresh selling pressure, making buy PE options favorable for downside moves. In such a case, targets are placed at 59,250, 59,150, and 59,050, where partial profit booking is advisable. A stronger breakdown below 58,950–58,900 would further weaken the structure and open deeper downside targets near 58,750, 58,650, and 58,550, which are major demand zones and potential bounce areas.
Overall, the broader structure suggests a sell-on-rise and range-trading strategy unless a decisive breakout above resistance occurs. Traders should avoid aggressive positions during the initial flat phase and instead focus on level-based trades with strict stop-loss management. Scalpers and intraday traders can capitalize on moves near support and resistance, while positional traders should wait for a confirmed directional breakout before taking larger exposure.

#NIFTY Intraday Support and Resistance Levels - 20/01/2026A flat opening is expected in Nifty, indicating continued consolidation after the recent corrective move. The index is currently trading below the previous resistance zone, suggesting that the overall bias remains cautious in the near term. Early price action is likely to remain range-bound, with volatility expected around the marked support and resistance levels. Traders should be patient during the opening minutes and wait for price confirmation near key levels before initiating positions.
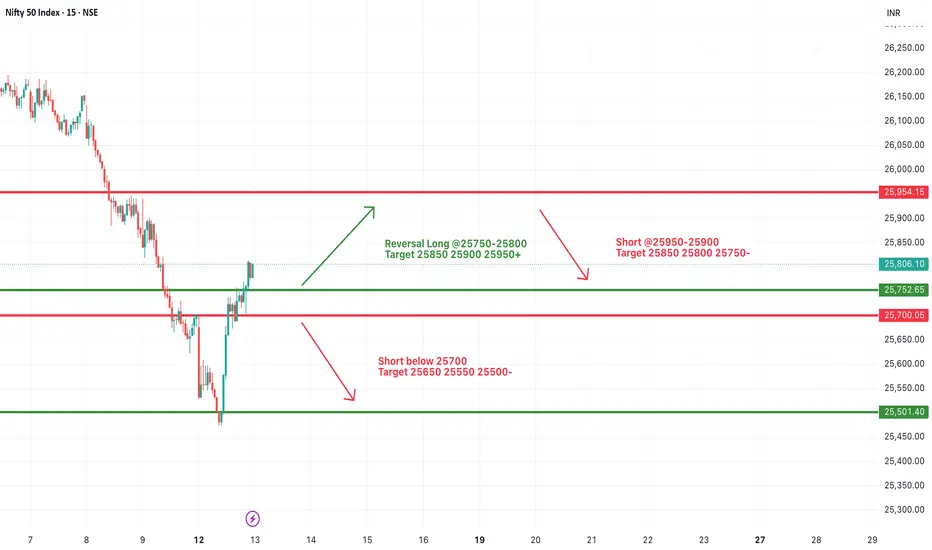
On the upside, the immediate resistance zone is placed around 25,750–25,800. A sustained move and acceptance above 25,750 can trigger a reversal long setup, indicating that buyers are regaining control. If this breakout holds, Nifty may gradually move towards 25,850, followed by 25,900 and 25,950+, where fresh supply and profit booking can be expected. Long trades should only be considered if the index shows strong price acceptance above this zone with supportive volume.
On the downside, the 25,700–25,650 region remains a crucial intraday support. Any rejection from the resistance zone or failure to hold above 25,700 can lead to a reversal short setup. In such a scenario, downside targets are seen at 25,650, 25,550, and 25,500, which are important demand areas. A decisive breakdown below 25,450 will further weaken the structure and can open the gates for deeper downside towards 25,350, 25,300, and 25,250, where buyers may attempt a defensive bounce.
Overall, the market structure suggests a sell-on-rise or range-trading environment unless a strong breakout above resistance occurs. Traders should focus on level-based trading with strict stop-loss discipline and avoid overtrading during sideways moves. Scalping and short-term trades near support and resistance will be more effective than positional trades until Nifty shows a clear directional breakout.

[INTRADAY] #BANKNIFTY PE & CE Levels(20/01/2026)A flat opening is expected in Bank Nifty, indicating indecision after the recent volatile moves. The index is opening near the 59,800–59,900 zone, which continues to act as a short-term balance area where buyers and sellers are actively competing. This suggests that the market is still in a consolidation phase and is waiting for a clear trigger to decide the next directional move. Early price action is likely to remain choppy, with whipsaws possible near key intraday levels.
On the upside, the crucial level to watch remains 60,050–60,100. A sustained move and acceptance above this zone will indicate renewed buying strength. If Bank Nifty manages to hold above 60,050, bullish momentum can gradually build, opening the path for CE buying opportunities. In such a scenario, upside targets are placed at 60,250, followed by 60,350, and 60,450+, where strong supply zones are expected. A breakout above these levels may also invite short covering, accelerating the move higher.
On the downside, the 59,950–59,900 area is acting as immediate intraday support. Any rejection or failure to sustain above this zone may increase selling pressure. A breakdown below 59,900 can trigger PE buying, with downside targets at 59,750, 59,650, and 59,550. If weakness extends further and the index slips below 59,450, it would confirm bearish dominance, opening deeper downside levels toward 59,250, 59,150, and 59,050.
Overall, the structure suggests a range-bound and level-based trading session unless a decisive breakout or breakdown occurs. Traders should avoid aggressive early entries and focus on confirmation-based trades near the mentioned levels. Scalping and short-term positional trades with strict stop-loss and disciplined risk management will be more effective than directional bets until the market clearly breaks out of this consolidation range.

#NIFTY Intraday Support and Resistance Levels - 19/01/2026Based on the current structure of the Nifty 50 chart, a gap-down opening is expected, which clearly reflects cautious sentiment at the start of the session. The index is opening below the recent consolidation zone, indicating that sellers are still active and buyers are not yet confident to push prices higher at the open. This kind of opening generally leads to a range-bound to volatile first half, where the market tests nearby support and resistance levels before showing any clear directional bias.
From a technical perspective, the 25,700–25,750 zone is acting as an important short-term decision area. This level has previously behaved as both support and resistance, making it a critical region to watch today. If Nifty manages to hold above 25,700 and shows strength, there is a possibility of a reversal long setup. Sustained price action above 25,750–25,800 can attract buying interest, and in that case, the upside targets remain 25,850, 25,900, and 25,950+. Such a move would indicate short covering and intraday recovery after the gap-down opening.
On the downside, if the index fails to sustain above 25,700 and breaks down decisively below this level, selling pressure is likely to increase. A clean breakdown below 25,700 can open the door for further downside towards 25,650, 25,550, and 25,500. This would confirm that the gap-down opening is being accepted by the market and that bears remain in control for the session. Any rejection from the 25,950–26,000 resistance zone would further strengthen the bearish intraday outlook.
Overall, the market structure suggests a sell-on-rise or level-based trading approach rather than aggressive directional trades at the open. Traders should avoid early impulsive entries and instead wait for confirmation near the marked levels. If price stabilizes and forms a base near support, a controlled reversal trade can be planned. Otherwise, continued weakness below support levels may offer short-selling opportunities with strict risk management. The session is likely to remain volatile and level-driven, making patience and discipline crucial for today’s trades.

[INTRADAY] #BANKNIFTY PE & CE Levels(19/01/2026)Based on the current chart structure, Bank Nifty is indicating a gap-down opening below the 59,950 level, which is an important short-term pivot zone. This gap-down suggests early weakness and cautious sentiment at the opening, especially after the index failed to sustain above the previous resistance band. However, the broader structure still shows that the market is trading within a well-defined range, and the day’s direction will largely depend on how price behaves around the marked support and resistance levels.
Intraday Structure & Key Observations
- The 59,950–60,050 zone has acted as a crucial decision-making area in recent sessions. A gap-down below this zone indicates that sellers are active, but confirmation will only come if price sustains below this level after the first 15–30 minutes.
- The 60,050–60,110 region now becomes an immediate resistance. Any pullback towards this zone should be closely watched for rejection or acceptance.
- The upper resistance near 60,450 remains a major supply zone. Only a strong breakout and sustained move above this level would shift the intraday bias clearly towards bullish continuation.
Bullish Scenario (CE Side)
- If Bank Nifty manages to recover and sustain above 60,050, it may indicate that the gap-down was a false breakdown or an opening trap. In such a case:
- Buying opportunities can be considered above 60,050–60,100 with confirmation.
- Upside targets would be 60,250, 60,350, and 60,450+.
- Price acceptance above 60,110 with strong candles would strengthen the bullish case.
This scenario would reflect strong buying interest at lower levels and could lead to a short-covering move.
Bearish Scenario (PE Side)
- If the index fails to reclaim 59,950 and continues to trade below it:
- Selling pressure is likely to dominate.
- Below 59,950–59,900, downside targets open up at 59,750, 59,650, and 59,550.
- A deeper breakdown below 59,450 can accelerate the fall towards 59,250, 59,150, and 59,050.
- This would confirm that the gap-down opening is being accepted by the market, indicating a bearish continuation day.
Trading Approach & Risk Management
- Expect initial volatility due to the gap-down opening; avoid aggressive trades in the first few minutes.
- Wait for price confirmation near key levels rather than predicting direction.
- Trade with strict stop-losses and consider partial profit booking at intermediate targets.
- If price remains stuck between 59,950 and 60,050, the session may turn into a range-bound or whipsaw day.
Overall View
The immediate bias remains cautious to bearish due to the gap-down opening below 59,950. However, a quick recovery above 60,050 can neutralize this weakness. Today’s trade will be purely level-based, and discipline will be key. Let the market confirm direction before committing to larger positions.

Chumtrades XAUUSD H2 | Is the Liquidity Sweep Over?Chumtrades – XAUUSD H2 | Has the Liquidity Sweep Finished, or Is There More Downside Ahead?
On Friday, the market reacted strongly after Trump’s comments regarding Kevin Hassett, when Trump expressed his preference for Hassett to remain in his current role rather than taking a new position.
👉 As a result, gold printed a long wick liquidity sweep back into the prior ATH zone, around 4530–453X, before closing back above 456X.
This brings us to the key question:
Was this sweep enough for the BUY side, or is the market still looking to test lower levels?
Political developments will be a key driver for gold direction in the coming week.
📰 Key Political Factors to Monitor
1. Trump – Greenland
The US has imposed 10% tariffs, with the possibility of increasing them to 25% on countries that do not support the annexation of Greenland
No fixed deadline, tariffs remain until Greenland becomes part of the US
→ This is a supportive factor for gold, especially amid rising geopolitical uncertainty
→ This news may directly impact the market open
→ If price reacts strongly, avoid SELLs near resistance
2. Iran – Protests
Monitor the risk of Trump returning to direct intervention
→ A potential headline-driven volatility trigger
🟢 Key Support Zones to Watch
4530 – 4535
4515 – 4510
4480 – 4482
4462
4410 – 4407
🔴 Key Resistance Zones to Monitor
4618 – 4628
4648 – 4650
4655 – 4660
4698 – 4699
⚠️ Trading Notes
Price levels are zones for observation, not instant entry points
SELL setups around 462X must be evaluated based on news reaction
If momentum accelerates on headlines → stay flat and avoid trading against strength
💬 Question for the New Week
Is the market finishing its liquidity collection on the BUY side,
or was Friday’s sweep the final test before the next leg higher?
📌 Follow Chumtrades for proactive market analysis, structured trade planning, and risk management insights.

JTLIND: 3 year Downtrend Trendline Breakout, Chart of the WeekFrom ₹138 to ₹50: Why This Old Multi-Bagger Steel Stock Just Hit 20% Upper Circuit, Breaking 3-Year Downtrend and Getting a Big Order. Let's Understand in "Chart of The Week"
As per the Latest SEBI Mandate, this isn't a Trading/Investment RECOMMENDATION nor for Educational Purposes; it is just for Informational purposes only. The chart data used is 3 Months old, as Showing Live Chart Data is not allowed according to the New SEBI Mandate.
Disclaimer: "I am not a SEBI REGISTERED RESEARCH ANALYST AND INVESTMENT ADVISER."
This analysis is intended solely for informational purposes and should not be interpreted as financial advice. It is advisable to consult a qualified financial advisor or conduct thorough research before making investment decisions.
Price Action:
- Current Price: ₹72.29
- 52W High: ₹138.30
- 52W Low: ₹21.79
- The stock has recently broken above a critical downward trendline that had been in effect since mid-2024, showing strong reversal momentum with 15x average volume spike
Volume Spread Analysis:
Volume Characteristics:
- Average Volume: 1.42M shares
- Recent Spike: 21.33M shares (15x average)
- This represents exceptional institutional participation and strong momentum buying
- Historical volume spikes occurred during the 2021-2023 rally phase, suggesting similar strong hands accumulation
Volume Patterns:
- Volume dried up significantly during the downtrend, reaching multi-year lows near the ₹50 base
- This "spring" action with low volume at support followed by explosive volume on breakout is a classic Wyckoff accumulation pattern
- The volume bar chart shows distinct phases: high volume during 2023 rally, declining volume during correction, and massive spike on recent breakout
Volume-Price Correlation:
- The stock showed positive volume-price correlation during the breakout, confirming institutional buying
- Previous high-volume days in 2023 coincided with price rallies, suggesting volume leads price for this stock
- Current volume expansion suggests a potential multi-week rally ahead
Base Formation and Support Levels:
- Primary Base: ₹50-55 zone (marked with horizontal green dashed line)
- This base represents a critical accumulation zone where most institutional hands exchanged during the 2021-2022 period
- The stock tested this support multiple times between 2021-2022 before the explosive rally to ₹138
- Recent re-test of this base in late 2025/early 2026 at ₹50-52 suggests strong institutional buying interest
- Secondary Support: ₹21-22 zone represents the absolute low and panic bottom
Resistance Levels:
- Immediate Resistance: ₹80-85 zone
- Major Resistance: ₹95-100 (previous consolidation area in mid-2025)
- Critical Resistance: ₹110-115 zone
- Ultimate Resistance: ₹120-125 (prior to all-time high of ₹138.30)
Trendline Analysis:
- A clear downward trendline has been connecting lower highs since the peak at ₹138.30
- This trendline acted as resistance throughout 2024-2025, rejecting multiple bounce attempts
- Recent breakout above this trendline with massive volume confirms trend reversal
- The breakout occurred at approximately ₹60-62 level, suggesting the downtrend has been structurally broken
Breakout Confirmation:
- The recent 40% single-day rally with 20% upper circuit suggests strong momentum
- Breakout above the descending trendline with volume confirmation is a textbook bullish signal
- The stock reclaimed the ₹70 level, which previously acted as support-turned-resistance
Sectoral Backdrop:
Industry Overview:
- JTL Industries operates in the Steel Pipes & Tubes manufacturing sector, specifically focused on Electric Resistance Welded (ERW) pipes
- The company is positioned in the Basic Materials sector, under Steel & Iron Products subsector
- It serves critical end-use industries including Infrastructure, Oil & Gas, Power Transmission, Water Management, and Construction
Market Position:
- JTL is among the top 5 steel tube manufacturers in India and the largest ERW pipe manufacturer in North India
- Current manufacturing capacity: 9,36,000 MTPA (Metric Tons Per Annum) across 4 state-of-the-art facilities
- Geographic presence: Pan-India domestic market plus exports to 20+ countries across 5 continents
- Product portfolio: 1,200+ SKUs covering MS Black pipes, Galvanized pipes, Hollow sections, Solar mounting structures, Transmission towers, and specialty products
Sectoral Growth Drivers:
- Infrastructure Boom: India's infrastructure spending is accelerating with massive government projects including Bharatmala (34,800 km highways), PM-AWAS housing program, and Smart Cities 2.0
- Steel Demand Growth: India's steel demand is projected to grow at approximately 9% CAGR during 2025-2026, the highest globally according to World Steel Association
- Pipe Market Expansion: The Indian steel pipes market is expected to grow from USD 32.88 billion (2023) to USD 37.69 billion by 2030 at a CAGR of 6.43%
- Government Policy Support: Production Linked Incentive (PLI) scheme for specialty steel worth ₹27,106 crore and preferential procurement mandates support domestic manufacturers
- Power Sector Growth: Significant investments in power transmission infrastructure across India creating sustained demand for transmission towers and related products
Sector Challenges:
- Raw Material Volatility: Steel prices remain subject to global commodity cycles, coal costs, and iron ore price fluctuations
- Chinese Competition: China's steel oversupply and export surge create pricing pressure
- Environmental Regulations: EU's Carbon Border Adjustment Mechanism (CBAM) effective 2026 could add USD 80-397 per ton cost to exports
- Working Capital Intensity: Industry characterized by high working capital requirements (JTL's working capital days increased from 100 to 147 days)
Fundamental Backdrop:
Business Model:
- Integrated manufacturer of ERW steel pipes with backward integration capabilities
- Recent acquisition of 67% stake in Nabha Steels & Metals adds 2 lakh MT HRC (Hot Rolled Coil) capacity
- Diversified customer base across B2B, B2G, OEMs, and international markets reduces concentration risk
- Distribution network of 800+ dealers/distributors ensures strong market reach
Recent Corporate Actions:
- Major Order Win: Secured significant order from Punjab State Transmission Corporation Limited (PSTCL) for manufacturing 220kV transmission tower material and substation structures
- Execution Timeline: Order to be completed within FY 2025-26
- Strategic Significance: This order reinforces JTL's positioning in the power transmission infrastructure segment
- Stock Impact: The PSTCL order announcement triggered a 20% upper circuit rally, demonstrating market confidence
Financial Performance Snapshot:
- Q2 FY26 Revenue: ₹371 crores (down 22% YoY from ₹480 crores)
- Q2 FY26 EBITDA: ₹29 crores
- EBITDA Margin: Improved to 8% (from 6% YoY)
- EBITDA per ton: Increased 29% YoY to ₹4,247
- Market Capitalization: Approximately ₹2,360 crores
- Sales Mix: 88% domestic, 12% exports
Operational Efficiency Metrics:
- Despite revenue decline, operational efficiency has improved as evidenced by EBITDA margin expansion
- Higher EBITDA per ton suggests better realization and product mix optimization
- Working capital pressure visible with debtor days increasing from 40.1 to 52.8 days
Growth Catalysts:
- Capacity Expansion: With acquired Nabha Steels capacity, total capacity stands at 6 lakh MT for pipes + 2.5 lakh MT HRC + 1 lakh MT long products
- Product Diversification: Expansion into solar mounting structures, transmission towers, and specialty products reduces cyclicality
- Export Growth Potential: Recognition as "Star Export House" by Government of India supports international expansion
- Green Transition: Focus on sustainable practices and potential for green steel production aligns with global trends
Management & Governance:
- Promoter holding remains stable with recent inter-se transfers within promoter group
- ISO 9001:2015 certified operations demonstrating quality commitment
- Established in 1991, providing 30+ years of industry expertise
- Leadership under Pranav Singla (Executive Director) has articulated growth strategy and export targets
Competitive Landscape:
- Key competitors include APL Apollo Tubes, Rama Steel Tubes, Hi-Tech Pipes, Sambhv Steel
- Industry seeing consolidation with smaller players struggling with working capital and raw material costs
- JTL's integrated model and backward integration through Nabha Steels acquisition provides competitive advantage
Valuation Considerations:
- 5-Year Returns: Stock has delivered 312% returns over 5 years vs NIFTY 50's 79%
- Despite recent correction from ₹138 to ₹50, long-term value creation trajectory remains intact
- Current levels around ₹72 offer attractive entry for investors with 2-3 year horizon
- Recent order wins and capacity additions support earnings growth potential
Bull Case:
- Technical breakout from multi-month downtrend with exceptional volume confirmation
- Strong sectoral tailwinds from India's infrastructure boom and 9% steel demand growth
- Recent PSTCL order validates competitive positioning and execution capabilities
- Improved operational efficiency despite revenue headwinds
- Capacity expansion and backward integration strengthen margin profile
- Government policy support through PLI schemes and procurement preferences
Bear Case:
- Revenue declined 11% YoY in Q2 FY26, indicating near-term demand challenges
- Working capital pressure with increased debtor and working capital days
- Raw material cost volatility remains a persistent risk
- Global trade uncertainties and potential CBAM impact on exports
- Chinese steel oversupply creating pricing pressure
- Technical pattern needs confirmation with sustained trading above ₹65-70 zone
Key Monitorables:
- Quarterly revenue and EBITDA trend in coming quarters
- Execution and revenue recognition from PSTCL order
- Raw material cost trends and margin sustainability
- Order book build-up from infrastructure projects
- Working capital management improvements
- Technical price action: Holding above ₹65-70 support zone would confirm bullish reversal
My 2 Cents:
NSE:JTLIND presents an interesting technical setup following the breakout from a prolonged downtrend, supported by a major order win and improving operational metrics. The stock's 15x volume spike and 20% upper circuit rally suggest strong institutional interest resuming after extended consolidation at the ₹50-55 base.
From a sectoral perspective, the company is well-positioned to benefit from India's infrastructure boom, power transmission expansion, and robust steel demand growth. The recent PSTCL order validates its competitive capabilities in the high-value transmission infrastructure segment.
Full Coverage on my Mid-Week Newsletter coming Wednesday.
Keep in the Watchlist and DOYR.
NO RECO. For Buy/Sell.
📌Thank you for exploring my idea! I hope you found it valuable.
🙏FOLLOW for more
👍BOOST if you found it useful.
✍️COMMENT below with your views.
Meanwhile, check out my other stock ideas on the right side until this trade is activated. I would love your feedback.
As per the Latest SEBI Mandate, this isn't a Trading/Investment RECOMMENDATION nor for Educational Purposes; it is just for Informational purposes only. The chart data used is 3 Months old, as Showing Live Chart Data is not allowed according to the New SEBI Mandate.
Disclaimer: "I am not a SEBI REGISTERED RESEARCH ANALYST AND INVESTMENT ADVISER."
This analysis is intended solely for informational purposes and should not be interpreted as financial advice. It is advisable to consult a qualified financial advisor or conduct thorough research before making investment decisions.

Nifty spot 25694.35 by Daily Chart view - Weekly UpdateNifty spot 25694.35 by Daily Chart view - Weekly Update
- Support Zone 25425 to 25725 for Nifty Index seems grounded
- Resistance Zone 26000 to 26200 >>> ATH 26373.20 for Nifty Index
- Nifty is facing the fear factor syndrome shadowed by clouds of caution
- Positive ripples trying to enable Nifty regain up-move with hopes for continuity

Bank Nifty spot 60095.15 by Daily Chart viewBank Nifty spot 60095.15 by Daily Chart view
- Support Zone 59125 to 59525 for Bank Nifty
- Resistance Zone 60110 to ATH 60437.35 for Bank Nifty
- Positive ripples enabling Bank Nifty regain up-move and hope for continuity

RBL Bank Shows a Powerful Cup Pattern Breakout on Weekly ChartRBL Bank has completed a textbook Cup & Handle pattern on the weekly timeframe, signaling a meaningful shift from a long consolidation phase into a fresh bullish trend. The rounded base formation highlights a gradual transition from distribution to accumulation, indicating growing confidence among long-term market participants.
The most critical development is the decisive breakout above the handle resistance zone, which had previously acted as a strong supply area. This breakout is supported by strong price expansion and follow-through candles, confirming that buyers are in control. Such breakouts from multi-month bases often lead to sustained trending moves rather than short-lived rallies.
From a price projection standpoint, the measured move of the cup suggests an initial upside target around 380+, followed by an extended projected target near 440+ if momentum continues to build. The current structure also shows healthy consolidation above the breakout level, which is a positive sign and often acts as a base for the next leg higher.
Risk management remains clearly defined in this setup. As long as the price holds above the breakout support zone near 280–290, the bullish structure stays intact. Any sustained breakdown below this area would invalidate the pattern and shift the outlook back to neutral or corrective.
Overall, RBL Bank appears to be transitioning into a new medium-to-long-term uptrend, backed by a strong chart structure and favorable risk–reward dynamics. This makes it a compelling setup for positional traders and investors who prefer structurally confirmed breakouts with clear targets and controlled downside risk.

#NIFTY Intraday Support and Resistance Levels - 16/01/2026Based on the current price structure and the levels marked on the chart, the market is expected to open flat with no major deviation from the previous session’s range. Nifty is currently trading near a well-defined demand–supply zone, indicating indecision and consolidation rather than a strong directional bias. As long as the index holds above the 25,750–25,800 support area, there is a possibility of a technical pullback or reversal on the upside. A sustained move above this zone can attract fresh buying interest, with upside targets placed around 25,850, followed by 25,900 and 25,950 levels. This zone will act as an important intraday trigger, and confirmation should ideally come with strong price acceptance and volume.
On the downside, the 25,700 level remains a critical breakdown point. If Nifty fails to sustain above this level and slips below 25,700, selling pressure may intensify, opening the path for a decline towards 25,650, 25,550, and potentially 25,500. This makes the lower support band extremely important for intraday traders, as a breakdown below it can quickly change the market sentiment to bearish. Until a clear breakout or breakdown is seen, the overall structure suggests range-bound movement, and traders are advised to be patient and wait for confirmation near key levels rather than taking aggressive positions at market open.
Overall, the market context remains neutral to mildly cautious, with flat opening expectations and stock-specific or level-based opportunities likely to dominate the session. Strict risk management is recommended, along with partial profit booking near targets, as volatility may increase once the index moves decisively out of the current consolidation range.

[INTRADAY] #BANKNIFTY PE & CE Levels(16/01/2026)A flat opening is expected in Bank Nifty, with the index trading near the 59,550–59,600 zone, which continues to act as a key intraday balance area. Price action shows consolidation within yesterday’s range, indicating that the market is still indecisive and waiting for a directional trigger. No major changes are observed in the overall structure compared to the previous session.
On the upside, a sustained move above 59,550–59,600 will be important for bullish continuation. If Bank Nifty holds above this zone, long trades (CE positions) can be considered with upside targets at 59,750, 59,850, and 59,950+. A breakout above 59,950 may further strengthen bullish momentum toward higher resistance levels.
On the downside, failure to hold the 59,450–59,400 support zone may invite fresh selling pressure. In such a scenario, short trades (PE positions) can be considered with downside targets at 59,250, 59,150, and 59,050, where strong demand is expected. Until a clear breakout or breakdown occurs, traders should continue with range-based strategies, maintain strict stop-loss discipline, and avoid aggressive positions in the early part of the session.

Gold Before CPI: Top or Trap?Catching Gold’s Top Before CPI: A Good Trade or a Psychological Trap?
🧭 1. STRATEGIC CONTEXT
Primary trend: GOLD remains in an uptrend; the higher-timeframe structure is still intact.
Macro backdrop:
CPI tonight may cause short-term volatility.
However, geopolitics is currently a stronger driver than CPI.
Key geopolitical risks:
Greenland tensions → escalating global strategic rivalry.
Protests in Iran, power and internet cuts → rising Middle East risks.
👉 Strategic implication:
Gold continues to be supported as a safe-haven asset → pullbacks are for buying, not for chasing shorts.
📊 2. CURRENT MARKET STRUCTURE
Price is:
Holding the ascending trendline
Consolidating in a box, compressing ahead of CPI
Market condition:
High probability of false breakouts
Top-catching traps are very likely before the news
📍 3. KEY PRICE LEVELS
🔴 RESISTANCE
4,680 – 4,700
→ Previous high / ATH zone
→ Reactive sells only if clear rejection appears
4,655 – 4,660
→ Intermediate resistance, easily swept pre-CPI
🟣 CONSOLIDATION BOX
4,595 – 4,630
→ Sideways range ahead of CPI
→ No FOMO inside the box
🟢 SUPPORT
4,545 – 4,550 → Major confluence support
4,480 → Medium-term support, trendline retest
4,420 → Deep support, last bullish structure zone
📝 4. IMPORTANT NOTES
Higher CPI:
May trigger a technical pullback
❌ Does NOT automatically mean a top
Lower / in-line CPI:
Gold may consolidate above highs and break ATH
Selling before CPI:
→ Reactive scalps only, no holding
Buying:
→ Only when price reaches key zones with clear reaction
🎯 5. STRATEGIC MINDSET
❌ Don’t force top-catching while geopolitics supports gold
✅ Focus on risk management – wait for zones – wait for confirmation
🧠 Before CPI: survival > profit

Union Bank of India: Long-Term Head & Shoulders PatternUnion Bank of India has delivered a decisive long-term breakout on the monthly timeframe after completing a classic Inverse Head & Shoulders pattern, marking a major structural shift in trend. The pattern has been in formation for several years, with a well-defined left shoulder, a deep head near the bottoming zone, and a higher right shoulder, clearly reflecting gradual accumulation after prolonged weakness.
The most important technical development is the clean breakout above the neckline resistance, which had capped price action for multiple years. This neckline breakout is supported by strong bullish candles, indicating conviction from long-term participants rather than short-term speculation. Such breakouts on higher timeframes often signal the beginning of a multi-year uptrend rather than a temporary rally.
From a projection perspective, the measured move derived from the head-to-neckline height suggests a primary upside target near the 240+ zone, followed by an extended target around 280+. If momentum sustains and the broader banking sector remains supportive, the structure also opens the door for a long-term projected target near 325+, aligning with the full pattern height projection shown on the chart.
Risk remains clearly defined in this setup. As long as the price holds above the neckline breakout zone, the bullish structure remains intact. Any sustained move back below this level would weaken the breakout thesis and shift the view back to consolidation. This makes the trade favorable from a risk–reward standpoint, as downside risk is limited relative to the potential upside.
Overall, Union Bank of India is transitioning from a prolonged basing phase into a new bullish cycle. Such high-timeframe pattern breakouts are often accompanied by volatility in the initial phase, but structurally they favor positional and long-term investors, especially when managed with disciplined risk control.

#NIFTY Intraday Support and Resistance Levels - 14/01/2026A flat opening is expected in Nifty, with the index trading near the 25,700–25,750 zone, which continues to act as an important intraday pivot area. The broader structure remains weak after the recent sharp decline, and price action suggests consolidation rather than immediate trend reversal.
On the upside, a reversal long can be considered only if Nifty sustains above 25,750–25,800. A confirmed hold above this zone may trigger short covering and pull the index towards 25,850, 25,900, and 25,950+. However, upside momentum is likely to remain limited unless price decisively reclaims the 25,950 resistance.
On the downside, 25,700 remains a crucial breakdown level. If the index slips below 25,700, fresh selling pressure may emerge with downside targets at 25,650, 25,550, and 25,500. The 25,500 area is a strong support, and any sustained break below it can extend weakness further.
Overall, the market remains range-bound with a bearish bias. Traders should wait for a clear breakout above resistance or breakdown below support, follow strict risk management, and avoid aggressive positions during the initial phase of the session.

[INTRADAY] #BANKNIFTY PE & CE Levels(14/01/2026)A flat opening is expected in Bank Nifty, with price hovering around the 59,500–59,600 zone, which is acting as an intraday equilibrium area. Recent price action shows range-bound behavior with sharp intraday swings, indicating indecision and a lack of fresh directional cues.
On the upside, a sustained move above 59,550 will be important to trigger bullish momentum. If the index holds above this level, CE buying can be considered with upside targets at 59,750, 59,850, and 59,950+. A decisive breakout above 59,950 may open the door for a stronger recovery move.
On the downside, rejection near current levels and a break below 59,450–59,400 can invite selling pressure. In that case, PE positions may work for targets at 59,250, 59,150, and 59,050, where strong support is placed near 59,050. A breakdown below this support could accelerate downside momentum.
Overall, the structure remains range-bound. It is advisable to trade only after a clear level breakout or breakdown, maintain strict stop-losses, and avoid overtrading until a decisive move emerges.

#NIFTY Intraday Support and Resistance Levels - 13/01/2026A flat opening is expected in Nifty 50, with the index trading near the 25,800–25,820 zone, which is acting as a short-term balance area after the recent sharp recovery from lower levels. The bounce from the 25,500–25,550 support zone indicates short-covering and selective buying, but overall price action still reflects a cautious and range-bound environment. The market is currently waiting for a clear directional trigger before committing to a stronger move.
On the upside, a sustained hold above 25,850–25,900 will be crucial to confirm bullish continuation. If this zone is reclaimed and held, long positions can be considered with upside targets at 25,950, 26,000, and 26,050+. A decisive breakout above 25,950 may invite fresh buying momentum and improve short-term sentiment.
On the downside, failure to sustain above 25,750 may weaken the recovery attempt. A break below 25,700 can reintroduce selling pressure, opening downside targets at 25,650, 25,550, and 25,500-, where strong demand is expected again. Until a clear breakout or breakdown occurs, traders should continue to focus on range-based trades, keep strict stop-losses, and avoid aggressive directional bets.
[INTRADAY] #BANKNIFTY PE & CE Levels(13/01/2026)A flat opening is expected in Bank Nifty, with the index trading near the 59,500–59,550 zone, which is acting as an important intraday pivot area. Price action suggests continued consolidation after the recent sharp recovery from lower levels, indicating balanced participation from both buyers and sellers. The overall structure remains range-bound, and a decisive move beyond key levels is required for clear direction.
On the upside, a sustained move above 59,550 will be the key trigger for bullish momentum. Holding above this level can open the door for long trades, with upside targets placed at 59,750, 59,850, and 59,950+. A strong breakout above the 59,950 resistance may further accelerate upside toward higher zones.
On the downside, if Bank Nifty fails to hold the 59,450–59,400 support, selling pressure may re-emerge. In such a scenario, short positions can be considered with downside targets at 59,250, 59,150, and 59,050-. Until a clear breakout occurs on either side, traders are advised to stick to range-based trading, maintain strict stop-loss discipline, and avoid aggressive directional positions.
