RAIN: Turnaround Fundamental Play,Trendline BO,Chart of the WeekNSE:RAIN When Carbon Giants Face the Perfect Storm of Bearish Signals and Sectoral Headwinds NSE:RAIN showing signs of Fundamental Turnaround. Let's understand this week's "chart of the week"
As per the Latest SEBI Mandate, this isn't a Trading/Investment RECOMMENDATION nor for Educational Purposes; it is just for Informational purposes only. The chart data used is 3 Months old, as Showing Live Chart Data is not allowed according to the New SEBI Mandate.
Disclaimer: "I am not a SEBI REGISTERED RESEARCH ANALYST AND INVESTMENT ADVISER."
This analysis is intended solely for informational purposes and should not be interpreted as financial advice. It is advisable to consult a qualified financial advisor or conduct thorough research before making investment decisions.
Price Action Analysis:
Long-Term Trend Structure:
- The stock demonstrated a spectacular bull run from 2021 lows around ₹75-80 levels to highs of ₹272.75 achieved in mid-2021
- Post the euphoric rally, the stock entered a prolonged consolidation and distribution phase spanning from July 2021 to early 2024
- During 2022-2023, the stock oscillated in a broad range between ₹130 and ₹ 220, forming a rectangular consolidation pattern
- From late 2023 onwards, the stock began showing signs of weakness with lower highs formation
Current Breakdown Phase (2024-2025):
- A decisive breakdown occurred in late 2024 when the stock breached the crucial ₹140-145 support zone
- The stock has entered a steep declining phase, currently trading around ₹124.60 (as of Dec 20, 2025)
- The recent price action shows a sharp downturn with the stock making new 52-week lows at ₹99.90
Volume Spread Analysis:
Volume Trends:
- A massive volume spike is visible in the most recent sessions, reaching approximately 36.64 million shares
- This represents nearly 4x the average weekly volume of around 9.36 million shares
- Historical volume analysis shows earlier spikes during the 2021 peak (around 80 million) and the 2024 rally attempts
Key Technical Levels:
Support Zones:
- Major Support: ₹99.90 - The recent 52-week low and next critical support level
- Psychological Support: ₹100 - Round number support with psychological significance
- Ultimate Support: ₹80-85 zone - Corresponds to early 2023 lows
Resistance Zones:
- Immediate Resistance: ₹135-140 - Previous support turned resistance
- Minor Resistance: ₹150-155
- Major Resistance: ₹165-170
- Strong Resistance: ₹180-185 - Breakdown point of the larger distribution pattern
- Formidable Resistance: ₹200-210 - Multiple failed rally attempts from this zone
Base Formation Analysis:
- No clear base formation is visible in the current structure
- The stock is in an active downtrend without any consolidation base
- The previous base was formed between ₹140-180 during 2023-2024, which has now failed
- A new base formation would require at least 2-3 months of sideways consolidation
- An ideal base would form above the ₹100 psychological level with declining volume
Sectoral Overview:
Industry Classification:
- Rain Industries operates in the Chemicals and Petrochemicals sector
- Specifically focused on Carbon Products, Advanced Materials, and Cement segments
- The company is a leading vertically integrated producer of calcined petroleum coke (CPC) and coal tar pitch (CTP)
- Products serve the aluminium, steel, graphite electrodes, and construction industries
Global Market Position:
- Rain Industries is among the world's largest producers of calcined petroleum coke
- The company is the largest coal tar distiller globally
- Operations span across 14 locations in 8 countries across three continents
- Annual production capacity: 2.4 million tons of CPC and 1.0 million tons of tar distillation
Sectoral Challenges (2024-2025):
- The aluminium industry, which accounts for approximately 42% of Rain's revenues, has faced headwinds
- Global aluminium production continues to expand to meet growing demand, with LME aluminium prices trading around $2,600 per ton
- European aluminium smelters face structural decline pressures due to high energy costs
- Raw material availability constraints have impacted production schedules
- Supply chain issues and challenges in securing raw materials could impact production and costs
Sector Outlook for 2025-2026:
- The global aluminium market is projected to reach $355 billion by 2030, expanding at a CAGR of approximately 4.8%
- Demand growth expected from the automotive industry's lightweighting trend and electric vehicle adoption
- Increasing emphasis on low-carbon aluminium and sustainability initiatives
- Aluminium's recyclability has become significant, with recycling requiring only 5% of the energy needed for primary production
- Infrastructure spending in India and globally should support aluminium and construction material demand
Fundamental Backdrop:
Recent Financial Performance:
- Q3 FY2025 revenue stood at ₹44.76 billion with adjusted EBITDA of ₹6.48 billion
- Q2 2025 showed revenue growth of 17% quarter-over-quarter, driven by higher CPC volumes and prices
- The company operates at approximately 90% capacity utilization
- For Q2 FY2026, the company posted a profit of ₹106.01 crore, reversing a ₹179.11 crore loss year-over-year
Business Segment Performance:
- Carbon Segment: Largest revenue contributor with sales volumes of 664,000 MT in Q2 FY2025
- Advanced Materials: Showed 317% EBITDA growth quarter-over-quarter due to improved seasonality
- Cement Business: Faces challenges, but outlook is improving with infrastructure spending
- Company approved ₹7.57 billion cement expansion with commercial operation date in H2 2027
Financial Health Concerns:
- The company has a low interest coverage ratio and delivered poor sales growth of 4.46% over the past five years
- Return on equity is negative at -0.31% over the last 3 years
- Market capitalization as of November 27, 2025, stood at ₹3,619.08 crore
- High net debt of $699 million could constrain financial flexibility
- PE ratio of -104.48 indicates negative earnings
Recent Developments:
- The company declared a dividend of ₹1.00 per share in June 2025, yielding 1.58%
- Safety performance improved significantly with the Total Recordable Incident Rate decreasing to 0.03 in H1 2025
- Management focusing on cost-saving measures, ESG compliance, and debt optimisation
- Company investigating application of biocarbon materials in its product portfolio
Valuation Metrics:
- 52-week high: ₹180 (touched in early 2025)
- 52-week low: ₹99.80
- Current price: ₹124.60
- Price-to-Book ratio: 0.60 (as of Dec 2025)
- Stock down approximately -27.80% year-over-year, underperforming Sensex's 9.5% gain
Risk Factors and Challenges:
Operational Risks:
- Dependence on raw material availability, particularly green petroleum coke
- Energy cost volatility, especially in European operations
- Capacity utilization challenges impacting profitability
- Competition in battery materials and advanced materials segments
- Planned maintenance activities disrupting production schedules
Market and Sectoral Risks:
- Aluminium industry demand uncertainty in the European and US markets
- Geopolitical tensions affecting global trade and supply chains
- China's production nearing regulatory ceiling could trigger market distortions
- Regulatory changes and environmental compliance costs are increasing
- Potential tariff impacts on international trade
Financial Risks:
- High debt levels constrain strategic flexibility
- Negative operating cash flow concerns
- Low profitability margins despite revenue growth
- Currency fluctuation risks due to global operations
- Interest coverage ratio remaining weak
My 2 Cents:
Fundamental vs Technical Divergence:
- While the company shows operational improvement in recent quarters, market sentiment remains negative
- The gap between fundamental progress and stock performance is widening
- High debt levels and sectoral headwinds overshadow operational gains
- Market positioning the stock as a value trap rather than a value opportunity currently
- Investor confidence needs restoration through consistent delivery and debt reduction
NSE:RAIN represents a classic case of a fundamentally improving company caught in a perfect storm of technical breakdown, sectoral headwinds, and erosion of sentiment. The chart structure has deteriorated significantly, with the stock breaking below multi-year support zones and displaying all characteristics of a sustained downtrend. While the aluminium sector outlook for 2025-2026 appears constructive and the company has shown operational improvements, the market is clearly sceptical about near-term prospects given the high debt burden and challenging market environment.
The coming months will be crucial in determining whether Rain Industries can stabilise around the psychological ₹100 mark or if further capitulation to ₹85-90 levels is in store. Only a decisive reclaim of ₹140 with volume would suggest that the worst is behind, making it a level to watch closely for any signs of trend reversal.
Full Coverage on my Newsletter this Week
Keep in the Watchlist and DOYR.
NO RECO. For Buy/Sell.
📌Thank you for exploring my idea! I hope you found it valuable.
🙏FOLLOW for more
👍BOOST if you found it useful.
✍️COMMENT below with your views.
Meanwhile, check out my other stock ideas on the right side until this trade is activated. I would love your feedback.
As per the Latest SEBI Mandate, this isn't a Trading/Investment RECOMMENDATION nor for Educational Purposes; it is just for Informational purposes only. The chart data used is 3 Months old, as Showing Live Chart Data is not allowed according to the New SEBI Mandate.
Disclaimer: "I am not a SEBI REGISTERED RESEARCH ANALYST AND INVESTMENT ADVISER."
This analysis is intended solely for informational purposes and should not be interpreted as financial advice. It is advisable to consult a qualified financial advisor or conduct thorough research before making investment decisions.
Priceactionanalysis

Nifty 50 spot 25966.40 by Daily Chart view - Weekly UpdateNifty 50 spot 25966.40 by Daily Chart view - Weekly Update
- Nifty has closed within Support Zone range upper end
- Support Zone remains steady at 25710 to 26010 for Nifty Index
- Resistance Zone stands firmly at 26200 to ATH 26325.80 for Nifty Index
- Volumes synced closely with avg traded quantity over the entire past weeks
- Falling Resistance Trendline Breakout in a steady making process by weekly closure

Bank Nifty spot 59069.20 by the Daily Chart view - Weekly UpdateBank Nifty spot 59069.20 by the Daily Chart view - Weekly Update
- Bank Nifty has closed within the Support Zone range
- Support Zone sustained at 58850 to 59375 for Bank Nifty
- Resistance Zone stands firmly at 59825 to ATH 60114.30 for Bank Nifty
- Volumes in close sync with avg traded quantity over with intermittent spikes
- Falling Resistance Trendline weighing hard for Bank Nifty has closed below trendline

#NIFTY Intraday Support and Resistance Levels - 19/12/2025A flat opening is expected in Nifty 50, with the index continuing to trade within a well-established consolidation range seen over the last several sessions. Price is currently hovering around the 25,800–25,850 zone, which is acting as a short-term balance area. This reflects ongoing indecision in the market, where buyers are showing interest near lower supports while sellers remain active near overhead resistance, keeping the index range-bound.
On the upside, a reversal long opportunity can be considered near the 25,750–25,800 support zone, provided the index shows stability and holds above this area. A successful bounce from this zone can lead to an upside move toward 25,850, 25,900, and 25,950+. A stronger bullish signal will emerge only if the index sustains above 25,950, which could invite fresh buying and shift momentum in favor of bulls.
On the downside, if the index faces rejection near 25,950–25,900, selling pressure may resume. In such a scenario, short positions can be considered with downside targets at 25,850, 25,800, and 25,750-. A decisive breakdown below 25,700 will strengthen the bearish bias and may open further downside toward 25,650, 25,550, and 25,500-. Until a clear breakout or breakdown occurs, traders are advised to focus on range-based trades, maintain strict risk management, and avoid aggressive directional positions.

[INTRADAY] #BANKNIFTY PE & CE Levels(19/12/2025)A flat opening is expected in Bank Nifty, with the index continuing to trade within a tight consolidation range formed over the last few sessions. Price is currently hovering around the 58,900–59,000 zone, which is acting as a short-term balance area. This indicates hesitation in the market, where buyers and sellers are evenly placed, and a clear directional move is still awaited for conviction.
On the upside, a sustained move above 59,050–59,100 will be the key trigger for bullish momentum. If Bank Nifty manages to hold above this resistance zone, buying can be considered, with upside targets placed at 59,250, 59,350, and 59,450+. A decisive breakout above this level may invite follow-through buying and push the index toward higher resistance levels.
On the downside, if the index fails to hold the 58,950–58,900 support zone, selling pressure may accelerate. In such a scenario, selling can be considered with downside targets at 58,750, 58,650, and 58,550-, where strong demand is expected. Until a clear breakout or breakdown occurs, traders should continue to focus on range-based trading setups, keep strict stop-loss discipline, and avoid aggressive positional trades.

IDFC First Bank cmp 83.79 by Weekly Chart viewIDFC First Bank cmp 83.79 by Weekly Chart view
- Support Zone 66 to 75 Price Band
- Resistance Zone 84 to 93 then ATH 100.70
- Bullish Cup and Handle setup made on the chart
- Falling Resistance Trendlines Breakouts well sustained
- Volumes are in close sync with the average traded quantity

XAUUSD is ranging before CPI direction comes after the news.Gold is currently consolidating sideways near the upper zone around 434x as the market awaits inflation data and updates from the BOJ. Short-term volatility may occur, but the overall structure remains intact, with no clear breakout signal seen in the previous session.
Before the news, the preferred strategy is to trade within the range. Traders can look for reaction setups when price approaches 4346–4348, with a mandatory stop-loss, as this area has been tested multiple times.
After the news is released, the market is expected to choose a new direction. If price breaks and holds firmly above the 435x zone, the bullish trend will be confirmed. In that case, the focus shifts to buying the breakout, with targets toward the previous high and potentially a new ATH.
👉 Before the news: trade the range – react at key levels.
👉 After the news: wait for confirmation – follow the trend.

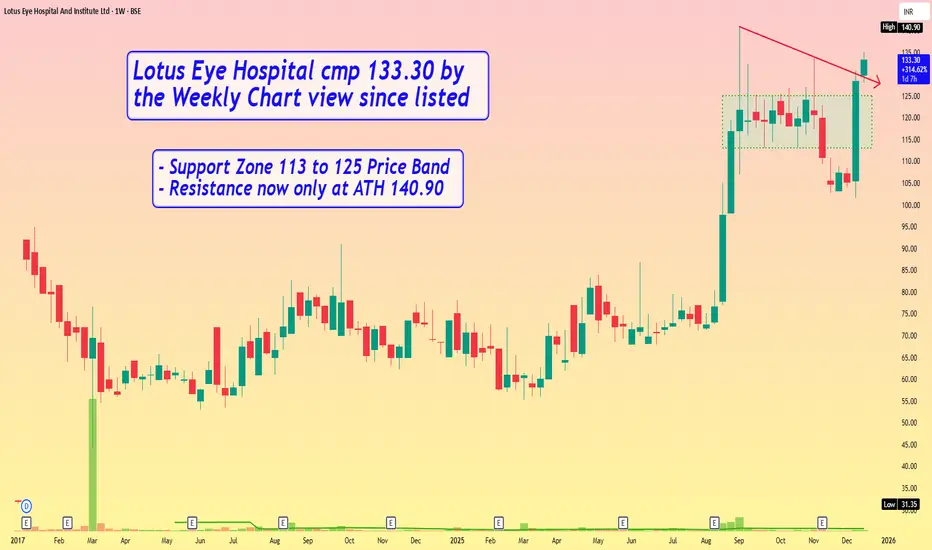
Lotus Eye Hospital cmp 133.30 by Weekly Chart view since listedLotus Eye Hospital cmp 133.30 by Weekly Chart view since listed
- Support Zone 113 to 125 Price Band
- Resistance now only at ATH 140.90
BANKNIFTY at a Make-or-Break ZoneNIFTYBANK is currently trading at a critical confluence zone where a downward-sloping resistance trendline is meeting a well-defined rising support area on the 1-hour timeframe. This price compression indicates indecision and typically precedes a sharp directional move. The index has repeatedly respected both these levels, confirming their importance in the current structure.
On the upside, the falling resistance zone near 59,300–59,500 remains the key hurdle. A sustained breakout and close above this trendline would signal a shift in short-term momentum, opening the door for a recovery move toward 59,800 initially, followed by a potential extension toward the 60,400–60,600 zone. Such a breakout would also indicate that buyers are regaining control after the recent corrective phase.
On the downside, the green support zone around 58,700–58,850 is the immediate demand area to watch. This zone has acted as a base multiple times, and as long as Bank Nifty holds above it, pullbacks may continue to attract buyers. However, a decisive breakdown below this support would invalidate the bullish bounce scenario and could accelerate selling pressure toward 58,300 first, with a deeper downside extension possible toward the 57,200 region.
Overall, BANKNIFTY is trading inside a tightening range, signaling an imminent volatility expansion. Directional clarity will emerge only after a confirmed breakout or breakdown. Traders should remain cautious at current levels and wait for confirmation, as this is a classic decision zone where false moves are also common.

#NIFTY Intraday Support and Resistance Levels - 18/12/2025A flat opening is expected in Nifty 50, with the index continuing to trade inside a well-defined consolidation range formed over the last few sessions. Price is currently hovering near the 25,800–25,850 zone, which is acting as a short-term balance area. This indicates that the market remains range-bound, with traders waiting for a decisive breakout or breakdown before committing to a strong directional move.
On the upside, a sustained move above 26,050 will be the key trigger for fresh bullish momentum. If Nifty manages to hold above this resistance level, long positions can be considered, with upside targets placed at 26,150, 26,200, and 26,250+. Additionally, a reversal long trade can be considered near the 25,750–25,800 support zone, provided price shows stability, targeting 25,850, 25,900, and 25,950+.
On the downside, if the index faces rejection near 25,950–25,900, selling pressure may emerge. In such a case, short positions can be initiated with downside targets at 25,850, 25,800, and 25,750-. A stronger bearish continuation will be confirmed if Nifty breaks below 25,700, which may open further downside toward 25,650, 25,550, and 25,500-. Until a clear directional breakout occurs, traders are advised to trade within the range, maintain strict risk management, and avoid over-leveraging.

[INTRADAY] #BANKNIFTY PE & CE Levels(18/12/2025)A flat opening is expected in Bank Nifty, with the index continuing to trade within a defined consolidation range seen over the last few sessions. Price is hovering near the 58,950–59,000 zone, which is acting as an important short-term balance area. This indicates indecision in the market, where both buyers and sellers are waiting for a clear directional trigger before committing aggressively.
On the upside, a sustained move above 59,050–59,100 will be crucial to revive bullish momentum. If Bank Nifty manages to hold above this resistance zone, buying positions can be considered. In such a scenario, the upside targets are placed at 59,250, 59,350, and 59,450+. A clean breakout above this level may attract fresh buying and push the index toward the upper resistance band near 59,450.
On the downside, if the index fails to hold the 58,950–58,900 support zone, selling pressure may intensify. A breakdown below this area opens up opportunities to selling, with downside targets at 58,750, 58,650, and 58,550-, where strong support is expected. Until a decisive breakout or breakdown occurs, traders are advised to stick to range-bound strategies, maintain strict stop-loss discipline, and avoid aggressive directional trades.

Nifty50 at a Crucial Inflection Zone:Break Will Decide DirectionNifty 50 is currently trading near a well-defined horizontal support zone around 25,750–25,800, which has acted as a demand area multiple times on the 2-hour timeframe. After facing repeated rejection from the falling trendline resistance, the index has moved back into this support cluster, making the current zone extremely important from a short-term perspective.
The broader structure shows a sequence of lower highs, with price respecting the descending trendline marked as resistance. Until this trendline is decisively broken, upside moves may face supply pressure near the 25,950–26,000 region. A clean breakout and sustained close above this resistance would signal a shift in momentum and can trigger a pullback-to-breakout move toward 26,200–26,300 in the next leg.
On the downside, the support zone remains the key line of defense for bulls. If Nifty fails to hold the 25,750 area and breaks below it with conviction, the structure opens up for a deeper retracement toward 25,500 initially, followed by the broader downside target near 25,300. This would confirm continuation of the short-term corrective phase.
Overall, Nifty is currently in a compression phase between falling resistance and horizontal support. A breakout on either side will define the next directional move. Traders should remain patient and let price confirm the bias, as this is a classic “decision zone” where volatility expansion is likely once the range resolves.

Chumtrades XAUUSD Sideway Trading PlanMarket View
Gold is currently moving within a clear sideway structure, with no confirmed signal for a new trend. Price action suggests accumulation and rotation inside defined ranges.
Sideway Structure
Small H4 Box (inner range):
Upper boundary: 4335
Lower boundary: 4290
This is the main short-term trading box where price is reacting most frequently.
Large Sideway Box (outer range):
Upper boundary: 435X
Pay attention to 434X (around 4340–4342)
Lower boundary: 4270
A deeper extension may reach 4256
Intraday Expectation
Sideway behavior remains the primary scenario.
Trading approach:
Sell near the top of the range
Buy near the bottom of the range
No major news today, no clear breakout catalyst.
Risk Note
Manage risk carefully and stay alert for false breakouts.
If price closes decisively outside the larger box, reassess the structure.

XAUUSD – Continuation Update | Buy Trade Progressing as PlannedAfter the earlier move and corrective phase, Gold once again respected the previous high → support zone, confirming that buyers were still defending structure.
🔹 Buy Trade Recap:
Entry taken after structure held above support
Price dipped close to SL, but never broke structure
Liquidity was grabbed, weak hands shaken out
Market respected demand and expanded upward
🎯 TP1 hit successfully
Partial profits secured as planned.
🔹 Current Status:
Buy position still active
Targeting TP2
SL protected and trade managed
This trade is a reminder:
Markets don’t reward impatience.
They reward those who trust their analysis and manage risk.
Almost stopped out, yes — but structure stayed intact.
And that’s all that matters.
Patience is not passive.
It’s a position.
#XAUUSD #Gold #TradeManagement #SmartMoney #TradingView #ValhallaCore

#NIFTY Intraday Support and Resistance Levels - 17/12/2025A gap-up opening near 25,950 is expected in Nifty 50, placing the index once again inside the well-defined consolidation range that has been holding for the past few sessions. The price is hovering around the 25,950–26,000 zone, which continues to act as a short-term equilibrium area, indicating a balance between buyers and sellers. This structure suggests that the market is still undecided, and a clear breakout on either side is required to establish directional strength.
On the upside, a sustained move above 26,050 will be the key signal for bullish continuation. If the index manages to hold above this level with strong price acceptance, long positions can be considered. The immediate upside targets will be 26,150, 26,200, and 26,250+. A decisive breakout above this resistance zone may trigger fresh buying momentum and short covering, pushing the index toward higher resistance levels.
On the downside, failure to sustain above the 25,950–25,900 zone may result in renewed selling pressure. A rejection from this area would open the door for short trades, with downside targets placed at 25,850, 25,800, and 25,750-, where strong demand and previous support are expected. Until Nifty delivers a confirmed breakout or breakdown, traders should stick to range-based setups, maintain strict stop-loss discipline, and avoid aggressive directional positions.

[INTRADAY] #BANKNIFTY PE & CE Levels(17/12/2025)A flat opening is expected in BankNifty, with price continuing to trade within the same well-defined range seen in the previous sessions. The index is hovering around the 59,000–59,050 zone, which is acting as an important short-term support area. As long as this level is protected, the market may attempt a pullback toward higher resistance levels, but overall momentum remains neutral unless a breakout occurs.
On the upside, a move above 59,050–59,100 can be used as a buy-on-dips opportunity for buying, with upside targets at 59,250, 59,350, and 59,450+. A stronger bullish confirmation will come only if BankNifty sustains above 59,550, post which buying above 59,550 can aim for 59,750, 59,850, and 59,950+.
On the downside, 59,450–59,400 remains a crucial resistance zone where selling can be considered for downside targets at 59,250, 59,150, and 59,050-. If the index decisively breaks below 58,950, further weakness may unfold, opening targets toward 58,750, 58,650, and 58,550-. Until a clear breakout or breakdown is seen, traders should continue to focus on range-bound strategies with disciplined risk management.

Chumtrades XAUUSD Trading Plan NF todayMarket Psychology
Expect price to range sideways before a clear breakdown.
Market is waiting for NFP, smart money stays cautious → focus on range trading (4330–4280).
🔴 Resistance (Key Resistance)
4335 – 4340
4318 – 4322
Support (Key Support)
4260 → Short-term lower range
424X → Swing BUY zone
4204 → Deep pullback, strong swing BUY area
🎯 Trading Expectation
Before news:
Trade the range
Sell high – Buy low
Avoid FOMO in the middle
After news / Breakdown:
Look for deep BUY entries
Focus on 424X – 4204

#NIFTY Intraday Support and Resistance Levels - 16/12/2025A flat opening is expected in Nifty 50, with price continuing to respect the same consolidation structure observed over the last few sessions. The index is trading near 26,000, which is acting as a short-term equilibrium zone where buying and selling pressure are evenly matched. This confirms that the market is still in a wait-and-watch mode, requiring a clear breakout for directional conviction.
On the upside, a sustained move above 26,050 will be the key trigger for bullish momentum. Holding above this level can open the path for long trades, with upside targets placed at 26,150, 26,200, and 26,250+. A clean breakout above this resistance may invite follow-through buying toward higher levels.
On the downside, if the index fails to hold 25,950–25,900, selling pressure may increase. In such a scenario, short positions can be considered with downside targets at 25,850, 25,800, and 25,750-, where strong demand is expected. Until a decisive breakout occurs, traders should continue to focus on range-based trades, using strict risk management and avoiding aggressive directional bets.

[INTRADAY] #BANKNIFTY PE & CE Levels(16/12/2025)A flat opening is expected in Bank Nifty, with the index continuing to trade within the same defined range seen over the last few sessions. Price is currently hovering around 59,450, which remains a key pivot area where repeated rejections and short-term buying have occurred. This clearly highlights a consolidation phase, suggesting that the market is waiting for a decisive breakout to establish direction.
On the upside, a sustained move above 59,550 will be a positive signal. Holding above this level can trigger buying, with upside targets placed at 59,750, 59,850, and 59,950+. A breakout above this zone may gradually shift momentum toward the psychological 60,000 level.
On the downside, failure to sustain above 59,450–59,400 may invite fresh selling pressure. In that case, selling positions can be considered, with downside targets at 59,250, 59,150, and 59,050-, where strong support is placed. Until price breaks decisively on either side, traders should expect range-bound movement, focusing on level-based trades and strict risk management rather than directional aggression.

Daily analysis: NIFTY 15.12.2025A mixed sentiment is there for Nifty. Although the fall in the morning has filled Friday's gap, prices are expected to fill today's gap as well. But for any buy, a retest of support is suggested.
Levels are mostly for intraday purposes, except for the sell-side 25660sh range.

Eternal Ltd at a Critical Make-or-Break Zone – Long OpportunityEternal Ltd is currently trading near a well-defined demand and trendline support zone after a sharp corrective phase from its recent highs. The price action suggests that selling pressure is gradually losing strength, and the stock is attempting to stabilize around the 285–290 range. This area is technically important, as it aligns with a rising long-term trendline and acts as a base where buyers have previously stepped in.
From a moving average perspective, price is still trading below the short-term EMA, indicating that the trend reversal is not yet fully confirmed. However, the stock is holding above the major support zone and showing signs of recovery from intraday lows. A sustained move above the near-term resistance around 300–305 would be the first indication of strength and could shift the short-term bias toward bullish.
The RSI structure adds an important clue to this setup. After remaining in the lower zone for some time, RSI is attempting a bullish reversal from oversold territory. This positive divergence-like behavior indicates improving momentum and increases the probability of a relief rally. If RSI continues to move upward and sustains above the 50 zone, it would further validate the bullish case.
In the bullish scenario, once price holds above 300 on a closing basis, the stock can gradually move toward the first upside objective near 313. A breakout and hold above this level could open the path toward the next resistance around 335, followed by the extended target zone near 360 in the medium term. These targets are expected to be achieved in phases, with intermittent consolidations.
On the downside, the risk remains clearly defined. A decisive breakdown below the 280 support zone would invalidate the bullish setup and may lead to further downside pressure. Hence, this is not a confirmed breakout trade yet, but rather an early-stage opportunity near strong support where risk-to-reward remains favorable if managed properly.
Overall, Eternal Ltd is presenting a potential long opportunity near its base, supported by structure and improving momentum. Traders should wait for confirmation above resistance levels for higher conviction, while positional participants may track this zone closely with strict risk management in place.

#NIFTY Intraday Support and Resistance Levels - 15/12/2025A flat opening is expected in Nifty, with price continuing to respect the same key levels observed in previous sessions. The index remains trapped inside a well-defined consolidation range, with 25,954–26,051 acting as the immediate supply–demand zone. The lack of fresh momentum indicates that the market is waiting for a decisive trigger before choosing direction.
On the upside, a sustained move above 26,050 will be the first sign of strength. If Nifty manages to hold above this level, long opportunities can open up toward 26,150, 26,200, and 26,250+, aligning with the upper resistance zone marked on the chart. Any breakout above this zone should ideally be supported by strong volume for confirmation.
On the downside, failure to hold the consolidation zone and a move below 25,950–25,900 may invite selling pressure. In such a scenario, short trades can be considered with downside targets at 25,850, 25,800, and 25,750-, where previous buying interest was seen. Until a clear breakout or breakdown occurs, traders should expect range-bound movement, focusing on level-based trades with disciplined risk management.

[INTRADAY] #BANKNIFTY PE & CE Levels(15/12/2025)A flat opening is expected in Bank Nifty, indicating a continuation of the ongoing range-bound structure. Price is currently trading between the immediate resistance zone of 59,450–59,550 and the support zone near 59,050, showing clear signs of consolidation after the recent volatile moves. This zone has repeatedly acted as a decision area where both buyers and sellers are active, suggesting that directional clarity will come only after a decisive breakout or breakdown.
On the upside, a sustained move above 59,550 will signal strength and can be used as a buying opportunity in buying, with upside targets placed at 59,750, 59,850, and 59,950+. A strong hold above this resistance can invite fresh momentum-driven buying, pushing Bank Nifty back toward the psychological 60,000 zone.
On the downside, if the index slips below 59,450–59,400, selling pressure may increase. In that case, selling can be considered, with downside targets at 59,250, 59,150, and 59,050-. The 59,050 level remains a crucial support, and any breakdown below this zone may accelerate further weakness. Until a clear breakout occurs, traders should expect range-bound price action with intraday opportunities near the mentioned levels, keeping strict risk management in place.
