Silver Weekly Outlook: Post-Exhaustion PhaseSilver has entered a high-volatility post-exhaustion phase after a sharp parabolic rise followed by an equally aggressive correction. The weekly chart clearly shows that price moved too far, too fast, and the recent sell-off is a classic example of mean reversion after euphoric buying. Such phases rarely resolve in a straight line and typically evolve into consolidation, base-building, or deeper corrective structures.
At current levels, Silver is hovering near an immediate demand zone around the 80–85 region, which now acts as a crucial decision area. This zone represents the first major area where buyers are expected to defend aggressively. The way price behaves here will define the next medium-term trend.
Scenario A – Range / Base Formation (High Probability):
The most probable outcome at this stage is sideways consolidation. After a vertical fall, markets often need time to absorb supply and rebuild demand. If Silver manages to hold above the immediate demand zone and starts forming higher lows on lower timeframes, it would indicate base formation rather than trend failure. This scenario favors range traders and patient positional participants, as price may oscillate between support and overhead resistance for several weeks or months.
Scenario B – Breakdown Continuation (Moderate Probability):
If the current support zone fails decisively with strong weekly closes below it, Silver could enter a deeper corrective phase. In such a case, price may gravitate toward the next major demand zone near 73–75, which aligns with prior consolidation and breakout structure. This move would likely be driven by broader risk-off sentiment or macro pressure rather than technical weakness alone. Traders should avoid aggressive longs if this breakdown structure develops.
Scenario C – Bullish Reclaim and Bounce (Low Probability, Needs Confirmation):
A less likely but still possible outcome is a bullish reclaim, where Silver holds current levels, absorbs selling pressure, and reclaims the 90+ zone with strong weekly confirmation. For this scenario to gain credibility, price must show acceptance above resistance with volume and structure. Until then, any bounce should be treated as reactive and corrective, not a confirmed trend reversal.
From a structural perspective, the major resistance remains far above near the 115–120 zone, which was the distribution area before the sharp reversal. This level will act as a long-term supply cap unless Silver builds a strong base over time.
In summary, Silver is no longer in a trending phase but in a transition zone. Patience is critical here. Traders should focus less on prediction and more on reaction to price behavior at key demand levels. Let structure, confirmation, and risk management guide decisions, as this phase can easily trap both early bulls and aggressive bears if approached without discipline.
Priceprediction

#BANKNIFTY PE & CE Levels(23/01/2026)A flat opening is expected in Bank Nifty, indicating a pause after the recent volatile swings and suggesting that the market is entering a short-term consolidation phase. Price action over the last few sessions clearly shows sharp intraday moves on both sides, followed by quick pullbacks, which reflects indecision and lack of strong directional conviction among participants. This kind of structure usually favors level-based trading rather than aggressive trend-following trades, especially during the first half of the session.
From a technical perspective, the 59050–59100 zone is acting as a crucial intraday pivot and demand area. As long as Bank Nifty holds above this region, the bias remains mildly positive with scope for a gradual upside move. Sustained trading above 59100 can trigger fresh long interest and short covering, which may push the index towards 59250, followed by 59350 and 59450+. However, this upside is likely to be slow and grindy, not impulsive, unless there is a strong breakout candle with volume confirmation above the higher resistance.
On the flip side, the 59450–59400 zone continues to behave as a strong supply and selling area. Any rejection from this region, especially if the price forms long upper wicks or fails to sustain above it, can invite renewed selling pressure. In such a scenario, PE buying near 59450–59400 becomes valid, with downside targets towards 59250, then 59150, and 59050. This makes the 59400–59500 band a critical area where traders should be extremely cautious and avoid chasing breakouts without confirmation.
If selling pressure intensifies and Bank Nifty breaks decisively below 59050, the structure may again turn weak. A breakdown below this support can open the gates for a deeper correction towards 58950–58900, and further down to 58750, 58650, and 58550. These lower levels are strong higher-timeframe supports, so any sharp fall into these zones could again attract bounce-based buying, keeping volatility elevated.
Overall, the broader trend still leans sideways to mildly bearish, with repeated failures near resistance and limited follow-through on rallies. Traders should focus on support-resistance reactions, avoid overtrading during choppy moves, and wait for clear confirmation before committing to large positions. A disciplined approach with strict risk management will be crucial, as Bank Nifty is likely to remain range-bound with sudden spikes on either side during the session.

[INTRADAY] #BANKNIFTY PE & CE Levels(23/12/2025)A gap-up opening is expected in Bank Nifty, with the index showing a positive bias at the start of the session while continuing to trade within the broader consolidation range formed over the last few days. Price is currently hovering around the 59,250–59,300 zone, which has been acting as a short-term balance area. This indicates that despite the expected gap-up, the market is still awaiting a strong breakout for clear directional strength.
On the upside, a sustained move above 59,050–59,100 will be the first sign of bullish continuation. Holding above this zone can open opportunities for buying, with upside targets placed at 59,250, 59,350, and 59,450+. If Bank Nifty manages to break and sustain above the 59,550 level, momentum can further accelerate toward 59,750, 59,850, and 59,950+, where strong resistance is placed.
On the downside, if the gap-up fails to hold and the index slips back below 59,050, selling pressure may emerge. In such a scenario, selling can be considered with downside targets at 58,950, 58,750, 58,650, and 58,550-. Until a decisive breakout above resistance or breakdown below support is confirmed, traders should focus on range-based trades, maintain tight stop losses, and avoid aggressive directional positions in this consolidation-driven environment.

BANKNIFTY at a Make-or-Break ZoneNIFTYBANK is currently trading at a critical confluence zone where a downward-sloping resistance trendline is meeting a well-defined rising support area on the 1-hour timeframe. This price compression indicates indecision and typically precedes a sharp directional move. The index has repeatedly respected both these levels, confirming their importance in the current structure.
On the upside, the falling resistance zone near 59,300–59,500 remains the key hurdle. A sustained breakout and close above this trendline would signal a shift in short-term momentum, opening the door for a recovery move toward 59,800 initially, followed by a potential extension toward the 60,400–60,600 zone. Such a breakout would also indicate that buyers are regaining control after the recent corrective phase.
On the downside, the green support zone around 58,700–58,850 is the immediate demand area to watch. This zone has acted as a base multiple times, and as long as Bank Nifty holds above it, pullbacks may continue to attract buyers. However, a decisive breakdown below this support would invalidate the bullish bounce scenario and could accelerate selling pressure toward 58,300 first, with a deeper downside extension possible toward the 57,200 region.
Overall, BANKNIFTY is trading inside a tightening range, signaling an imminent volatility expansion. Directional clarity will emerge only after a confirmed breakout or breakdown. Traders should remain cautious at current levels and wait for confirmation, as this is a classic decision zone where false moves are also common.

[INTRADAY] #BANKNIFTY PE & CE Levels(15/12/2025)A flat opening is expected in Bank Nifty, indicating a continuation of the ongoing range-bound structure. Price is currently trading between the immediate resistance zone of 59,450–59,550 and the support zone near 59,050, showing clear signs of consolidation after the recent volatile moves. This zone has repeatedly acted as a decision area where both buyers and sellers are active, suggesting that directional clarity will come only after a decisive breakout or breakdown.
On the upside, a sustained move above 59,550 will signal strength and can be used as a buying opportunity in buying, with upside targets placed at 59,750, 59,850, and 59,950+. A strong hold above this resistance can invite fresh momentum-driven buying, pushing Bank Nifty back toward the psychological 60,000 zone.
On the downside, if the index slips below 59,450–59,400, selling pressure may increase. In that case, selling can be considered, with downside targets at 59,250, 59,150, and 59,050-. The 59,050 level remains a crucial support, and any breakdown below this zone may accelerate further weakness. Until a clear breakout occurs, traders should expect range-bound price action with intraday opportunities near the mentioned levels, keeping strict risk management in place.

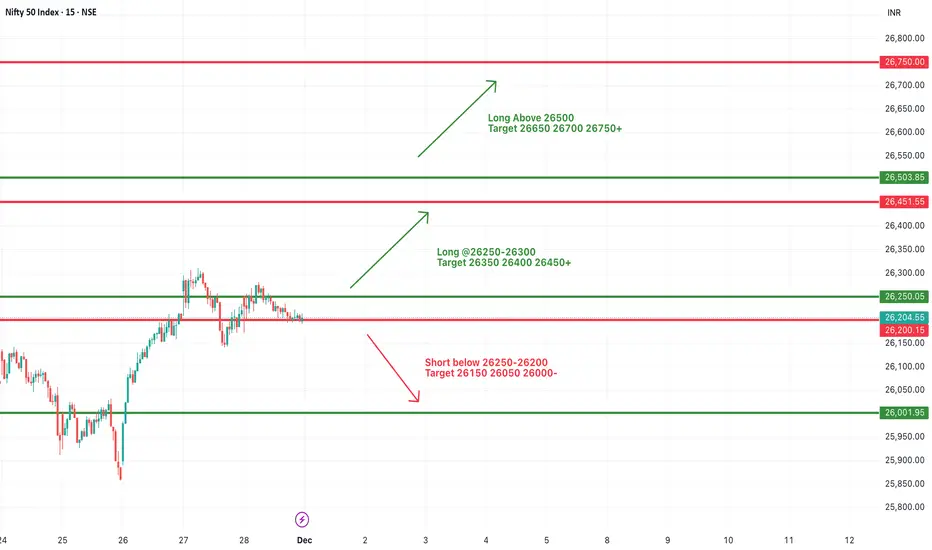
#NIFTY Intraday Support and Resistance Levels - 01/12/2025Nifty is expected to open with a strong gap-up near the 26450 zone, signalling sustained bullish momentum and renewed buying interest at higher levels. This opening zone is significant because it aligns closely with a key resistance area that the index has been attempting to break over the past few sessions. If Nifty manages to sustain above the 26250–26300 support band after the opening surge, it will reinforce bullish strength and keep the long setup active toward 26350, 26400, and back into the 26450 region. A stable price action above 26450 becomes particularly important, as it will indicate that buyers are willing to absorb supply at the upper levels and push the market into the next breakout phase.
A clear breakout above the psychological and technical resistance of 26500 could attract fresh buying momentum, opening the path toward higher targets at 26650, 26700, and even 26750+, especially if global cues support risk-on sentiment. In such a scenario, the market could experience a trend-driven rally with shallow pullbacks and continuous higher supports.
However, traders should also be cautious of any rejection from the 26450–26500 zone. Immediate weakness will only be confirmed if Nifty slips back below the 26250–26200 region, which would activate the short setup with downside targets at 26150, 26050, and 26000-. Such a move would indicate exhaustion of the gap-up momentum and potential profit booking by short-term participants.
Overall, with a gap-up opening near 26450, the broader short-term bias remains decisively positive. Sustaining above key breakout levels throughout the first hour will be crucial for maintaining momentum and validating the expected bullish continuation for the day.
[INTRADAY] #BANKNIFTY PE & CE Levels(25/11/2025)Bank Nifty is expected to open flat today, indicating a neutral start with no clear directional bias in the early session. A sustained move above the 59050–59100 zone will activate the buying setup, opening upside targets of 59250, 59350, and 59450+. If momentum strengthens and price trades decisively above this range, further upside may continue toward the next major resistance.
On the downside, weakness will be confirmed only if the index slips below the 58950–58900 zone, where the selling trade becomes active with targets at 58750, 58650, and 58550-. Since the opening is flat, the market may initially remain within the range, and clear momentum will develop only after either side breaks decisively.

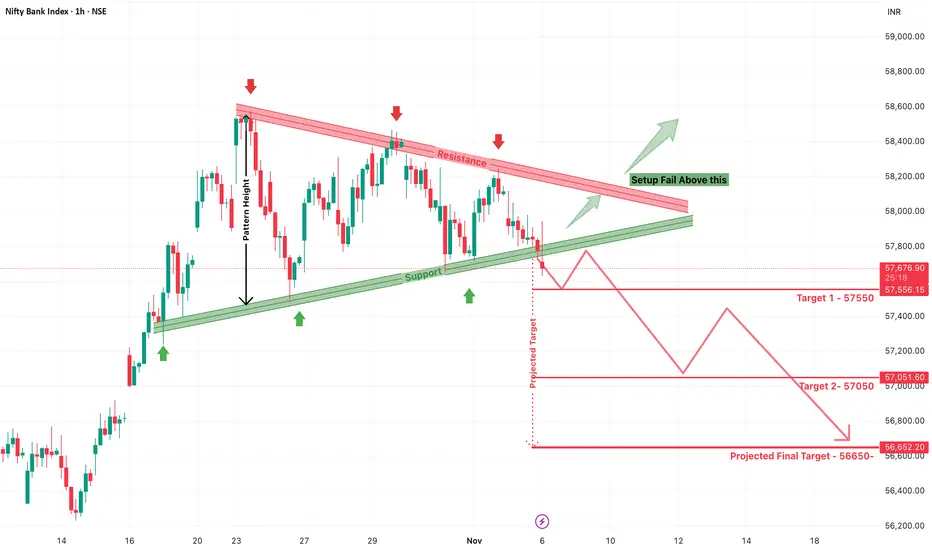
Bank Nifty Breakdown – Rising Wedge Breakdown Hints sellingBank Nifty has recently shown a significant technical development that could mark a short-term reversal: a breakdown from a rising wedge pattern below its support trendline. The rising wedge is generally a bearish reversal pattern when occurring after an uptrend, and in this case, the structure has played out with textbook precision.
Initially, Bank Nifty attempted to break above the resistance zone around 58,200–58,400, but it failed to sustain the move. This fake breakout, often referred to as a bull trap, is a strong bearish signal—especially when followed by a clean breakdown of the support line, as seen near the 57,800 level. The price has now convincingly moved below this support zone, confirming a potential trend reversal.
The pattern's height, which represents the distance between the highest swing high and lowest swing low within the wedge, has been used to project the downside targets. According to this breakdown setup, the following bearish targets are now in play:
Target 1: 57,550
Target 2: 57,050
Projected Final Target: 56,650
These targets are marked clearly on the chart and represent areas where price action may find temporary support or experience short-covering bounces. However, unless Bank Nifty reclaims the upper wedge zone and invalidates the breakdown, the path of least resistance remains downward.
What makes this move even more credible is the series of lower highs formed under resistance, showing consistent selling pressure. Simultaneously, the failed breakout has likely triggered stop losses of aggressive long positions, adding to the downward momentum.
Traders should now watch for confirmation of this breakdown with volume and follow-through candles. Any bounce back to the 57,800–58,000 zone should be approached with caution, as it may act as a fresh supply zone unless strongly reclaimed.
NIFTY Breakout from Broadening Wedge – Is a Big Rally Ahead?The Nifty 50 index has recently broken out of a Broadening Wedge Pattern, signaling a potentially powerful upward move. This breakout is significant as it comes after weeks of wide-range consolidation within expanding trendlines—a classic sign of increasing volatility and market indecision that typically resolves with an explosive move.
The wedge's upper resistance, which acted as a ceiling near the 25,900–26,000 zone, has finally been breached with strong bullish momentum. This breakout confirms that buyers have taken control, overcoming the supply pressure at the top of the wedge. Such a breakout, especially from a broadening formation, often leads to sharp directional rallies as trapped short-sellers cover positions and new momentum traders enter long.
Using the height of the wedge, the projected upside has been clearly mapped out. The immediate targets post-breakout are:
Target 1: 26,250
Target 2: 26,450
Target 3: 26,750
Final Projected Target: 26,950+
Each of these levels offers potential resistance where short-term consolidation or partial profit booking may occur. However, if the broader sentiment remains bullish and global cues support the move, Nifty could comfortably approach or even exceed the final projected target in the coming sessions.
The breakout also invalidates the earlier bearish scenario of a fall back into the wedge. As long as Nifty holds above the breakout zone (now turned support), the bullish structure remains intact. This zone—around 25,900—is now a critical level to watch for any retest. If the index revisits this level and finds buying interest, it will further strengthen the breakout’s credibility.
Volume confirmation, strong follow-up candles, and broader sectoral participation will be key to sustaining the rally. Traders should also keep an eye on global market trends, USDINR, and bond yields, as they may influence sentiment at higher levels.
In summary, Nifty has decisively broken out of a broadening wedge—an event that opens the door to a fresh leg of rally. The pattern suggests a potential upside of 800–1,100 points from the breakout level, with bulls firmly in control unless price falls back below the wedge resistance. It’s time to ride the trend, but with calculated risk and disciplined trailing stop-losses.

#NIFTY Intraday Support and Resistance Levels - 23/10/2025Nifty is expected to open with a gap up above the 26,050 level, indicating strong bullish sentiment and follow-through momentum from recent sessions. The index has been maintaining higher highs and higher lows, showing sustained buying interest from market participants.
If Nifty holds above 26,050–26,100, it could extend gains toward 26,150, 26,250, and 26,450+ levels. A breakout above 26,250 will confirm a strong bullish continuation, paving the way for a further rally toward 26,600+ levels in the short term.
On the downside, immediate support lies near 25,950–25,900. A dip below this zone could trigger intraday profit booking, dragging the index toward 25,850 and 25,750 levels.
Overall, the sentiment remains positive with a gap-up opening expected above 26,050, supported by steady momentum. Traders should look for buy-on-dip opportunities, keeping a trailing stop loss below 25,900 to safeguard profits and manage risk effectively.
[INTRADAY] #BANKNIFTY PE & CE Levels(08/10/2025)Bank Nifty is expected to open flat near the 56,200 level after a strong rally in the previous sessions. The index has been consolidating within a narrow range, suggesting a pause before the next directional move.
On the upside, a sustained move above 56,450–56,500 could trigger a bullish breakout, leading to an upside toward 56,650, 56,850, and 56,950+. A breakout above 56,950 will further strengthen the bullish momentum and may push the index toward new short-term highs.
On the downside, immediate support lies around 56,050–55,950. A breakdown below this zone may lead to mild selling pressure, dragging the index toward 55,750, 55,650, and 55,550-.
Overall, the sentiment remains cautiously positive. Traders should wait for a confirmed breakout or breakdown from the current consolidation zone before initiating fresh positions, while maintaining strict stop-loss levels.

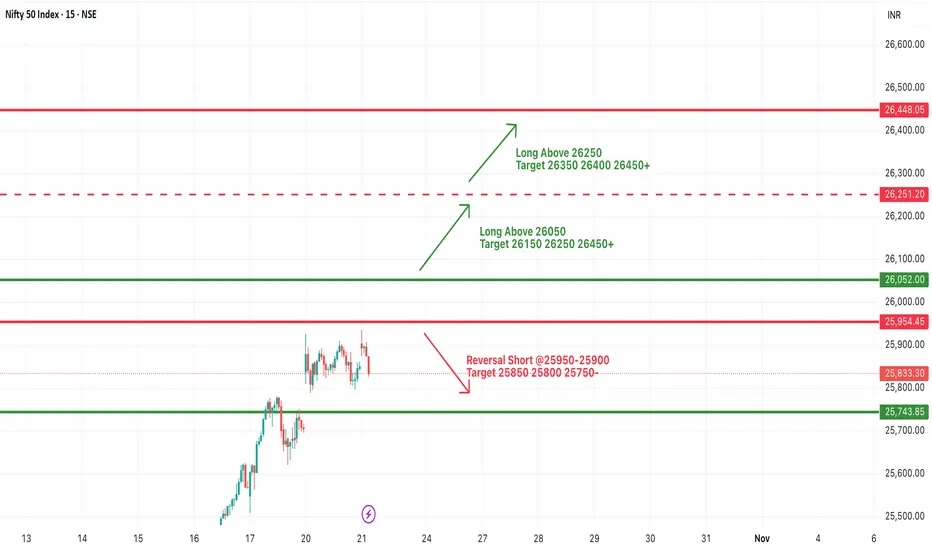
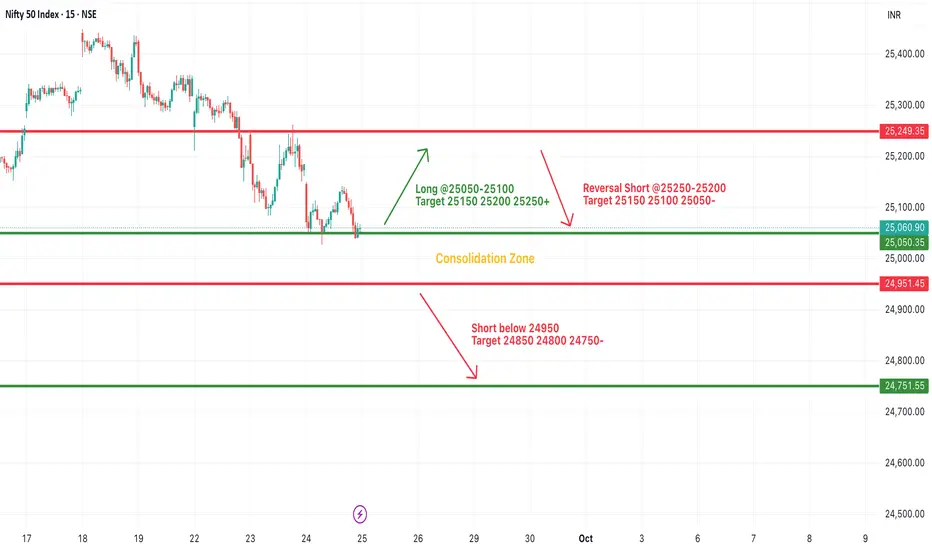
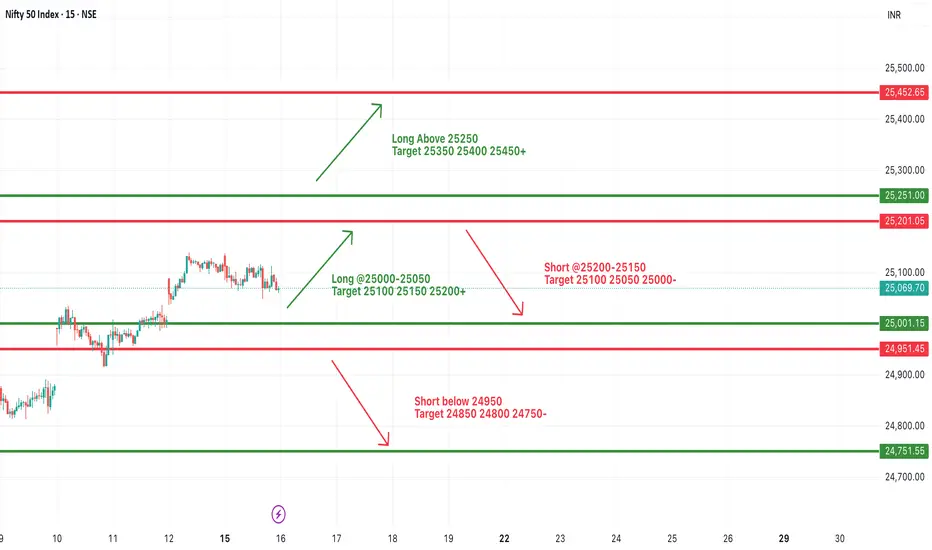
#NIFTY Intraday Support and Resistance Levels - 25/09/2025Nifty is expected to open with a gap down near the 25,050 zone, which lies within the current consolidation range. On the upside, if the index sustains above 25,050–25,100, it can trigger buying momentum toward 25,150, 25,200, and 25,250+.
A breakout above 25,250 will further strengthen the bullish sentiment and open the path for higher levels. On the downside, immediate support is placed around 25,000–24,950, and a breakdown below this zone may invite fresh selling pressure, dragging the index lower toward 24,850, 24,800, and 24,750-.
Additionally, a reversal short near the 25,200–25,250 resistance band cannot be ruled out, which may push prices back toward the lower range. Overall, Nifty remains in a consolidation phase, and traders should wait for a clear breakout or breakdown before taking directional positions.
#NIFTY Intraday Support and Resistance Levels - 16/09/2025Nifty is expected to open on a flat note, with no major changes seen from yesterday’s levels. The market continues to hover within a defined range, suggesting that intraday traders should wait for a breakout or breakdown before taking fresh positions.
On the upside, fresh momentum can be seen if Nifty sustains above 25,000–25,050, opening the path toward 25,100, 25,150, and 25,200+. A stronger rally can only be expected once Nifty clears 25,250, which may push it further toward 25,350–25,450+.
On the downside, weakness may emerge if Nifty slips below 25,200–25,150, which could drag it toward 25,100, 25,050, and 25,000-. A further breakdown below 24,950 will intensify selling pressure, with targets at 24,850, 24,800, and 24,750-.
Overall, Nifty is in a consolidation phase, and traders should follow a wait-and-watch approach near key levels. A flat opening signals indecision, so risk management and quick profit booking will be crucial.
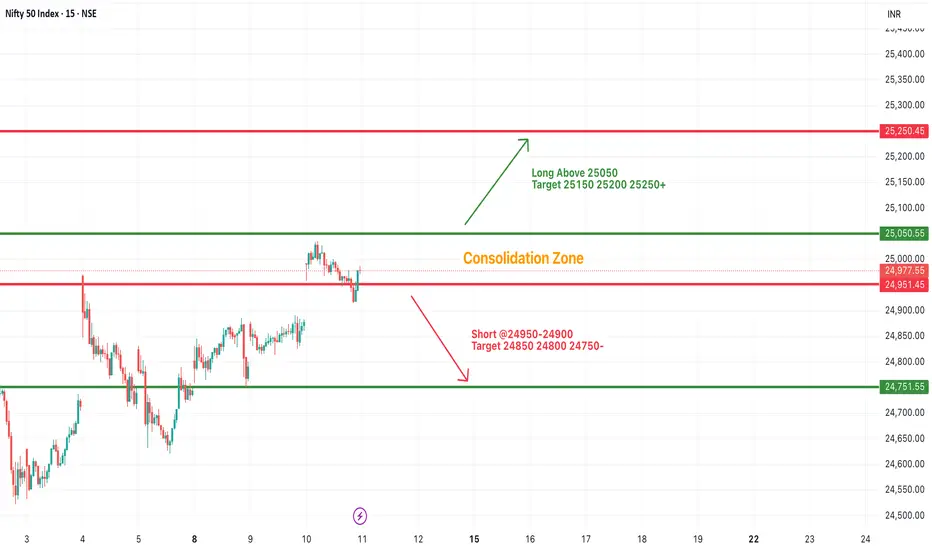
#NIFTY Intraday Support and Resistance Levels - 11/09/2025Nifty is expected to witness a slightly gap up opening, signaling stability after recent sessions of consolidation. The index is trading within a well-defined zone, and a breakout in either direction will set the tone for intraday movement.
On the upside, if Nifty sustains above the 25,050 level, it may trigger fresh buying momentum. This could push the index towards 25,150, 25,200, and 25,250+, where higher resistance is placed. A decisive close above 25,250 will strengthen the bullish sentiment and may invite further upside in the short term.
On the downside, if Nifty slips below 24,950–24,900, selling pressure may dominate the session. This can lead to a move towards 24,850, 24,800, and 24,750 levels, where immediate support lies. A break below 24,750 could extend the decline and keep the index under pressure.
Overall, Nifty remains in a consolidation phase with both bullish and bearish opportunities depending on how it reacts around the breakout levels. Traders should focus on key support and resistance levels while maintaining strict stop-losses for risk management.
HEROMOTOCO Breakout Alert: Inverted Head & Shoulder PatternHero MotoCorp Ltd has formed a classic Inverted Head and Shoulders pattern on the daily timeframe, a strong indication of a potential bullish trend reversal. This pattern, combined with a breakout above the neckline and support from the 200 EMA, presents a high-probability long setup. This post details the trade plan, key levels, and conditions to validate or invalidate the move.
Chart Analysis Summary:
The stock closed at ₹4,535.90 with a powerful bullish candle, up by 5.20% for the day. This breakout move has occurred after months of consolidation and pattern development. The 200 EMA, which acted as dynamic resistance around ₹4,294, has now been breached with strong momentum, adding further bullish confidence.
The left shoulder of this pattern formed around November–December 2024, the head bottomed out near April 2025, and the right shoulder was developed during June–July 2025. The neckline, placed between ₹4,500 and ₹4,550, was the final resistance, which has now been broken decisively.
Trade Plan & Entry Strategy
If you’ve missed the breakout candle, don’t worry. The ideal approach now is to wait for a retest of the neckline zone, which lies around ₹4,500–₹4,550. If price comes down and finds support here, then traders should watch for bullish candlestick patterns on lower timeframes (like 1H or 4H) before entering. This ensures a high-probability entry with manageable risk.
For aggressive traders, early entries can be considered at current levels, but only with strict risk management and stop-loss placement below the neckline or the last swing low. If the retest holds and bullish momentum continues, this setup has the potential to deliver a clean rally.
Target Zones
The first target for this setup is ₹5,000, which acts as an important psychological and technical resistance. It’s a good point for partial profit booking or trailing stop adjustments. The final projected target based on the height of the pattern is ₹5,480. This level marks the completion of the measured move and can be used for full profit booking if the trend remains intact.
Risk & Invalidation Level
This setup will be considered invalid if the price drops and closes below ₹4,200, which is the base of the right shoulder. A breakdown below this support would indicate that the bullish structure has failed, and the stock may revisit lower zones.
Why This Setup is High-Quality
The Inverted Head & Shoulders is one of the most reliable reversal patterns in technical analysis. In this case, the breakout is supported by strong volume (not shown in the chart), a decisive close above the neckline, and a 200 EMA crossover, all of which provide strong technical confluence. The structure is clean, and the breakout level is clearly defined. Risk is limited and reward is substantial — a great setup for swing or positional trades.
Hero MotoCorp is showing early signs of a potential trend reversal after months of correction and consolidation. The breakout from the Inverted Head & Shoulders pattern offers a golden opportunity for traders looking for bullish setups. If the neckline retest confirms, this trade can offer a great reward-to-risk ratio targeting 5,000 and beyond. As always, patience and disciplined execution are key.

BTC/USDT ( Technical View )The current price of Bitcoin is $37,801.73 USD, with a 24-hour trading volume of $20.58 billion USD. Bitcoin has experienced a 0.84% decrease in the last 24 hours, and its market cap is $739.28 billion USD. The circulating supply is 19.56 million BTC, out of a maximum supply of 21 million BTC.
In the weekly analysis of BTCUSDT, all technical indicators and moving averages signal a strong buy. The RSI is at 74.00, indicating overbought conditions in Bitcoin. While the EMAs suggest a temporary bullish trend, caution is advised due to the overbought stance indicated by the RSI, with the potential for an upward swing. Key resistance levels are at $38,907, $40,032, and $41,654, while support levels are at $33,413, $34,538, and $36,160. Bitcoin exhibits high volatility, as evidenced by the ATR (14) value of 2358.

XAUUSD ( GOLD ) PRICE PREDICTION ( 6 month high ) XAUUSD price trade at highest level in 6 month near $2052 wednesday. As per the RSI ( Relative Strength Index ), it show oversold zone on a 1 Day chart ( TF ). Resistance level of xauusd is $2052 ( highest point of 6 month high ), there is a higher chance of pullback in gold price. Support is seen in middle of the september high of $2022 which was the important resistance level in 1 day TF. If we talking about 50 & 200 simple moving average, it shows golden crossover it means 50 sma is cross the 200 sma from below. The golden crossover formation should keep downside cushioned for Gold price. On upside trend, If it is break the 6 month high $2052 then next level will be $ 2070 as a resistance level. The all-time high of $2079 will be next on gold buyers.

Ascending Triangle Breakout seen in BHEL | Target 104+Hi guy's, i hope you all will be good,
i have brought an another stock which has given a Ascending Triangle Pattern Breakout on chart. This idea definitely is going to a learning content as i am gonna to explain in very brief about Ascending Triangle Pattern. So let's start,
What is Ascending Triangle Pattern?
An Ascending Triangle is a Classical Chart pattern that is used in Technical Analysis to indicate a continuation of a trend. It is created by a horizontal resistance line that is drawn along the swing highs, and a rising up trendline that is drawn along the swing lows as shown in the Chart Above.
The breakout in an ascending triangle can occur to the upside or downside. Ascending triangles are often called continuation patterns since the price will typically breakout in the same direction as the trend that was in place just prior to the triangle forming.
A trader enters the trade on the long side, if the horizontal line is broken out on the upside. The stop-loss in this case would be the lower trendline. The target would be the widest part of the triangle.
If a breakout happens on the downside of the ascending trendline, a short entry can be taken and a stop-loss can be put above the horizontal line. Again the target would be the widest part of the ascending triangle.
Like any support/resistance or trendline breakout/breakdown, volume plays a very important part in confirming the strength of an ascending triangle breakout/breakdown. The volume should be low and below average as the ascending triangle is nearing completion and when the breakout or breakdown happens, the volume should be high, indicating that big money is participating in the move.
An ascending triangle can be high reward to risk trade as the stop-loss is small (because of the narrow width of the triangle at the time of completion), but it is also prone to false breakouts, hence one can minimize the chances of a false breakout by following rules similar to the ones applicable on trendline and support/resistance breakouts:
Ensure that the number of touches on the trendline or resistance are high (minimum two touches are required)
Ensure that the volume going into the pattern is low and the volume on the breakout is high.
So guy's i think now have definitely understood about Ascending Triangle Pattern Breakout. So if you see this type of pattern on chart, then go for long with proper stop loss.
Levels i already have marked on chart. Please see chart for entry, exit and stop loss.
Disclaimer:- Please always do your own analysis or consult with your financial advisor before taking any kind of trades.
Dear traders, If you like my work then do not forget to hit like and follow me, and guy's let me know what do you think about this idea in comment box, i would be love to reply all of you guy's.
Thankyou.

TRX’s price has pumped by 0.57% in the last 24 hours.1) TRX could hit $0.088 in 2023
2) TRON’s price prediction for the most bearish scenario will value TRX at $0.057 in 2023
3) TRON’s previous All Time High was on 5th January 2018 where TRX was priced at $0.23
4) To simplify the latest TRX price prediction, we have divided up the prediction by short term TRON price prediction and long term TRON price prediction.
5) TRX had a trading volume of $288,753,858. TRON has gone up by 3.94% in the past 30 days.
6) According to our analysis in the short term, TRON price prediction for August 2023 shows the average price of TRX at $0.068 and the highest possible price for August 2023 would be $0.072.
7) Further, according to our analysis in the long term, TRON price prediction for December 2023 shows the average price of TRX at $0.073 and the highest possible price for December 2023 would be $0.078.

SOL / USDT WILL TOUCH HIGH ?Solana, SOL could hit $6.59 in 2023
Solana’s price prediction for the most bearish scenario will value SOL at $16.03 in 2023
Solana’s previous All Time High was on 7th November 2021 where SOL was priced at $259.96
Solana’s price at the same time last week was $20.57. It has moved by -3.91% in the past week and is currently at $20.04. Infact, in the past 24 hours, SOL has dumped by -7.04%. There is a slight bearish sentiment in the crypto market. The long term sentiment, however, remains bullish and SOL could hit $39.14 in 2024.
The total circulating supply of Solana as of writing this article was $397607780.16 and the marketcap of SOL remains at $7,970,200,997.

Fibonacci levels plot levels to watch out for around the $300 The $315 and $300 levels of resistance and support respectively have been important on the lower timeframes. Over the past 48 hours, BNB has declined from the local highs at $316.3 to trade at $308.5, at the time of writing.
On the 6-hour chart, the RSI was unable to climb above neutral 50, showing the persistence of the bears. Over the past week, the trading volume was low as well. This came at a time when BNB retested the $300 level.
With Bitcoin facing rejection from beneath the $27.8k resistance on Monday as well, it appeared likely that more losses were in store for the crypto market this week. If Binance Coin were to slip beneath the $295-$300 area, the Fibonacci extension levels highlighted some key areas to watch out for.
The 50% and 61.8% extension levels would likely be tested upon a move beneath $295, with the 23.6% level at $289 also expected to serve as minor support.
Meanwhile, a move above $316.3 would signify a break in the bearish market structure. Thereafter, buyers could begin to exert their will, but this was the less likely scenario.

Moonbeam GLMR Price PredictionMoonbeam GLMR Price Prediction.
GLRM is moving in down trend buy at lower trend line

QANX my secret gem It is a gem project that I have seen at least 20 30x potential. I have been following it since its ido! One more dump to the downside around 0.03$ . Take care
