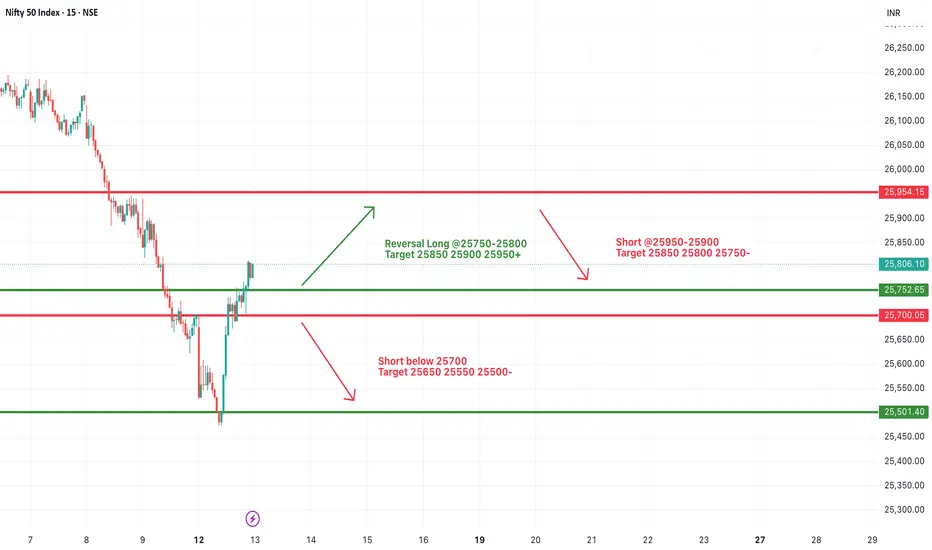
#NIFTY Intraday Support and Resistance Levels - 13/01/2026A flat opening is expected in Nifty 50, with the index trading near the 25,800–25,820 zone, which is acting as a short-term balance area after the recent sharp recovery from lower levels. The bounce from the 25,500–25,550 support zone indicates short-covering and selective buying, but overall price action still reflects a cautious and range-bound environment. The market is currently waiting for a clear directional trigger before committing to a stronger move.
On the upside, a sustained hold above 25,850–25,900 will be crucial to confirm bullish continuation. If this zone is reclaimed and held, long positions can be considered with upside targets at 25,950, 26,000, and 26,050+. A decisive breakout above 25,950 may invite fresh buying momentum and improve short-term sentiment.
On the downside, failure to sustain above 25,750 may weaken the recovery attempt. A break below 25,700 can reintroduce selling pressure, opening downside targets at 25,650, 25,550, and 25,500-, where strong demand is expected again. Until a clear breakout or breakdown occurs, traders should continue to focus on range-based trades, keep strict stop-losses, and avoid aggressive directional bets.
Prices
[INTRADAY] #BANKNIFTY PE & CE Levels(31/12/2025)A gap-up opening is expected in Bank Nifty, indicating a positive start to the session after yesterday’s recovery from lower levels. The index has managed to move above the 59,200–59,250 zone, suggesting improving sentiment in the short term. However, the overall structure still demands confirmation through sustained price action above key resistance levels before a strong directional move can be confirmed.
On the upside, the 59,300–59,350 zone will act as the immediate resistance area. A sustained hold above 59,350, followed by a breakout above 59,550, can trigger fresh long trades, with upside targets placed at 59,750, 59,850, and 59,950+. Strength above these levels may further accelerate buying momentum toward the upper resistance band near 60,000.
On the downside, the 59,050 level remains a crucial intraday support. If Bank Nifty fails to hold above this zone and slips back below 58,950, selling pressure may re-emerge. In such a scenario, short positions can be considered with downside targets at 58,750, 58,650, and 58,550-. Until a clear breakout above resistance is confirmed, traders should stay disciplined, trade with defined levels, and manage risk carefully in this evolving market setup.

#NIFTY Intraday Support and Resistance Levels - 26/12/2025A flat opening is expected in Nifty 50, with the index trading around 26,140, indicating continuation of the ongoing range-bound structure. Price action suggests the market is currently oscillating between well-defined support and resistance levels, showing no immediate directional bias. This reflects a cautious tone, where buyers and sellers are evenly placed, and the index is waiting for a decisive breakout to establish momentum.
On the upside, a sustained move above 26,250 will be the key trigger for bullish continuation. If Nifty manages to hold above this level, long positions can be considered with upside targets at 26,350, 26,400, and 26,450+. A clean breakout above this resistance zone may attract fresh buying interest and strengthen bullish sentiment.
On the downside, the 26,200–26,180 zone is acting as a short-term rejection area. Failure to reclaim this zone could lead to reversal selling, with downside targets placed at 26,150, 26,100, and 26,050-. However, if the index finds support near 26,050–26,100 and shows strength, intraday long opportunities may emerge toward 26,150–26,250+. Until a clear breakout or breakdown occurs, traders should focus on level-based trades with strict risk management, avoiding aggressive directional bets in a consolidating market.

#NIFTY Intraday Support and Resistance Levels - 23/12/2025A gap-up opening is expected in Nifty 50, with the index trading firmly above the recent support zone and showing improving short-term strength. Price has moved higher from the 26,050 region and is now hovering near 26,150–26,170, indicating bullish continuation after the recent recovery. The overall structure remains positive as long as the index sustains above the key demand area.
On the upside, a sustained move above 26,250 will be a crucial breakout trigger. Holding above this level can attract fresh buying interest, opening the path for long positions with upside targets placed at 26,350, 26,400, and 26,450+. Strength above this resistance may further extend the rally toward higher levels in the coming sessions.
On the intraday upside, dips toward the 26,050–26,070 zone can also act as a buying opportunity if price shows stability. From this region, a bounce can lead to targets at 26,100, 26,150, and 26,200+, keeping the bullish momentum intact.
On the downside, if the index fails to sustain above 26,200–26,180 and shows rejection, a reversal short setup may come into play. In such a scenario, downside targets are seen at 26,150, 26,100, and 26,050-, where strong support is placed. Until a clear directional breakout is confirmed, traders should trade with discipline, follow key levels closely, and manage risk strictly in a gap-up driven market environment.

[INTRADAY] #BANKNIFTY PE & CE Levels(19/12/2025)A flat opening is expected in Bank Nifty, with the index continuing to trade within a tight consolidation range formed over the last few sessions. Price is currently hovering around the 58,900–59,000 zone, which is acting as a short-term balance area. This indicates hesitation in the market, where buyers and sellers are evenly placed, and a clear directional move is still awaited for conviction.
On the upside, a sustained move above 59,050–59,100 will be the key trigger for bullish momentum. If Bank Nifty manages to hold above this resistance zone, buying can be considered, with upside targets placed at 59,250, 59,350, and 59,450+. A decisive breakout above this level may invite follow-through buying and push the index toward higher resistance levels.
On the downside, if the index fails to hold the 58,950–58,900 support zone, selling pressure may accelerate. In such a scenario, selling can be considered with downside targets at 58,750, 58,650, and 58,550-, where strong demand is expected. Until a clear breakout or breakdown occurs, traders should continue to focus on range-based trading setups, keep strict stop-loss discipline, and avoid aggressive positional trades.

[INTRADAY] #BANKNIFTY PE & CE Levels(17/12/2025)A flat opening is expected in BankNifty, with price continuing to trade within the same well-defined range seen in the previous sessions. The index is hovering around the 59,000–59,050 zone, which is acting as an important short-term support area. As long as this level is protected, the market may attempt a pullback toward higher resistance levels, but overall momentum remains neutral unless a breakout occurs.
On the upside, a move above 59,050–59,100 can be used as a buy-on-dips opportunity for buying, with upside targets at 59,250, 59,350, and 59,450+. A stronger bullish confirmation will come only if BankNifty sustains above 59,550, post which buying above 59,550 can aim for 59,750, 59,850, and 59,950+.
On the downside, 59,450–59,400 remains a crucial resistance zone where selling can be considered for downside targets at 59,250, 59,150, and 59,050-. If the index decisively breaks below 58,950, further weakness may unfold, opening targets toward 58,750, 58,650, and 58,550-. Until a clear breakout or breakdown is seen, traders should continue to focus on range-bound strategies with disciplined risk management.

[INTRADAY] #BANKNIFTY PE & CE Levels(01/12/2025)Bank Nifty is expected to open with a gap-up today, indicating early bullish sentiment as the index holds firmly above its recent consolidation range. If the market sustains above the 59550–59600 zone after opening, the buying setup becomes active with targets of 59750, 59850, and 59950+. A continuation of strength above this level can push price toward the next major resistance around 60050–60100, where a fresh breakout may extend the rally toward 60250, 60350, and even 60450+.
On the downside, weakness will only be confirmed if the index slips below the 59950–59900 zone, opening the selling opportunity with targets at 59750, 59650, and 59550-. Further selling pressure will activate only if Bank Nifty breaks below 59450–59400, where deeper targets of 59250, 59150, and 59050- come into play. With a gap-up opening, the initial bias remains positive, but sustained momentum above the breakout zones will be crucial for a clean upside move.

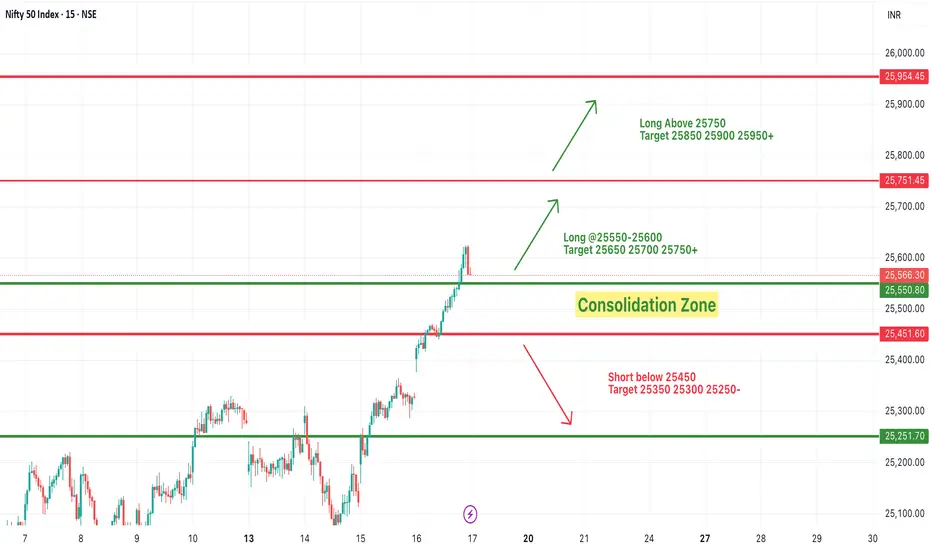
#NIFTY Intraday Support and Resistance Levels - 17/10/2025Nifty is likely to open with a gap up near the 25,550–25,600 zone, continuing the strong bullish momentum from the previous session. The index has broken out of its recent consolidation zone, indicating buyer strength and potential continuation toward higher levels.
If Nifty sustains above 25,600–25,650, we may witness a further rally toward 25,700, 25,750, and 25,850+ levels. A breakout above 25,750 will further strengthen the bullish trend, opening the path toward 25,900–25,950+.
On the downside, immediate support lies near 25,450–25,400. A drop below this zone could lead to a mild retracement toward 25,350, 25,300, and 25,250 levels.
Overall, the sentiment remains strongly bullish with a gap up opening, but traders should stay alert near upper resistance zones as short-term profit booking may occur. Maintaining a trailing stop loss and booking partial profits at key targets is advisable to safeguard gains.
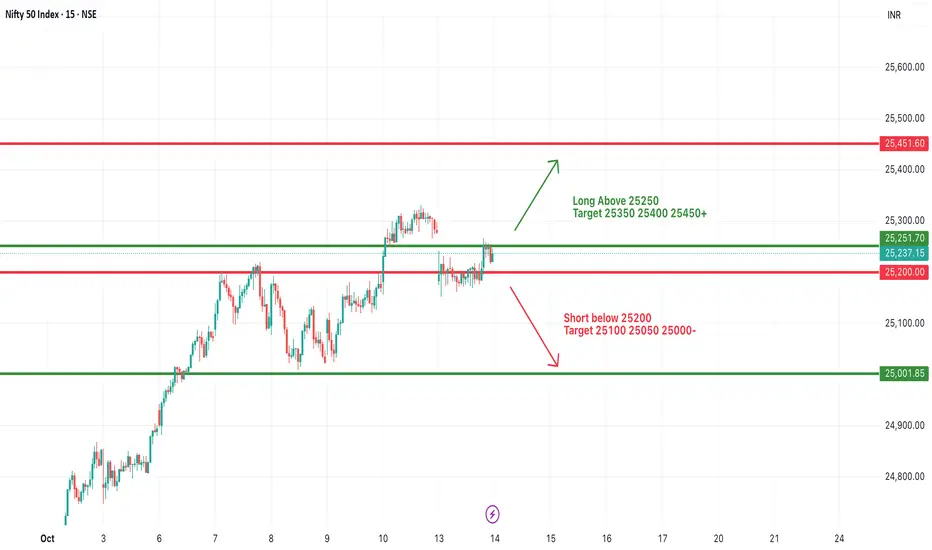
#NIFTY Intraday Support and Resistance Levels - 14/10/2025Nifty is expected to open flat near the 25,230–25,250 zone, indicating a balanced start as the index trades within a narrow consolidation range after recent gains. The structure shows a tug-of-war between bulls and bears around key resistance and support levels.
If Nifty sustains above 25,250, a fresh upside move may emerge toward 25,350, 25,400, and 25,450+. A breakout beyond 25,450 will confirm further bullish momentum.
On the downside, a breakdown below 25,200 could invite mild selling pressure, dragging the index toward 25,100, 25,050, and 25,000-.
Overall, the trend remains neutral to slightly positive, with traders advised to wait for a clear breakout or breakdown before taking directional positions. Intraday traders should maintain tight stop-losses due to range-bound volatility.
NIFTY Counter trendlines.Just waiting for 15 minutes red candle for best entry, Target will be the support trendline.

Identifying Swing Trading Opportunities in the Market1. Introduction to Swing Trading
Swing trading is a powerful trading style that sits between day trading and long-term investing. Unlike day traders who open and close trades within the same day, swing traders hold positions for a few days to a few weeks. The main goal is to capture "swings" in price—upward or downward movements caused by market momentum, technical patterns, or news.
The beauty of swing trading lies in its balance:
Less stressful than day trading since you don’t need to watch charts all day.
More active and potentially higher returns than passive investing.
Works well for people with jobs or businesses who can’t spend 8 hours glued to a screen.
But to succeed, you need to identify the right opportunities. Not every chart or stock is suitable for swing trading. Spotting opportunities requires understanding market structure, technical analysis, fundamentals, and timing.
2. Core Principles of Swing Trading Opportunities
Before diving into strategies, let’s build the foundation. Swing traders look for:
Trend Direction – Is the stock in an uptrend, downtrend, or sideways range?
Momentum – Is there enough force behind the move to sustain swings?
Risk-to-Reward – Can you set a stop-loss at a reasonable level and aim for a bigger target?
Liquidity – Is the stock or index liquid enough to avoid slippage?
Catalysts – News, earnings, or events that can trigger short-term moves.
These principles act as a filter. Out of thousands of stocks, only a few will pass through this funnel as swing trading candidates.
3. Tools to Identify Swing Trading Opportunities
Swing traders rely on a mix of technical, fundamental, and sentiment analysis. Let’s break them down:
a) Technical Analysis
Price Action: Reading candlesticks, support/resistance, breakouts, and patterns.
Indicators:
Moving Averages (20, 50, 200 EMA) for trend direction.
RSI (Relative Strength Index) for overbought/oversold signals.
MACD for momentum shifts.
Volume Profile for demand-supply zones.
Chart Patterns:
Bullish: Cup and Handle, Ascending Triangle, Flag, Double Bottom.
Bearish: Head & Shoulders, Double Top, Descending Triangle.
b) Fundamental Analysis
While swing traders don’t dive deep like long-term investors, some fundamentals matter:
Earnings reports (positive surprises can fuel rallies).
Sector rotation (money flowing from one sector to another).
Macro data (inflation, interest rates affecting sentiment).
c) Sentiment Analysis
News Flow: Mergers, product launches, government policies.
Options Data: Unusual call/put activity showing institutional interest.
Market Mood: Fear vs greed index, retail participation.
4. Step-by-Step Approach to Spot Opportunities
Here’s a structured approach swing traders can follow daily or weekly:
Step 1: Market Scan
Use screeners (TradingView, Chartink, Finviz, Screener.in).
Filter by:
Strong relative strength vs index.
Stocks near 52-week highs/lows.
Breakout setups (above resistance or trendline).
High volume spikes.
Step 2: Trend Confirmation
Use 20/50 EMA to confirm if stock is trending.
Avoid stocks in choppy sideways ranges.
Step 3: Entry Triggers
Look for:
Breakout with volume.
Pullback to support after an uptrend.
Reversal signals at oversold levels.
Step 4: Risk Management
Place stop-loss below swing low (for long trades).
Aim for 1:2 or higher risk-to-reward.
Step 5: Monitor & Exit
Trail stop-loss as trade moves in your favor.
Exit at resistance, fib levels, or when momentum fades.
5. Swing Trading Opportunities Based on Market Structure
Market structure is the heartbeat of swing trading. Let’s break it:
a) Uptrend Opportunities
Look for higher highs & higher lows.
Entry: After a pullback to moving average/support.
Example: IT or Pharma stocks in a bullish cycle.
b) Downtrend Opportunities
Look for lower highs & lower lows.
Entry: After a bounce into resistance.
Example: Weak financial stocks in a rate-hike cycle.
c) Range-Bound Opportunities
Stocks consolidating in a range.
Entry: Buy at bottom support, sell at top resistance.
Example: Sideways PSU stocks before breakout.
d) Breakout & Breakdown Opportunities
Consolidation followed by strong volume breakout.
Entry: Just above breakout level.
Example: Midcap stocks after results.
6. Swing Trading Setups That Work
Different traders prefer different styles. Here are proven setups:
1. Pullback in Trend
Identify a strong uptrend.
Wait for stock to dip near 20/50 EMA.
Enter on bullish reversal candle.
Example: Nifty IT stocks after profit booking.
2. Breakout Trading
Stock consolidates under resistance.
Breaks with high volume.
Enter above breakout candle.
Example: Midcap infra stock crossing 200-day high.
3. Support & Resistance Bounce
Buy near strong support, sell near resistance.
Example: Bank Nifty bouncing at 45,000 level.
4. RSI Divergence
Price makes lower lows but RSI makes higher lows.
Signals reversal opportunity.
Example: Metal stocks reversing after deep selloff.
5. Gap Trading
Stock gaps up/down after news.
Trade in the direction of the gap with stop-loss.
Example: Earnings-driven gaps in large caps.
7. Sector & Thematic Opportunities
Swing traders benefit from sectoral rotation:
When IT outperforms, focus on Infosys, TCS, TechM.
When Banking leads, focus on HDFC Bank, ICICI, SBI.
When Energy/Metals rally, look at ONGC, Coal India, Hindalco.
Themes also create opportunities:
EV (Tata Motors, M&M).
Renewable energy (Adani Green, NTPC).
Defense (HAL, BEL).
8. Real-Life Examples
Let’s take two examples from Indian markets:
Example 1: Tata Motors (2024 EV Story)
Setup: Broke out of a long consolidation near ₹600 with heavy volume.
Entry: At ₹610 (after breakout).
Stop-Loss: ₹580 (below support).
Target: ₹700+ (based on swing projection).
Result: Delivered 15% in 2 weeks.
Example 2: Bank Nifty Swing
Setup: Pullback to 45,000 after sharp rally.
Entry: Reversal candle with volume at support.
Stop-Loss: 44,600.
Target: 46,500.
Result: Quick 3% move in 4 sessions.
9. Common Mistakes in Identifying Swing Trades
Trading illiquid stocks with low volume.
Chasing trades after a big rally (late entries).
Ignoring stop-loss, leading to capital erosion.
Overloading portfolio with too many trades.
Trading without checking broader market trend.
10. Advanced Filters for Identifying Opportunities
For serious traders:
Relative Strength Analysis: Compare stock vs index.
Volume Profile & Market Structure: Identify institutional footprints.
Fibonacci Retracement: Look for 38.2% or 61.8% pullback levels.
Options Data: OI build-up for short-term direction.
Conclusion
Identifying swing trading opportunities is both art and science. You need:
The science of technicals, fundamentals, and scanning.
The art of reading market psychology, momentum, and timing.
The key takeaway:
Not every stock is worth trading. The best swing traders wait for high-probability setups, manage risk strictly, and ride short-term momentum.
Swing trading is not about catching every move, but about catching the right moves. With practice, patience, and structured analysis, anyone can master the skill of spotting profitable opportunities in the market.

[INTRADAY] #BANKNIFTY PE & CE Levels(19/08/2025)Bank Nifty is likely to open with a gap-up today, reflecting positive momentum from the previous session. If the index sustains above the 55,550–55,600 zone, further upside towards 55,750, 55,850, and 55,950+ can be expected. A breakout above 56,050 could trigger fresh buying momentum with potential targets of 56,250, 56,350, and 56,450+.
On the downside, immediate support lies near 55,950–55,900. If Bank Nifty fails to hold this zone, short opportunities may emerge with targets at 55,750, 55,650, and 55,550-. A deeper correction below 55,450–55,400 could extend the fall towards 55,250, 55,150, and 55,050-.
Overall, the trend is bullish with a gap-up start, but traders should watch for rejection at higher resistance levels and trade with strict stop losses to manage volatility.

wedge pattern reversal in TATA CHEMICALS LTDTATA CHEMICALS LTD
Key highlights: 💡⚡
📈On 1Day Time Frame Stock Showing Reversal of wedge Pattern .
📈 It can give movement upto the Reversal Final target of above 1018+.
📈There have chances of breakout of Resistance level too.
📈 After breakout of Resistance level this stock can gives strong upside rally upto above 1160+.

Rising wedge pattern reversal in DIXON TECHONOLOGIESDIXON TECHONOLOGIES
Key highlights: 💡
✅On 1 Day Time Frame Stock Showing Reversal of Rising wedge Pattern .
✅It can give movement upto the Reversal target of above 3125+(Up to resistance level).
✅Can Go Long in this stock by placing a stop loss below 2770-.

Nifty is bullishNifty is bullish and should attempt 17000 levels in coming days, with support zone near 16350.
