Godrej Properties will hit 3000Trend Analysis – The stock is in a sustained uptrend, forming higher highs and higher lows on the daily and weekly charts. The breakout above key resistance at ₹2,750 suggests further upside.
Moving Averages – The 50-day and 200-day EMAs are aligned in a bullish crossover, reinforcing a long-term uptrend. The stock is comfortably trading above these moving averages, confirming strong buying interest.
RSI & MACD – The Relative Strength Index (RSI) remains above 60, indicating bullish momentum without being overbought. The MACD has given a fresh buy signal, crossing above the signal line with increasing histogram bars.
Volume & Breakout Confirmation – A recent high-volume breakout above ₹2,750 validates strength, suggesting institutional accumulation. Sustaining above this level will confirm a further rally.
Properties
Done with the AUSSIES... Now see Shriram PROPERTIES- Company is expected to give good quarter
- Company has delivered good profit growth of 23.4%
CAGR over last 5 years
- Debtor days have improved from 81.8 to 42.6 days.
- Annual Revenue rose 57%, in the last year to Rs 814
Crores. Its sector's average revenue growth for the last
fiscal year was 14%.
- Annual Net Profit rose 574% in the last year to Rs 66
Crores. Its sector's average net profit growth for the
last fiscal year was -15%.
- PE ratio is 21 vs sector PE ratio of 101.
Negative
- Promoter holding is low: 28 %
- Mutual Fund Holding decreased by 1.05% in the last quarter to 4.07.

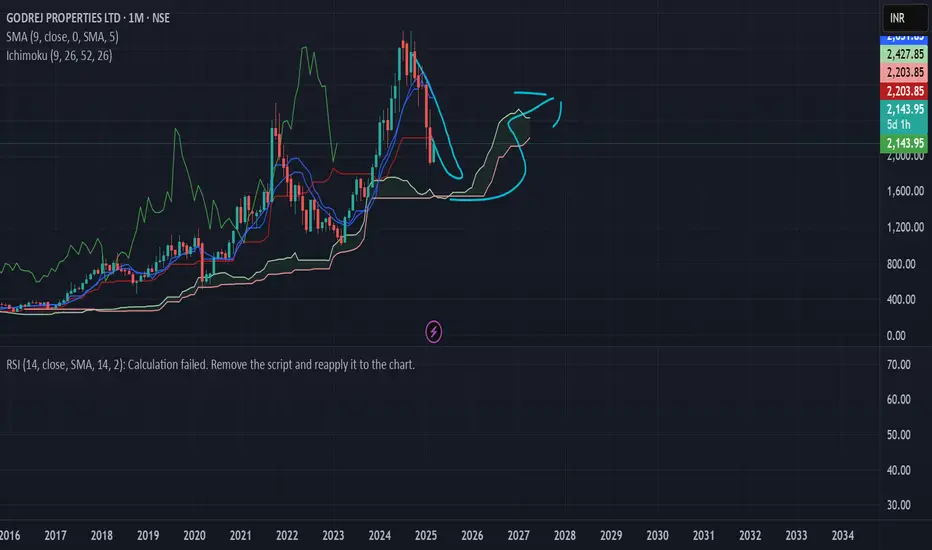
godrej properties share name : GODREJ PROPERTIES
call type : positional
- share is forming a falling wedge pattern
- Moring star on C Point on weekly time frame
- we can see a good buying pressure on c point
currently share is in uptrend
- we can accumulate this share at current level
with stop loss of 1100 targets 1428,1544 in
upcoming months
Thanks
