SBI Buy - Range Breakout - Technical analysis#State Bank of India - #TechnicalAnalysis - #sbin
Price: 948.85 |
#Technical Setup
Pattern: #Swing trade setup with All-Time High (ATH) breakout confirmed on monthly chart. #Pullback/base formation in progress before next upward move.
Strategy: Conservative buy on breakout on candle-closing basis
Entry: Buy above 973.30
Stop Loss: 944.45
**Key Levels:**
- Target 1: 1,025.00
- Target 2: 1,055.80
- Grand Target: 1,144.00
- Support: 961.78 - 944.45
#Technical Observations
1. **Range & ATH Breakout** confirmed on monthly timeframe
2. Current pullback/base formation before next leg up
3. **EMA's aligned** confirming uptrend structure
4. **Hidden Divergence (HD)** formed in RSI - trend continuation pattern
5. Price action remains constructive on daily chart
⚠️ DISCLAIMER
**This is NOT investment advice.** This analysis is for educational purposes only. Stock trading involves substantial risk of loss. Past performance and technical patterns do not guarantee future results. Always conduct your own research and consult a SEBI-registered financial advisor before making any investment decisions. The author assumes no responsibility for trading losses incurred.
Psubanks

Strong PSU Bank - Indian Bank - Strong BuyIndian Bank - Swing to Short-Term Investment Report
Current Price: 653.10
TECHNICAL SETUP OVERVIEW
Analysis Type: Monthly Chart | Investment Horizon: Short to Medium Term (6-18 months)
Key Observation: After a historic breakout from multi-year resistance, Indian Bank has established itself as a solid structure for accumulation with exceptional return potential.
BREAKOUT TIMELINE & PATTERN
Historical Resistance Battle (2018): Successfully tested 5 consecutive months.
Major Breakout (January 2024) Clean breakout above 2018 resistance level, Significance 6-year base breakout - high probability setup - Follow-through Strong momentum confirmed.
Bull flag Pattern formation, Price Range: 632-736. Building energy for next leg up
Structural Advantages:
1. Clean Breakout Pattern
- No false breaks or whipsaws
- Volume confirms genuine buying
2. Multiple Timeframe Confluence
- Monthly, weekly, daily all aligned bullish
- No conflicting signals
- High probability continuation
3. Measured Move Projections
- Targets based on historical patterns
- Flag pole height projects to 1,050+
- Conservative targets: 813-973
4. Fundamental Support
- PSU bank re-rating theme intact
- Improving asset quality
- Growing dividends (35% YoY growth)
- Strong Q4 profit growth (+31.56%)
Disclaimer: For educational purposes only. Manage risk appropriately and do your own research.
🎯 Trade Smart. Trade Safe. Accumulate Quality.

Canarabank - Short Term BuySImple Technical Analysis.
Multiple PSU stocks are forming Flag&Pole pattern.
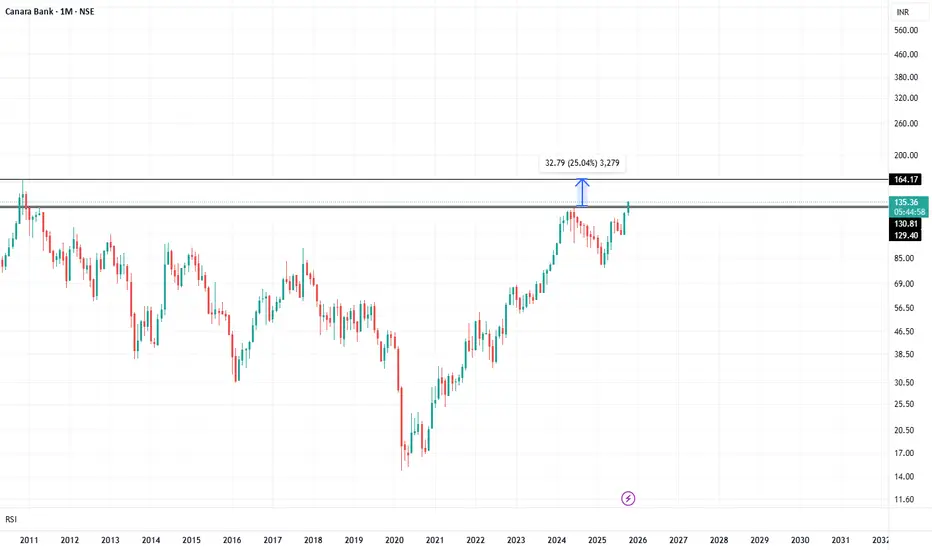
Canarabank - Hovering around Prev ATH.
Pattern BO will lead to 139.
Prev High Breakout will lead the Stock to 139/143/152/169.
Target Levels Based on Pattern target and Fibonocci Levels

#CANBK looking bullish on monthly timeframe#CANBK has given a breakout at 131 on a monthly timeframe. Upside potential: 25%+ (i.e. 164 which is the stock's all-time high). Stop loss: 127. A few things to note:
The sector is bullish. NIFTY PSU BANK recently gave a breakout at 8070
The stock is undervalued at a PE ratio of under 7. Company has delivered good profit growth of 61.0% CAGR over last 5 years
This is not a buy/sell recommendation. Research carefully and invest at your own risk.
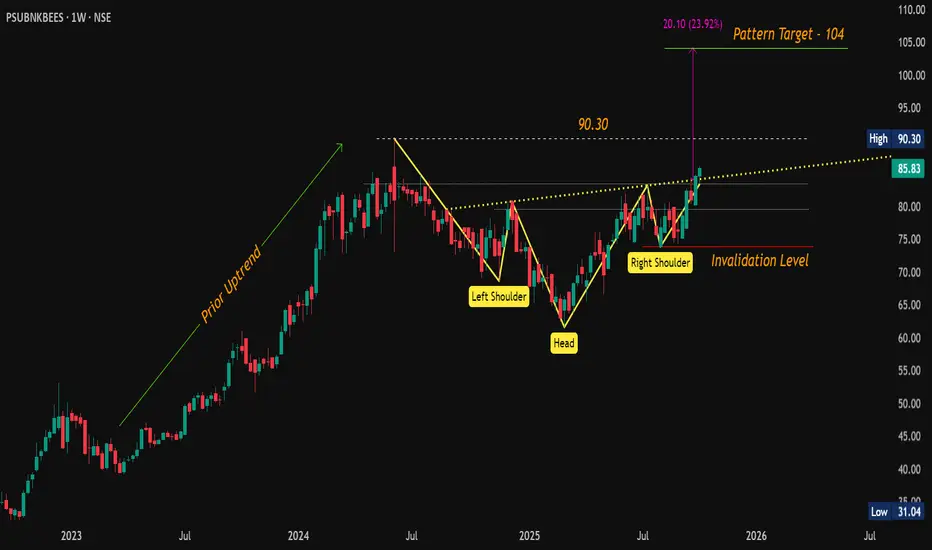
Missed the PSU Bank Rally? #PSUBNKBEES Still Has 24% Upside!CMP: 85.83
PSUBNKBEES has confirmed a classic Inverse Head & Shoulders breakout on the weekly chart , with two consecutive weekly closes above the neckline , a strong technical validation of the pattern.
🔹 Key Levels:
📌 Breakout Level: 84
🔽 Support Zone: 83.45 – 79.50
🔼 Overhead Resistance: 90.30
🎯 Pattern Target: 104 ( ~24% upside from breakout)
This ETF gives broad exposure to PSU banks , making it a lower-risk, sector-wide play for positional investors.
💡 If you are unsure which PSU Bank stock to choose, PSU Bank Bees offers a diversified, stress-free way to capture 20 -30% upside . Ride the trend, avoid the noise.
#ETF | #CNXPSUBANK | #PSUBanks | #InverseHeadAndShoulders | #ChartPatterns
📌 Disclaimer: This analysis is shared for educational purposes only. It is not a buy/sell recommendation. Please do your own research before making any trading decisions.
Bank Of BarodaHello & welcome to this analysis
After giving a breakout with strong volume followed by a pullback to the breakout level it appears to be ready for further upside till 270 - 300
This view would be invalid below 247
All the best

Canara Bank (CANBK)Breakout above ₹119.50 with strong volume confirms momentum.
Entry Zone: Near breakout (₹119.50–122)
Stoploss: ATR-based, just below breakout (~₹116)
Targets: ₹129.40 → ₹136.40 (Fib extension)
Macro Drivers:
Hopes of RBI rate cuts after Fed dovish stance
Stronger economic data supporting financials
Robust domestic credit growth
GST boost to liquidity
PSU Bank sector leadership
👉 Setup looks solid for continuation, provided volumes sustain.

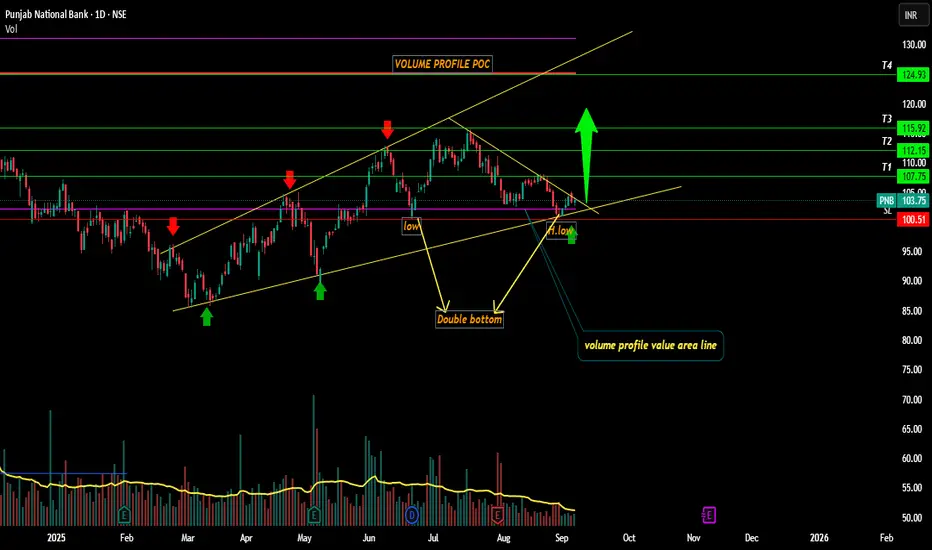
PNB looking Bullish ahead??!!Kindly check out the chart for the explanation.
Reasons-
1. Trendline Support
2. Double bottom
3. Fixed volume profile value area support
4. Low and lower low
5. PSU BANK index too looking bullish , check out idea below
Close below 100.52 - invalidation level
Targets mentioned @ chart.
Just my view ...not a tip nor advice!!!!
Thank you!!!
PUNJAB NATIONAL BANKHello & welcome to this analysis
In my previous post on the bank I had suggested the likelihood of it declining to 103 where it had double bullish harmonic patterns. (link to that post is given)
Now the bullish harmonic Bat & reciprocal ABCD patterns are indicating the probability of a rally till 106 & 109 as long as it sustains above 100.
Immediate resistance at 104 with strong support near 102.50
All the best

PUNJAB NATIONAL BANKHello & welcome to this analysis
In July 2025 it activated a bearish Harmonic Butterfly pattern at 115 that lead to its current decline at 38 Fibonacci of its rally.
Going forward it could continue to decline till 100 where it would likely form two bullish Harmonic patterns - Shark & ABCD around the 50 Fibonacci retracement.
It has resistance now between 110 - 108 from where it fell with heavy volumes couple of days back.
All the best
Regards

If any dip comes, go long in Nifty So like we analysed yesterday – NSE:NIFTY stayed sideways + volatile + bullish, all three.
Because the market opened above the pivot, we got the move as expected.
All these points prove that the market is technically improving. That’s why it’s moving according to my plan.
And if the market is following my plan, I’ll continue my intraday trading.
Now, let’s talk about tomorrow.
Nifty’s pivot has moved up from 24552 to 24606, which clearly shows that strength is coming back in the index.
Pivot percentile is 0.05, which means it’s tight. This indicates we might see a sharp move in the direction of the trend tomorrow.
However, there’s one small negative point – even though the market was green today, sellers’ volume was 5 million higher than buyers.
Keeping all this in mind, my view is – tomorrow we might get a shakeout.
Either as a gap-down or a sudden dip. Don’t panic in that dip, instead, wait for Nifty to cross the pivot and then look for long positions.
Support will be at 24555. Resistance at 24660.
NSE:BANKNIFTY is also getting ready.
NSE:CNXPSUBANK and financials should lead the rally.
Resistance at 55344. Support at 55100.
Pivot at 55182. If it opens above pivot, you can go long with stoploss.
Sector-wise, NSE:CNXPHARMA and NSE:CNXAUTO are looking strongest.
Take care. Have a profitable tomorrow.

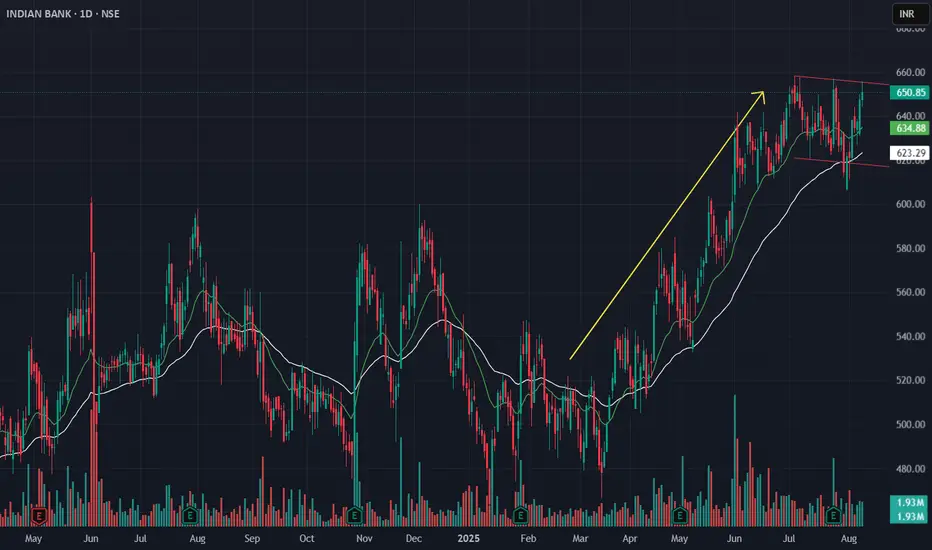
Indian Bank – Flag Breakout Setup from Sector Rotation ScreeningIn the latest sector rotation review, PSU Banks moved into the Improving quadrant, showing early signs of leadership. Within this space, Indian Bank was shortlisted based on:
-- Alignment of 9 EMA & 21 EMA across daily and weekly timeframes
-- MACD trending positively
-- EFI (Elders Force Index) showing accumulation on higher timeframes
Technical Structure:
On the Daily and Weekly charts, Indian Bank is consolidating in a flag pattern after a strong uptrend. The EMAs are acting as dynamic support. On the Hourly chart, a rounding base is forming, indicating early recovery of momentum.
Trade Plan:
-- Breakout Entry: Above ₹656 with strong volume
-- Stop Loss: ₹640 (ATR-based)
-- Targets: ₹695 → ₹716 → ₹746
This setup aligns both with sector momentum and technical structure, offering a favorable risk–reward. Watch for sustained momentum on the breakout day to confirm entry.
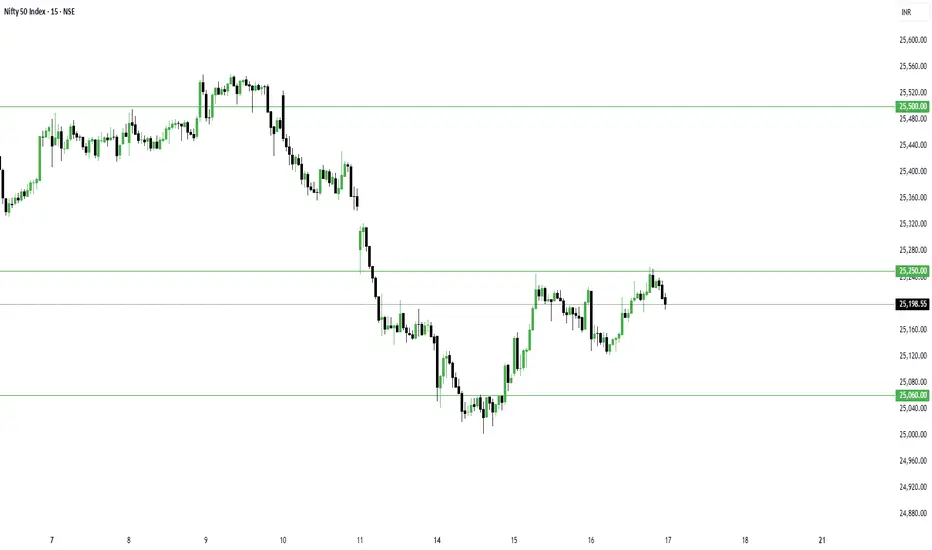
Nifty Holds Positive Trend, BankNifty Eyes New High - Key LevelsThe missing piece we talked about yesterday — a close above 25200 — is now complete.
Selling pressure has reduced, although we didn’t get the strong follow-up buying we expected.
But from a trading perspective, today was superb:
- NSE:SPORTKING , which we bought yesterday, gained another 7% today.
- NSE:EDELWEISS intraday setup delivered a solid 6% move.
- NSE:TATAPOWER ATM options shot up by 100%.
- As mentioned in yesterday’s commentary, NSE:CNXPSUBANK performed well — I’m holding NSE:BANKBARODA and had added #SBIN a few days back.
- NSE:SHYAMMETL closed strong today; I’ve taken it as a positional trade.
- I exited NSE:CUPID today and replaced it with $NSE:MOBIKWIK.
In total, I’m holding 4 open positions, and I’ll continue to hold them until they overextend.
Coming to the market:
Nifty formed a Supply Candle today as sellers’ volume was 33 million higher than buyers.
The positive takeaway is that selling pressure has eased, and the trend has moved back to the positive zone.
Considering these conditions, tomorrow is likely to remain sideways.
NSE:NIFTY levels for tomorrow:
- Resistance: 25250 — a close above this could trigger short covering up to 25500
- Support: 25155
BankNifty looks stronger than Nifty and seems ready for a new all-time high.
NSE:BANKNIFTY levels for tomorrow:
- Support: 57000
- Resistance: 57300 — a breakout above this can push it to fresh highs
Sector-wise, #PSUBANKS remained the strongest today.
That’s all for today.
Take care.
Have a profitable tomorrow.
BANKINDIABANKINDIA is currently trading above resistance breakout and also recently has shown Inverted H&S breakout as well. Volume in recent session has been increased. If we check pattern target then it has a potential to go up to 160-70 level. I may change my view if it closes below 120. In recent time I have observed traction in all PSU banking stock. Is it something that we don't know!! Chart is indicating something to be watched very closely. Keep it on radar.

SBIN Upside potential with a Bullish Bias The Bank Index has been performing since few days
Also structure level SBIN is poised for an upmove, it has a pattern Inverse Head & Shoulders which is a bullish pattern and with a significant upside technically
Suggested to Buy at CMP or wait to retrace at 780s zone
SL 750s zone
Target 870s zone

PSU Bank Index - Breakout A strong move today, and has given a breakout from an inverted H&S pattern.
Breakout at 6300
Target : 7225
Sl 6100

CNXPSUBANKInverse head and shoulder formation gives a confirmation that price has reversed well from lower end of the parallel channel and ready to move up. middle resistance zone has be bo and retested as well.

PSU BANKSHello & welcome to this analysis
PSU Banks which had been outperforming Private Banks and the broader market since 2020 have since June 2024.
It has for now stopped the lower high formation, for more strength it needs to sustain above 7250 and confirm a higher low formation.
Happy Investing & Trading

Indusbank | Trendline Breakout ⭕️ Swing Trading opportunity: Price Action Analysis Alert !!!⭕️
💡✍️Technical Reasons to trade or Strategy applied :-
✅Inverted Head & Shoulder Chart Pattern Bull Breakout
✅Breakout confirmed
✅Rise in Volume
✅Good 3 touches Trendline Breakout with volume
✅Clear uptrend with HH & HLs sequence
✅ Order block as potential Supports
✅Check out my TradingView profile to see how we analyze charts and execute trades.
🙋♀️🙋♂️If you have any questions about this stock, feel free to reach out to me.
📍📌Thank you for exploring our idea! We hope you found it valuable.
🙏FLLOW for more !
👍LIKE if useful !
✍️COMMENT Below your view

AxisBank | Trendline BUll Breakout ⭕️ Swing Trading opportunity: Price Action Analysis Alert !!!⭕️
💡✍️Technical Reasons to trade or Strategy applied :-
✅Inverted Head & Shoulder Chart Pattern Bull Breakout
✅Breakout confirmed
✅Rise in Volume
✅Good 3 touches Trendline Breakout with volume
✅Clear uptrend with HH & HLs sequence
✅ Order block as potential Supports
✅Check out my TradingView profile to see how we analyze charts and execute trades.
🙋♀️🙋♂️If you have any questions about this stock, feel free to reach out to me.
📍📌Thank you for exploring our idea! We hope you found it valuable.
🙏FLLOW for more !
👍LIKE if useful !
✍️COMMENT Below your view !


All PSU Bank stocks are fakeouts according to my setups I daily make educational content videos for swing / positional trading

PSUBANK: Elliott Wave Analysis and Technical BreakoutTechnical Analysis: PSUBANK Index
Elliott Wave Analysis
The chart reveals a potential Elliott Wave structure within the PSUBANK Index. We're currently observing a bullish development within wave 5. This bullish impulse is supported by a clear upward trendline breakout.
Key Points:
Resistance Trendline Breakout: The index has decisively broken above the resistance trendline, suggesting a potential reversal of the previous downtrend.
Bullish Divergence: The presence of a bullish divergence between price and momentum indicators, often signals a potential trend reversal. This divergence adds credence to the bullish outlook.
Wave Structure: The current structure aligns with an impulsive wave pattern, where wave 5 is typically the dynamic move after corrective 4th Elliott Wave sequence.
Potential Scenario
Based on this analysis, we can anticipate a continuation of the bullish trend, potentially leading to the development of wave 5. This could drive the index higher, with the upside potential potentially reaching the 8000-8200 zone.
Trading Implications:
Bullish Bias: Maintain a bullish bias for the PSUBANK Index, given the strong technical signals and potential for further upside.
Entry Points: Consider entering long positions on pullbacks (if any).
Stop-Loss: Place a stop-loss below the 6185 level, which would invalidate the bullish scenario.
Risk Management: Implement proper risk management techniques, such as using stop-loss orders and position sizing, to protect your capital.
This analysis is based on Elliott Wave Theory and technical analysis, which involves multiple possibilities and interpretations. The information provided is for educational purposes only and should not be considered as financial advice. It's crucial to conduct your own research and consult with a financial advisor before making any investment decisions. There is always a risk of being wrong, and users are advised not to trade or invest solely based on this analysis.
Remember: Elliott Wave analysis is a complex tool that requires practice and experience. It's essential to approach it with caution and always consider the potential risks involved in trading.
I am not Sebi registered analyst.
My studies are for educational purpose only.
Please Consult your financial advisor before trading or investing.
I am not responsible for any kinds of your profits and your losses.
Most investors treat trading as a hobby because they have a full-time job doing something else.
However, If you treat trading like a business, it will pay you like a business.
If you treat like a hobby, hobbies don't pay, they cost you...!
Hope this post is helpful to community
Thanks
RK
Disclaimer and Risk Warning.
The analysis and discussion provided on in.tradingview.com/u/RK_Charts/ is intended for educational purposes only and should not be relied upon for trading decisions. RK_Charts is not an investment adviser and the information provided here should not be taken as professional investment advice. Before buying or selling any investments, securities, or precious metals, it is recommended that you conduct your own due diligence. RK_Charts does not share in your profits and will not take responsibility for any losses you may incur. So Please Consult your financial advisor before trading or investing.
