Market Structure Expansion After Corrective PullbackIntro / Overview
This chart highlights a clean price-action based structure where the market moves through impulsive advances followed by corrective pullbacks.
The focus is strictly on natural swing behavior and structure continuation, not on Elliott Wave theory.
⸻⸻⸻⸻⸻⸻⸻⸻⸻⸻⸻⸻⸻⸻
Concept
Markets generally move in phases:
• Expansion (Impulse)
• Retracement (Correction)
• Continuation
By tracking swing highs and swing lows, we can identify where price is pausing, correcting, and preparing for the next directional move.
⸻⸻⸻⸻⸻⸻⸻⸻⸻⸻⸻⸻⸻⸻
Chart Explanation (Step-by-Step)
1. Initial Expansion
• Price forms a strong directional move with higher highs and higher lows.
• This establishes bullish structure and directional bias.
2. Corrective Pullback
• Price retraces in a controlled manner.
• No structural breakdown occurs, indicating a healthy correction.
3. Stronger Expansion
• Momentum accelerates and price pushes higher.
• This move confirms acceptance above the previous structure high.
4. Secondary Pullback
• Another corrective phase follows the expansion.
• Price forms a higher low, preserving bullish structure.
5. Projected Continuation
• Based on prior expansion behavior, price is projected to continue higher.
• This projection is structure-based, not a prediction.
⸻⸻⸻⸻⸻⸻⸻⸻⸻⸻⸻⸻⸻⸻
Observation
• Each pullback remains structurally valid
• Expansion moves show increasing momentum
• Corrections are shallow and controlled
• No major breakdown in swing structure is observed
This behavior often reflects trend continuation conditions.
⸻⸻⸻⸻⸻⸻⸻⸻⸻⸻⸻⸻⸻⸻
Why It Matters?
Understanding structure helps traders:
• Avoid emotional entries during pullbacks
• Align with market acceptance and direction
• Focus on continuation zones instead of chasing price
Structure-based analysis keeps attention on price behavior, not assumptions.
⸻⸻⸻⸻⸻⸻⸻⸻⸻⸻⸻⸻⸻⸻
Conclusion
This chart demonstrates how simple swing structure can be used to map market behavior and potential continuation zones.
The projection is not a forecast, but a structural reference based on previous price action.
Always wait for confirmation and manage risk accordingly.
⸻⸻⸻⸻⸻⸻⸻⸻⸻⸻⸻⸻⸻⸻
⚠️ Disclaimer
📘 For educational purposes only
🙅 Not SEBI registered
❌ Not a buy/sell recommendation
🧠 Shared purely for learning and pattern understanding
📊 Not Financial Advice
Pullback

Trade Catalyst Series - Episode 2 // GOKALDAS EXPORTSHey folks,
Today in new developing events in US-India deals, I have come with another stock to lookout.
This one is focused only for long-term window with the latest Reciprocal tariffs in talk.
1. Macro Overview
The US-India Interim Trade Agreement published today is a structural game changer for Indian textiles.
The Headline: US Reciprocal Tariffs on Indian exports (apparel) slashed from ~50% to 18%.
The Significance: This is not just a rollback; it is a competitive flip. For the last decade, India (tariff ~20%+) lost share to Vietnam and Bangladesh (zero or low duty).
But now new Hierarchy we have :
India: ~18% Duty
Vietnam/Bangladesh: ~20% Duty
China: ~30-35%+ Duty
Result: India is now the most cost-efficient sourcing hub for US brands.
2. Sector Impact: The "China+1" Accelerator
The entire Indian textile export sector moves from "survival mode" to "growth mode."
Exporters were absorbing 10-15% of the tariff burden to keep clients. This cost instantly vanishes, flowing directly to the bottom line.
US brands will likely to shift volume from Vietnam to India capturing the 2% duty spread.
3. Stock Spotlight: Why GOKEX you ask?
Gokaldas Exports is the highest-beta play on this specific catalyst.
~70% of GOKEX’s revenue comes from the US. No other major listed player (KPR Mill, Trident) has this level of direct sensitivity to US tariffs.
GOKEX recently acquired Atraco (Kenya) and Matrix (India). These assets were dragging earnings due to low utilization. With the tariff barrier removed, GOKEX can fill these factories with high-margin US orders.
4. Fundamental Check
Q3 FY26 (Bottom): Net profit crashed 71% YoY to inr14.6 Cr; Margins slumped to 7.7%. This is now priced in as the worst-case scenario.
FY27 Outlook (Recovery):
Revenue is expected to grow 15-20% as order books swell.
Margins: Projected to reduce back to 11-13% + tariff savings.
Valuation: Trading at ~26x depressed earnings. If earnings double in FY27 (base case on margin normalization), forward P/E drops to an attractive 13-15x.
5. Technical Setup - Daily Chart
The stock has already rallied ~40% this week.
Now on daily frame the RSI shows it is in overbought zone due to rush buying of the stock.
Next to watch out is for a minor pull back to the near support zone (here 0.786 level of fib) to make an entry.
the next resistance to watch will be 900. for that I would be monitoring the order book of the company in the next quarter.
6. Key Risks
-> The stock already rallied ~40% on rumors. A short-term dip is highly likely as other traders book profits.
->US Recession: Lower tariffs don't matter if US consumers stop buying clothes. Monitor US retail data closely.
-> A strengthening of rupee could eat into the new margin gains.
7. Final Verdict
I am long on this one so will be keep buying on Dips.
first Entry : 700-720
T1 : 1000
T2 : 1150
SL : 650
The 18% tariff rate is giving Indian exports distinct edge over Vietnam. so major focus after entry will be on the management commentary of order book visibility for Q1 FY27. If this all confirms volume shifts from Vietnam, the stock heads to inr1,000+, achieving our t2 or a new ATH.
Future episodes will explore additional sectors and companies that could emerge as beneficiaries of evolving global trade partnerships. If your eye catches on to some particular stock reflecting on the same let me know in the comments below I will do a episode on it too.

Gold at Make-or-Break Zone | Channel Support Under TestGold is currently trading inside a rising channel and has pulled back toward the lower side of the structure. This move looks more like a healthy correction rather than a breakdown, as long as price continues to hold the marked support area.
If buyers step in near channel support, upside continuation remains possible toward the higher zone. A clear break below support, however, would weaken the structure and shift the bias to the downside. For now, this is a wait-and-react zone, not a chase.
⚠️ Disclaimer
This analysis is for educational purposes only and should not be considered financial advice. Trading involves risk. Please do your own research and use proper risk management.

L & T (Larsen & Toubro) – 4H | From Breakdown to Bounce?L & T has delivered a sharp corrective move from the upper supply zone, flushing out weak hands and reaching a well-defined higher-timeframe demand area. This zone previously acted as strong support and is now being retested under pressure.
The reaction from this area will decide the next big move.
🔹 Market Structure: Higher-timeframe uptrend intact
🔹 Current Phase: Deep pullback into demand
🔹 Key Zone: Marked support area (buyers’ battlefield)
🔹 Trade Idea: Long only if price holds and stabilizes
🔹 Invalidation: Clean break below demand
📌 What makes this interesting:
Strong uptrend before correction
Fast sell-off into support (possible exhaustion)
Defined risk with clear invalidation
Attractive reward if trend resumes
📈 A sustained hold above support can trigger a mean reversion move back towards the supply zone.
⚠️ Failure to hold support may open the door for deeper correction.
💡 Sometimes the best trades appear when fear is loud and risk is clear.

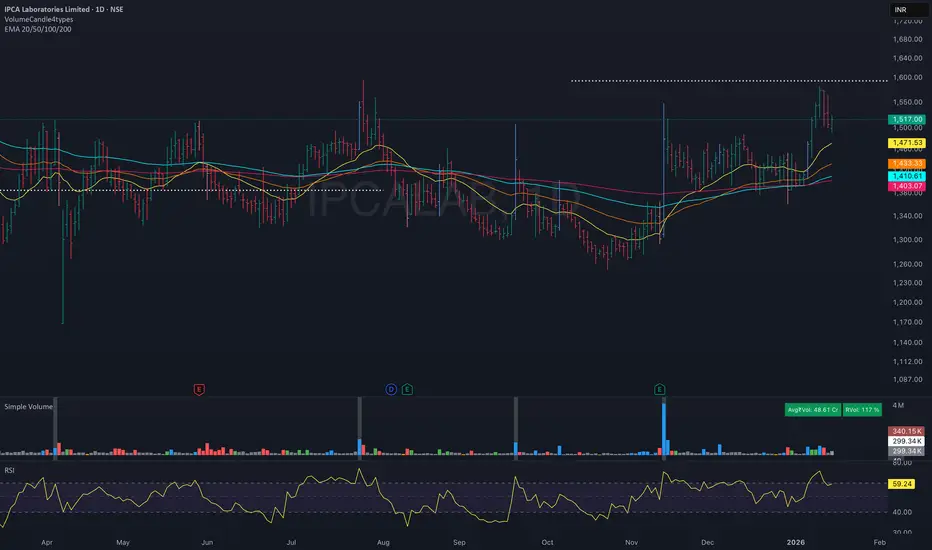
IPCA Labs | Base Formation with EMA Support – Breakout WatchNSE:IPCALAB Price is trading above the 20/50/100 EMAs, indicating improving short-term momentum after a prolonged consolidation. Volume expansion suggests accumulation, while RSI remains above 50 without being overbought, leaving room for upside. A sustained move above the range resistance could trigger a fast momentum move, while the EMA zone acts as immediate support.
Gold (XAUUSD) – 4H Chart Update | Breakout → Pullback Phase!Hello Everyone,, i hope you all will be doing good, let's check the updates of Gold as it has already done the hard part, the breakout above the previous resistance is in place. After the breakout, price pushed higher and is now doing what strong markets usually do: a pullback.
This pullback is not a sign of weakness yet. In fact, it is a healthy reaction, where the market is testing whether the old resistance can act as new support. This phase decides continuation or failure.
As long as Gold holds above the marked support zone, the structure remains positive, and continuation toward higher levels stays open. What we want to see here is price stabilizing, not panic selling.
If support fails and price starts accepting below it, then the breakout thesis weakens. Until that happens, this move should be treated as a normal post-breakout retest.
Key Levels to Watch
Breakout Level / New Support: Around 4330–4340
Immediate Support Zone: Pullback base area
Upside Continuation: Possible if support holds
Bias: Neutral-to-Bullish above support
Well Guys Most traders get confused during pullbacks. Strong moves rarely go straight up, continuation usually comes after patience, not after chasing candles.
Disclaimer: This analysis is for educational purposes only and should not be taken as financial advice. Please do your own research or consult your financial advisor before investing.
Give likes and comment your thought on my analysis, thankyou everyone!

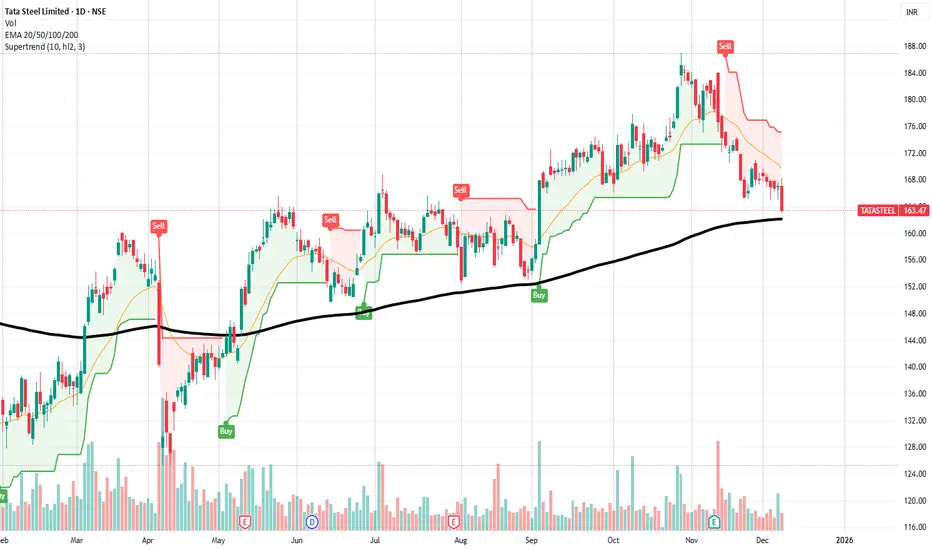
Tata Steel | 200 EMA Support + MACD Bullish Setup | Perfect std.Tata Steel has entered a high-probability reversal zone, combining multiple technical signals that traders often use to identify strong opportunities.
1. Price Sitting Exactly on 200 EMA (Major Trend Support)
The stock has reached the 200 EMA, a long-term trend indicator that acts as strong dynamic support.
From the chart, the last 3 touches to the 200 EMA (May, June & September) resulted in sharp upward reversals.
This increases the probability that buyers may step in again at this level.
------------------------------------------------------------------
2. MACD Close to Bullish Crossover
The MACD histogram is reducing red bars and is moving toward the zero line, indicating that selling pressure is cooling down.
A bullish crossover near a major support often marks the beginning of an upswing in momentum.
------------------------------------------------------------------
3. Stock Appears Short-Term Oversold
Price is stretched away from the short-term moving averages (20 & 50 EMA), and recent candles show slowing selling pressure.
This supports the idea of a bounce or trend reversal from the current zone.
------------------------------------------------------------------
4. Supertrend Still in Sell but Losing Momentum
Supertrend remains red, but the fall has slowed significantly.
A close above 170–172 will flip Supertrend to Buy, confirming the reversal.
Support Zones
162–164 → 200 EMA support zone
158 → Last horizontal support (critical)
Resistance Zones
170 → Short-term resistance (20 EMA)
176–178 → Strong reversal confirmation zone
185 → Major swing resistance
📈 Possible Bullish Scenario (Primary View)
If the price holds above 162–164 and MACD turns positive:
Targets: 170 | 176–178 | 185 | Stop-loss: Below 160 (Daily close)
📝 Notes (Important for Traders)
This is a technical analysis idea, not a buy/sell recommendation.
Risk management is important: adjust SL according to your trading style.
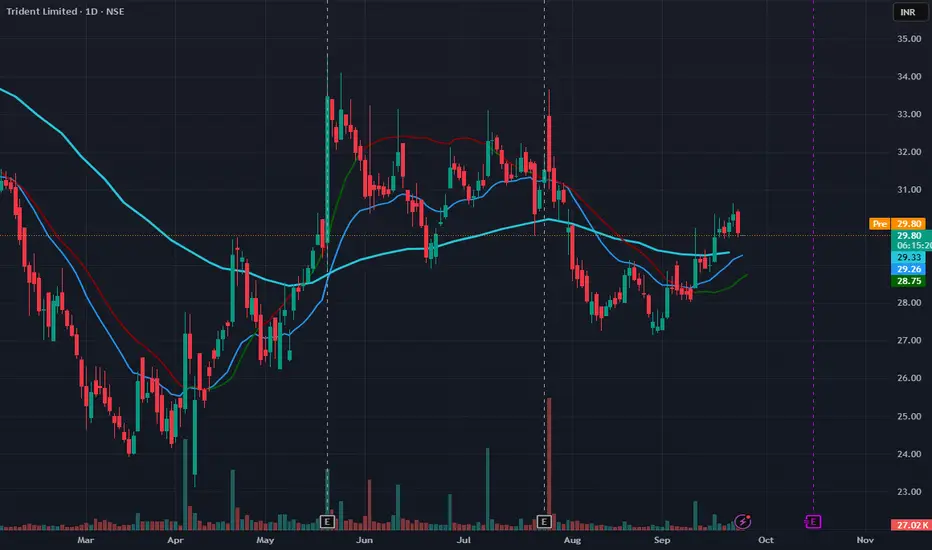
Pullback or Pause Before Continuation?Markets don’t move in straight lines.
They advance, they pull back, they test conviction.
Trident is doing exactly that right now.
🔎 Technicals
Price bounced from the ₹28 zone, reclaiming the 20 & 50 MAs.
Now trading around ₹29.8, just under the 200MA.
Recent red candle shows sellers still defending higher levels.
Volume remains steady → no signs of panic selling yet.
This isn’t collapse — it’s the pause that tests patience.
🧠 Mindset Lesson
This is where most traders slip:
They chase every green bar, then panic on the first red.
They want “instant gratification,” not confirmation.
Professionals know pullbacks are not enemies — they’re filters.
A clean retest around ₹29–29.3 that holds would show buyers still in control.
The breakout above ₹31 only matters if you had the discipline to wait.
👉 The lesson: Don’t confuse a pause with failure. Pullbacks are the market’s way of asking if you’re disciplined enough to wait for clarity.
💡 Save this chart. Follow for daily trading mindset + education that rewires you from beginner to master.
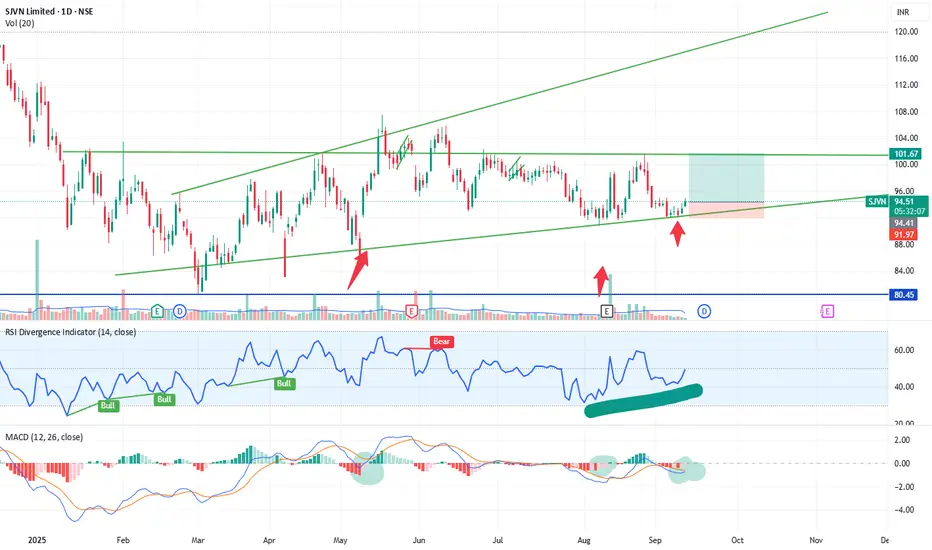
Study & Analysis: Bullish Setup in SJVN (NSE)SJVN Ltd. is showing signs of a potential bullish reversal after taking support at the lower boundary of an ascending channel. The stock has formed a consistent pattern of higher lows and is currently trading at ₹94.55 with increasing volume and positive momentum on key indicators.
✅ Key Technical Highlights:
📈 Chart Pattern:
Trading within a well-defined ascending channel.
Recently bounced off the channel support line (third touch confirmation).
Next resistance zone lies near ₹101.67, which aligns with the upper trendline and horizontal supply zone.
📊 Indicators:
RSI Divergence: Bullish divergence seen — RSI made a higher low while price made a lower low, signaling potential reversal.
MACD Bullish Crossover: MACD line has crossed above the signal line near oversold levels — historically a strong bullish sign.
Volume: Notable volume spike observed at support — indicating accumulation.
📏 Risk-Reward Zone (For Study Purposes Only):
Entry Zone: ₹93–₹95
Target: ₹101–₹102
Stop Loss: Below ₹91.97
⚠️ Note:
This post is purely for educational and analysis purposes only. It is not a recommendation to buy or sell any security. Always do your own research or consult a qualified advisor before making investment decisions.
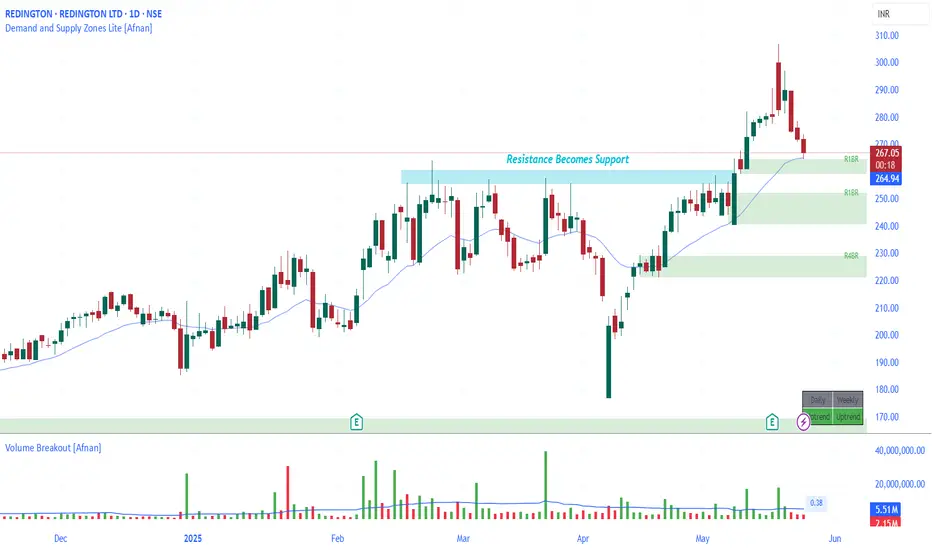
Strong Confluence Setup : REDINGTON at Crucial Demand Zone
REDINGTON is showing signs of a promising technical setup — something that can catch the attention of demand and supply zone traders. Let’s break down the analysis in simple words so that even a beginner can understand why this stock might be at an interesting level.
🔥 The Demand Zone Setup 🔥
The stock is currently hovering around a Rally-Base-Rally demand zone. This is a price area where big institutions may have left pending buy orders before pushing the price higher.
📉 Confluence of EMA and Support Flip
Here’s where the setup gets even more interesting. Apart from the demand zone:
REDINGTON is trading near its 20 EMA — a dynamic support level that often helps price bounce in uptrends.
There was a recent resistance breakout — price struggled to go above a certain level, broke through it with heavy volume, and is now returning to retest that same level.
Resistance turns into support : This classic law of polarity increases the odds of a bounce from here.
💡 Volume Analysis Matters
The breakout candle had heavy volume. Now, as the price pulls back to the demand zone, volume is dropping — this is a healthy sign. It suggests the sellers are weakening and the buyers might soon step in again.
👣 Smart Money Footprints & Pending Orders
Demand zones reflect unfilled institutional orders. If smart money had previously bought here, they may defend this zone to protect their positions. That could mean more buying at this level, pushing the price higher once again.
⚠️ But Wait — Risk Management is Key!
Even high-probability setups can fail — and that’s just the nature of trading. Always use a stop-loss. The goal isn’t to be right all the time — it’s to manage risk smartly and survive long enough to be consistently profitable.
📊 Setup Summary
Price near RBR demand zone Strong case for smart money entry
Confluence of 20 EMA support
Polarity principle : Resistance turned into support
Volume drop on pullback — bullish signal
Always place stop-loss — risk management matters
📌 "In trading, confidence comes from preparation — not prediction."
Lastly, Thank you for your support, your likes & comments. Feel free to ask if you have questions.
⚡ Stay focused, trade smart, and let the charts do the talking! ⚡
This analysis is for educational purposes only and is not intended as a trading or investment recommendation. I am not a SEBI registered analyst.
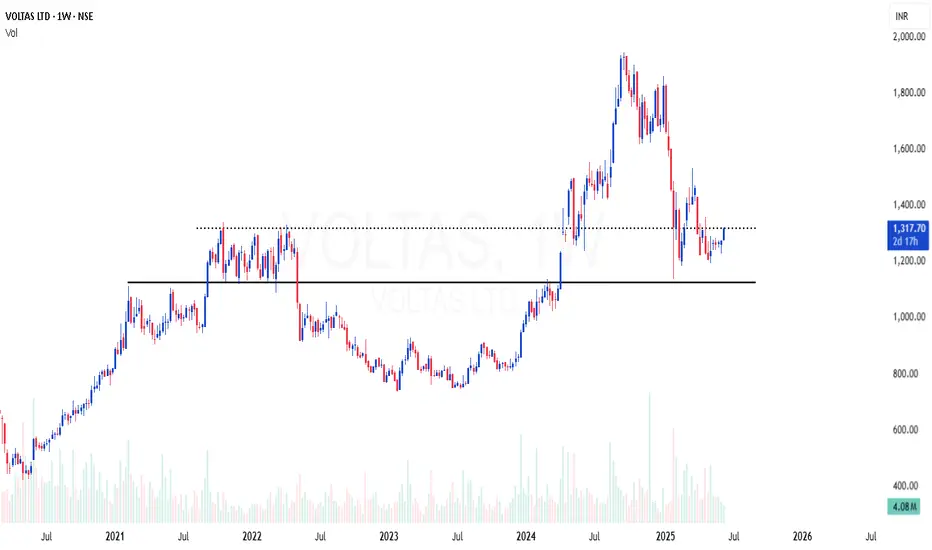
VOLTAS | Excellent area of value in weekly time frameVOLTAS | Excellent area of value in weekly time frame
Weekly 200 EMA support
RSI bullish divergence
Good risk reward
Quality stock at decent correction , looking good for reversal from here
CARERATING | Channel + Flag breakout with 200 EMA supportCARERATING | Channel + Flag breakout with 200 EMA support
High probable setup
CMP : 1237
SL : 1150
Target : 1550

SOBHA | Breakout after consolidation + 200 EMA supportSOBHA | Breakout after consolidation + 200 EMA support
CMP : 1433 (Dip : 1300)
SL : 1200
Target : 2000

Nifty at Crucial Juncture. 22670 To Watch For!Nifty has shown some resilience despite Global Fallout following Tariff War.
Scenario B had been in the Play until Friday.
However The Retaliation from China led to Historical Correction in Global Market.
Considering above Change in Global Sentiment, Our Approch needs some reconsideration.
With Scenario C likely to come into play with Big Gap down suggested by Gifty, let's have a look at Crucial Level that is 22670.
Whether Nifty sustains and Closes the coming Week above it or Below it could decide which Scenario plays out
Scenario A - Nifty doesn't break the Low made at 22000 and closes above 22670. This could lead to further upside testing 24750 25000 Zone.
Scenario B - Nifty falls out of the Green Parallel Channel closing below 22670. This could lead to further downside testing 21300 Zone.
However in either scenario Chances of Downfall Continuation looks less likely given the Weakness Suggested by The Divergence in RSI
And Nifty trading near Demand Zone.
We Need a decent Pullback before further Greater Downfall..
Which Scenario do you think will be in Play this week?
We will be on sidelines next week unless Nifty takes Support at 22670 Zone or tests 21300 Zone.
🤞

HDFC AMC on support HDFC AMC looks good reason --
* Fundamentals Strong
*price is near about its Previous all time high

GAEL - Price near Major Support lineThe price has been consolidating since 2022 and is currently trading near a key support level around the 110 range. Previous pullbacks near this support level, as indicated by the green arrows, have shown significant reversals. Currently, a morning star candlestick pattern is forming near the support zone, suggesting potential bullish momentum. However, confirmation of the pullback will require waiting until this weekend's close.

SteelCast ready for Modi 3.0Steelcast is holding strong at the trendline and touching the 200 EMA. I'm going long! In my view, the steel sector will do well under the next government. To the moon we gooooo!
🚨 DYOR & SL Must, not sebi reg.
#NiftyBank #Nifty #btst #INTRADAY #StocksToWatch #GIFTNIFT #swingtrade

GAIL: Pullback swing trade📊 Analysis :
Price trying to structure shift from Down trend to uptrend. Taking support on 21EMA with hammer candle. looking good for bullish move.
📈 Trading Plan :
Entry: Buy above 205.75 (wait for a breakout above candle at least 15-30 min with strong volume confirmation).
Target 1: 222
Target 2: 233 and so on...
Stop-Loss: 199 (Weekly closing basis)
Will update further price direction once price starts moving in bullish direction.

Real Success Rates of the "Rising Wedge" in TradingReal Success Rates of the Rising Wedge in Trading
Introduction
The rising wedge, also known as the "rising wedge" in English, is a chart pattern that has a remarkable success rate in trading. This analysis details its performance, reliability and complementary indicators to optimize its use.
Success Rate and Performance
-Key Statistics
Overall success rate: 81% in bull markets
Average potential profit: 38% in an existing uptrend
-Breakout Direction
Bearish: 60% of cases
Bullish: 40% of cases
Contextual Reliability
Bull market: 81% success, average gain of 38%
After a downtrend: 51% success, average decline of 9%
Important Considerations
The rising wedge is generally a bearish pattern, indicating a potential reversal.
Reliability increases with the duration of the pattern formation.
Confirmation of the breakout by other indicators, especially volume, is crucial.
Complementary Indicators
-Volume
Gradual decrease during formation
Significant increase during breakout
-Oscillators
RSI (Relative Strength Index): Identifies overbought/oversold conditions
Stochastics: Detects price/indicator divergences
-Moving Averages
Crossovers: Signal trend changes
-Dynamic Support/Resistance: Confirm the validity of the wedge
-Momentum Indicators
MACD: Identifies price/indicator divergences
Momentum: Assesses the exhaustion of the trend
-Other Elements
Fibonacci Levels: Identify potential support/resistance
Japanese Candlestick Analysis: Provides indications of reversals
Conclusion
The rising wedge is a powerful tool for traders, offering a high success rate and significant profit potential. The combined use of complementary indicators increases the reliability of the signal and improves the accuracy of trading decisions. It is essential to look for a convergence of signals from multiple sources to minimize false signals and optimize trading performance.
_______________________________________________
Here are the best times to enter a trade after a rising wedge, in a professional manner:
-The confirmed breakout
Wait for the candle to close below the support line of the wedge.
Look for a significant increase in volume during the breakout to confirm its validity.
-The retest
Look for a pullback on the broken support line, which has become resistance.
Enter when the price rebounds downward on this new resistance, confirming the downtrend.
-The post-breakout consolidation
Identify the formation of a flag or pennant after the initial breakout.
Enter when this mini-formation breaks in the direction of the main downtrend.
-The confirmed divergences
Spot bearish divergences on oscillators such as the RSI or the MACD.
Enter when price confirms divergence by breaking a nearby support.
-Timing with Japanese Candlesticks
Identify bearish formations such as the Evening Star, Bearish Harami, or Dark Cloud.
Enter as soon as the next candle confirms the bearish pattern.
-Important Considerations
Always place a stop-loss to manage risk effectively.
Be patient and wait for the setup to be confirmed before entering the trade
Check the trend on higher timeframes to ensure the consistency of the trade.
Integrate the analysis of the rising wedge with other technical indicators to improve the quality of decisions.
By following these recommendations, traders can optimize their entries on rising wedges while minimizing the risk of false signals.

ASIANPAINTASIANPAINT has given pullback and renounced from 200 DMA. Chances are there that it may change its trend. Long term investor can consider this pullback.

ETHOSLTD ETHOSLTD can be a good bet on this pullback. Currently available at very decent risk-reward. Do your due diligence.

Nifty 50-October 2024 viewI feel it is time to be little cautious.
Post 4th June(the election results day), we have seen a good rally in market from 21300 to 26250 today which is almost 25% and that too without a significant pull back or correction.
The rally since past couple of weeks is mainly due to large caps.
There is no reason to be extremely bearish but as per fib retracement, we are near golden ratio of 61.8%.
We might see a pullback or consolidation here before next move towards 27000+ levels.
Important levels to look at is 26000 below which we should expect 25800, 25500 and 25350.
Midsmall caps might see a bigger pullback than Nifty hence follow risk management in your swing positions. Nifty metal is looking quite bullish and is sector to keep in watchlist.
Please note that I am not expecting a crash or big correction and hence please don't overreact and do panic selling.

Ready for Next LegNSE:SANOFI after Breaking out Heavily with Volumes took some Rest on the Accumulation Zone and now that 50 EMA has caught up and Took Support Today. Keep in Radar
Check out my other stock ideas below until this trade gets activated, I would love your feedback.
Disclaimer: This analysis is intended solely for informational and educational purposes and should not be interpreted as financial advice. It is advisable to consult a qualified financial advisor or conduct thorough research before making investment decisions.
