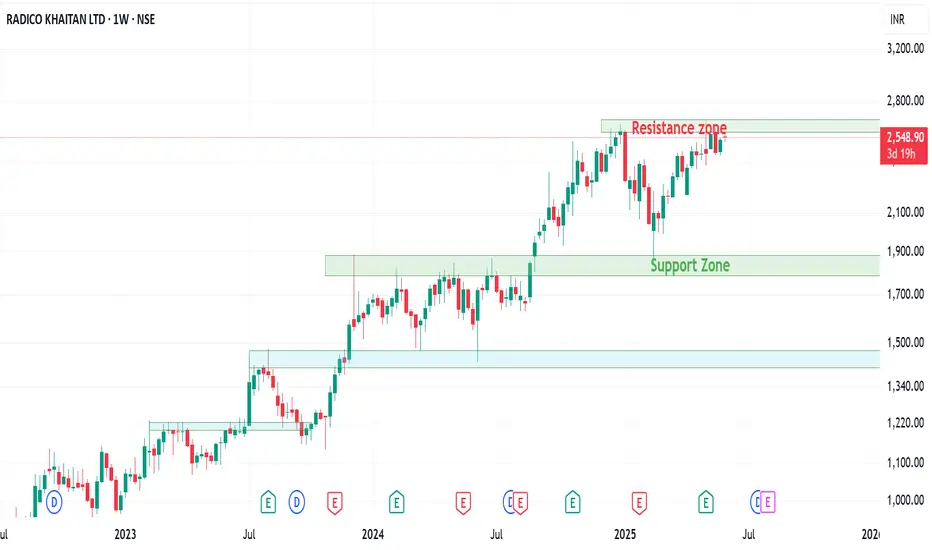
Radico Khaitan at a Crossroads: Support, Resistance & MomentumThe stock is in a bullish trend and is forming a box consolidation and break outs.
On the weekly charts the stock is trading around the resistance zone and there are chance of either breaking out or retesting to the lower levels.
Stock seems strong bullish on the charts but indicators are suggesting a bearish move as the stock is around the resistance zone.
Short sell can be initiated in the stock with a strict SL.
On the bullish side the stock is respecting the monthly 20 EMA and has retested it thrice. Radico if turns bearish can be entered around the moving average as Good R:R in the trade can be seen.
Even on the weekly charts, the stock is trading above the moving averages chance of a retest are there but short sell the stock once the support zone in taken out.
Watch the stock a good ROI can be generated in the stock after the break out the stock will be forming new ATHs.
Wait for a pattern near the resistance either for a bearish or bullish move as it is trading around the crucial recent high levels of 2600-2680.
Stochastic indicator on the Monthly TF is trading in overbought zone while on the weekly TF its showing some bearish divergence. Even the monthly RSI is showing a bearish divergence.
Wait for the price action and trade accordingly.
Radicoanalysis
RADICO FOR SHORT TERMRADICO good above 2260 on CLB.
Breakout Stock
Weak Below 1980 on Closing Basis.
Ready For Upside 3000-4000.
Time Period 2-3 Months.
For Educational Purpose only.

Bullish Breakout Potential for Radico Khaitan Above 2040Radico Khaitan has been showing signs of a strong bullish trend, and the recent price action suggests a potential breakout above the 2040 level. If the stock sustains above this channel resistance, we could witness a significant upmove.
Technical Indicators: The stock is currently trading at ₹1,732.10, with a recent high of ₹1,744.401. The 52-week high stands at ₹1,885.10, indicating room for growth.
Volume Analysis: A surge in trading volume could accompany the breakout, confirming the strength of the move.
Price Target: Traders should look for initial targets near the 52-week high, with further upside potential if the momentum continues.
Stop Loss: A stop loss can be placed below the recent swing low to protect against any false breakouts.
Conclusion: Radico Khaitan’s breakout above 2040 could offer a lucrative opportunity for traders. Keep an eye on volume and price action for confirmation.
Remember to adjust the figures according to the latest market data before posting. Happy trading!

Radico pattern targetRadico pattern target. Price action target is more important for me and i mostly do not just fit and wait for pattern target even price action is saying to exit or hold..

Radico Khaitan - Swing tradeFlag breakout in radico. swing traders can plan a trade here with SL below the bottom trendline.


Beautiful channel patternThe nice channel you can enter a long or short position at the respective key levels/

RADICO KHAITAN - AT THE EDGE OF THE TRIANGLE PATTERNRADICO is at the edge of the triangle pattern.A closing above 310 will lead to target of 328(first resistance) and then 360 will be the next barrier.Failing the pattern on downside will lead a downside move till 285 which will be the first support and 250 the next major support.earning results are to be announced in 5 days so better to keep this in watchlist to see for a breakout or a downside.
