Warren Buffett Core Rules for Building Wealth!Hello Traders!
Warren Buffett is known as the “Oracle of Omaha” not because he picks magical stocks, but because he follows timeless principles that build wealth slowly and safely.
His rules are simple, but powerful, and every trader or investor can learn from them.
1. Rule No. 1: Never Lose Money
Buffett’s first rule is all about capital protection.
Before entering any investment, ask one question: “What is my real downside here?”
Building wealth starts with protecting what you already have.
2. Rule No. 2: Never Forget Rule No. 1
Most people break this rule because emotions take over.
They underestimate risk and overestimate their confidence.
A smart investor never lets their guard down.
3. Invest Only in What You Understand
Buffett only invests in businesses he clearly understands.
If you don’t understand how a company makes money, you shouldn’t invest in it.
Confusion always adds risk.
4. Be Fearful When Others Are Greedy, and Greedy When Others Are Fearful
When the crowd is celebrating, assets are usually overpriced.
When the market is in panic, opportunities quietly appear.
A contrarian mindset creates long-term winners.
5. Focus on Long-Term, Not Short-Term Noise
Short-term ups and downs are temporary.
Long-term business growth is what builds real wealth.
Buffett thinks in decades, not months.
6. Buy Great Businesses at a Fair Price
Don’t chase cheap stocks, chase quality.
A great business may look expensive today, but it can reward you for years.
Price is what you pay; value is what you get.
7. Do Not Rely on Market Predictions
Buffett ignores forecasts, experts, and predictions.
He studies the business, not opinions.
You don’t need to predict the market, you need to understand what you own.
8. Build an “Inner Scorecard”
Your decisions should follow your own principles, not public opinion.
Integrity and independence are at the core of Buffett’s philosophy.
Winning long-term requires your own standards.
9. Keep Emotions Out of Money Decisions
Emotional investing leads to guaranteed mistakes.
Patience, discipline, and consistency create long-term winners.
A calm mind makes better decisions.
10. Your Best Investment Is in Yourself
The strongest returns come from your skills, knowledge, and mindset.
Books, learning, and personal development give lifelong compounding.
A smarter you creates better financial choices.
Rahul’s Tip:
Wealth-building is not complicated, staying disciplined is.
Once you start thinking long-term, the market automatically starts rewarding you.
Conclusion:
Buffett’s rules are not just investing rules, they are life rules.
Protect your capital, stay patient, stay disciplined, and invest in becoming better every day.
Wealth grows slowly… until the day it grows suddenly.
If this post helped you understand Buffett’s principles better, like it, share your thoughts in comments, and follow for more timeless wisdom!
Rahulpal
IPO Mania – The Emotional Trap That Costs Crores!Hello Traders!
Whenever a big IPO hits the market, excitement spreads across India like wildfire.
You’ll hear people in offices, metros, and even chai stalls saying:
“Bhai, isme allotment mil gaya toh life ban jayegi!”
But behind the hype, most people forget one simple truth, IPOs are more psychological than financial.
This is why IPO mania traps thousands of investors every year.
1. The Illusion of Guaranteed Profit
Most new investors believe every IPO will list at a premium.
They confuse “subscription numbers” with “profit certainty.”
In reality, even heavily subscribed IPOs can list at a loss.
Hype does not equal returns.
But emotions make it feel like a sure-shot win.
2. Fear of Missing Out, India’s Biggest IPO Problem
When a big brand launches an IPO, everyone wants a piece of it.
People don’t analyse profits, cash flow, or debt, they buy because the crowd is buying.
This FOMO is what leads to overpriced valuations and poor listing performance.
If you enter because “everyone else is excited,” you’re already late.
3. The Oversubscription Trap
Retail sees 20x–50x subscription and thinks it guarantees listing gains.
But heavy oversubscription means demand is emotional, not rational.
Often, the listing day profit goes to institutional players, while retail gets stuck in pullbacks.
Oversubscription tells you one thing: the crowd is emotional, not smart.
4. When You Pay for the Brand, Not the Business
IPOs of famous companies attract blind buyers who trust the “brand name” more than the balance sheet.
But the price you pay on IPO day is usually the highest price the company has ever been valued at.
You’re paying for the story, not the actual numbers.
Brand popularity doesn't guarantee long-term returns.
5. How IPO Mania Costs Crores Every Year
Retail traders enter at peak excitement and exit at peak fear.
Most IPO investors sell at the first sight of red, turning temporary corrections into permanent losses.
Millions of rupees vanish each year because people trade IPOs emotionally, not strategically
The market punishes emotional decisions, especially in IPO season.
Rahul’s Tip:
Treat IPOs like any other investment, check fundamentals, valuation, debt, promoter quality, and long-term stability.
If you buy just because it’s “new,” you’re not investing, you’re gambling.
Conclusion:
IPOs are not guaranteed money machines.
They’re emotional traps disguised as opportunities.
If you learn to stay calm when the crowd gets excited, you’ll avoid the biggest IPO mistakes and protect your capital.
If this post opened your eyes to the reality behind IPO hype, like it, comment your thoughts, and follow for more honest trading psychology insights!

Psychology of Indian Traders – Short Real-Life Cases!Hello Traders!
India has one of the fastest-growing trading communities in the world.
But despite access to charts, tools, YouTube, and education, most retail traders still repeat the same emotional mistakes.
Here are a few short real-life cases that show how psychology shapes the journey of Indian traders more than any strategy or indicator.
1. The Salary Trader, “I Just Want to Recover My Losses”
A 28-year-old IT employee from Bengaluru started trading BankNifty options after watching influencers brag about profits.
He made ₹6,000 on his first day, and believed trading was easy income.
Then he lost ₹45,000 in two weeks. Instead of stopping, he kept trading bigger lots to recover.
Within 3 months, he wiped out his entire savings.
His mistake wasn’t strategy.
It was thinking recovery is more important than discipline.
2. The Overconfident Trader, “Market Mere Hisab Se Chalega”
A 33-year-old trader from Gujarat had one big lucky win in 2021 during the bull market.
He made ₹3.5 lakh in one week and believed he was naturally talented.
He increased his position size, stopped using stop loss, and ignored risk.
The next correction wiped out not just his profit, but his entire capital.
His mistake was thinking “luck = skill.”
3. The FOMO Trader, “Sab Log Le Rahe Hain, Main Kyun Chhodo?”
A young trader from Mumbai bought every trending coin, SHIB, PEPE, FLOKI, without checking charts or fundamentals.
He only entered after seeing pumps on Twitter.
He never bought dips, only tops.
Today, he holds a portfolio down 70%, waiting for “next bull run” to save him.
FOMO always makes you late.
4. The Quiet Winner, “Main Kam Karta Hun, Par Sahi Karta Hun”
A disciplined trader from Pune took only 2–3 trades a week.
He risked just 1% per trade, journaled every entry, and treated trading as a skill.
In 18 months, he grew his account slowly but consistently, without blowing up once.
He is not rich yet, but he is stable, confident, and improving every month.
Consistency beats speed, every time.
Rahul’s Tip:
Most Indian traders don’t need more indicators, they need more patience, more control, and more clarity.
Before learning complex setups, learn yourself.
Your psychology decides your wealth more than your strategy ever will.
Conclusion:
These real-life cases show one truth, the Indian market doesn’t destroy traders.
Their habits do.
If you want to be different, think differently.
Trade slow, trade smart, and build discipline before expecting profits.
If this post felt relatable, like it, share your story in comments, and follow for more real-world trading psychology lessons!

Stop Trying to Recover Losses. Start Trying to Build ConsistencyHello Traders!
Every trader goes through losses. But what separates a struggling trader from a successful one is not the size of their wins, it’s what they focus on after a loss.
Most traders waste months trying to “get back” the money they lost.
But the truth is simple: the more you chase recovery, the more you lose.
Your real job is not to recover losses, it’s to build consistency.
1. Loss Recovery Creates Emotional Pressure
When you trade just to recover what you lost, you stop thinking logically.
You increase lot size, enter without confirmation, and ignore your plan.
This emotional pressure makes you take trades you would never take in a calm state.
Recovery trading doesn’t fix losses, it multiplies them.
2. Consistency Has No Ego
Consistency doesn’t care about your last loss or last win.
It’s about following the same rules every day, no matter what happened yesterday.
Small, controlled wins compound over time, and slowly replace every old loss.
Consistency creates stability. Stability creates clarity. Clarity creates profits.
3. When You Stop Chasing, You Start Thinking
You no longer rush entries, you wait for your setup.
You risk only what fits your plan, not what your emotions whisper.
You accept that losses are part of your business, not threats to your ego.
A calm mind sees opportunities a stressed mind can’t.
4. The Real Recovery Happens Naturally
When your focus shifts from recovering to improving, your trades automatically become better.
Consistency makes your equity curve smoother.
Slow, steady growth quietly replaces big losses without you forcing anything.
Professional traders don’t “recover”, they simply continue.
Rahul’s Tip:
Your next breakthrough won’t come from a big winning trade, it will come from a week where you followed your plan perfectly, even if the profits were small.
Consistency is your strongest weapon in trading. Use it.
Conclusion:
Stop fighting your past losses, they’re already gone.
Focus on building the habits that ensure you never repeat them again.
Recovery is temporary. Consistency is permanent.
If this post shifted your mindset, like it, share your thoughts in comments, and follow for more honest trading psychology lessons!
The 1% Rule – How to Survive Long-Term in Crypto TradingHello Traders!
Most traders think the secret to success in crypto is catching the next 10x coin.
But real wealth in trading doesn’t come from big wins, it comes from not blowing up your account.
The difference between a professional and a gambler is simple: risk per trade.
That’s where the legendary 1% Rule comes in, the rule that separates survivors from those who disappear after every market crash.
1. What Is the 1% Rule?
The 1% Rule means you never risk more than 1% of your total capital on a single trade.
If your trading account is $10,000, your maximum loss per trade should not exceed $100.
This rule doesn’t limit your profit, it protects your ability to keep playing the game.
In crypto, where volatility is extreme, following this one principle can literally decide whether you last one month or one decade.
2. Why It Works in Every Market
It removes emotional pressure, because you know even a losing trade won’t destroy your account.
It keeps you focused on process, not outcome.
It builds discipline automatically, you start thinking in probabilities, not predictions.
Most traders fail because they risk 10–20% per trade hoping to get rich fast.
They might win a few time, but it only takes one bad trade to lose everything.
3. How to Apply It Practically
First, calculate your total trading capital (only what you can afford to lose).
Multiply it by 0.01, that’s your maximum loss per trade.
Now adjust your position size so that your stop loss equals that 1%.
For example: if your stop loss is 5%, your position size should be 20% of your total capital.
This method works whether you’re trading Bitcoin, Ethereum, or even meme coins.
4. The Psychological Edge It Gives You
When you know your loss is small, you stop fearing the market.
You think more clearly, follow rules better, and avoid revenge trades.
Over time, this creates emotional stability, the most powerful trading skill of all.
The 1% Rule is not just about numbers, it’s about peace of mind.
Rahul’s Tip:
Every professional trader survives on one rule: Protect capital first, profit second.
If you lose 50% of your account, you need 100% gain just to recover.
But if you risk only 1% per trade, you can lose 10 trades in a row and still live to trade again.
Conclusion:
The 1% Rule may sound boring, but it’s the foundation of every consistent trader’s journey.
It teaches patience, discipline, and emotional control, the real “alpha” in trading.
Follow it long enough, and you’ll realize success in crypto isn’t about being lucky, it’s about being alive in the market long enough to win.
If this post helped you see risk in a new way, like it, share your thoughts in comments, and follow for more practical trading psychology insights!

Crypto Trading Feels Like a Game – But It’s a Psychological War!Hello Traders!
Let’s be honest, trading crypto feels thrilling. Charts move fast, screens flash green and red, and every click feels like a win or loss in a video game.
But the truth is, this isn’t a game. It’s a psychological war , against greed, fear, and your own impulses.
Only those who master their minds survive long enough to win the real rewards.
1. The Illusion of Control
In games, you control the outcome, skill equals victory.
In trading, you control only your actions not the result.
Many traders lose because they think they can “beat” the market like a boss level.
You can’t control outcomes, but you can control decisions. That’s where real skill begins.
2. Emotional Triggers Are the Real Opponents
Greed makes you overtrade.
Fear makes you exit early.
Ego makes you hold losses longer than you should.
Every emotional decision takes you one step further from rational trading. The market punishes impatience, not intelligence.
3. The Endless Loop of Dopamine
Winning a trade releases dopamine, the same chemical that games and gambling use to keep you hooked.
This is why traders often feel “addicted” even when losing.
The key is not avoiding dopamine, but managing it through discipline and routine.
4. How to Turn the Game Into a Profession
Set clear rules and stick to them like a professional athlete follows training.
Don’t chase trades, wait for setups that fit your plan.
Detach emotions from results. Treat losses as tuition fees, not failures.
When you start thinking like a risk manager instead of a gamer, everything changes.
Rahul’s Tip:
The market doesn’t reward excitement, it rewards patience and control.
Every trader is fighting the same battle, but only those who master psychology turn chaos into consistency.
Conclusion:
Crypto trading might look like a game with flashing charts and instant rewards, but in reality, it’s a war within yourself.
Winning here isn’t about beating others, it’s about mastering your reactions when emotions take over.
If this post gave you a reality check, like it, share your thoughts in comments, and follow for more deep trading psychology lessons!
FOMO Trading – The #1 Killer in Crypto Market!Hello Traders!
Every bull run, the same story repeats, people buy when prices are high, panic when they drop, and wonder why they always lose.
It’s not the strategy or the market that fails, it’s FOMO (Fear of Missing Out) .
FOMO is the most powerful psychological trap in the crypto world, and it silently destroys more accounts than any other mistake. Let’s break it down.
1. What is FOMO in Trading?
FOMO happens when you see others making profits, and you jump in late out of fear of missing out.
You don’t analyze, you react emotionally.
By the time you buy, smart money is usually exiting, leaving you to hold the bag.
2. How FOMO Starts
Social media hype, influencer tweets, or fast-moving green candles create excitement.
Your brain says, “I’m missing this move, I need to enter now.”
That emotion makes you forget your plan, position sizing, and stop loss.
This is exactly when professionals take advantage, because they know retail is chasing.
3. The FOMO Cycle
You see price pumping → You buy high.
Price drops → You panic and sell low.
Price recovers → You feel regret and chase again.
Repeat, until your capital is gone.
4. How to Break the FOMO Habit
Remind yourself: the market will always give another opportunity.
Set rules, if a trade has already moved 5–10% without you, skip it.
Focus on setup quality, not speed.
Plan your trades when the market is calm, not when your heart is racing.
Rahul’s Tip:
The best traders are not the fastest, they’re the most patient.
Every missed trade teaches discipline; every forced trade teaches pain. Choose your lesson wisely.
Conclusion:
FOMO is not just a bad habit, it’s emotional trading disguised as “opportunity.”
The moment you stop chasing, your trading transforms from desperate to disciplined.
In crypto, the patient trader always outlasts the impulsive one.
If this post helped you see how FOMO affects your trading, like it, share your thoughts in comments, and follow for more real-world trading psychology insights!

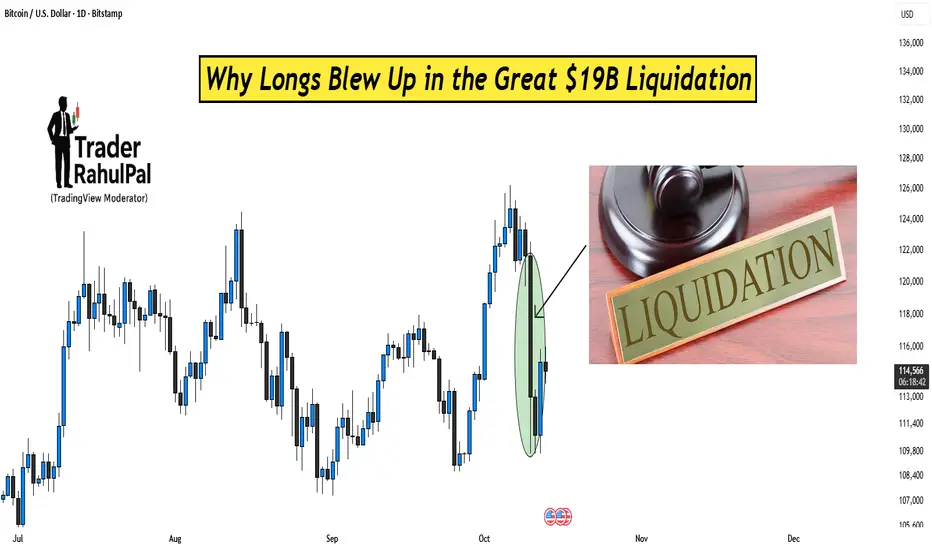
Why Longs Blew Up in the Great $19B Liquidation?Hello Traders!
Recently, crypto markets witnessed one of the biggest shakeouts in history, a $19 billion liquidation that wiped out long traders across Bitcoin, Ethereum, and altcoins in just a few hours.
Everyone called it a “crash,” but what really happened was a classic case of leverage, greed, and poor risk management colliding. Let’s break down the truth behind it.
1. Excessive Leverage Builds the Trap
During bullish phases, traders pile into long positions with 25x, 50x, or even 100x leverage.
The higher the leverage, the smaller the move needed to wipe you out.
Even a 1–2% drop in price can liquidate millions worth of positions instantly.
When too many traders are leveraged in the same direction, the market becomes top-heavy and unstable.
2. Liquidity Hunt – The Smart Money Move
Big players know where the retail stop losses and liquidation points sit, usually below obvious support levels.
They push price just far enough to trigger those liquidations.
Once the forced selling begins, it cascades, creating a chain reaction that accelerates the fall.
It’s not manipulation; it’s how liquidity flows work in leveraged markets.
3. The Domino Effect of Liquidations
When one big position gets liquidated, it triggers auto-sell orders.
Those sells push prices lower, causing more positions to get liquidated.
In minutes, you see billions vanish as exchanges auto-close overleveraged longs.
That’s exactly what created the $19B wipeout, a domino collapse fueled by forced exits.
4. How to Avoid Becoming the Next Victim
Use leverage only if you can handle losing that position completely.
Keep your stop loss and margin buffer wide enough to survive small swings.
Never risk more than 1–2% of your account on a single trade.
And most importantly, don’t chase FOMO entries near resistance levels.
Rahul’s Tip:
Leverage isn’t evil, greed is .
The same tool that builds accounts can destroy them if used recklessly.
In crypto, survival is the real skill, because only survivors get the next bull run.
Conclusion:
The Great $19B liquidation was not random, it was the market teaching a painful lesson about leverage and discipline.
If you want to last long in this game, learn to respect risk before chasing reward.
If this post helped you understand what really happened, like it, share your view in comments, and follow for more realistic market breakdowns!
How to Build a Crypto Portfolio for Long-Term Wealth?Hello Traders!
The crypto market can look exciting, fast profits, new coins every week, and hype everywhere.
But those who build long-term wealth in crypto don’t chase trends; they build structured portfolios with strategy.
Let’s understand how to create a crypto portfolio that can grow steadily over time, not just in bull runs.
1. Decide Your Investment Horizon
Before buying anything, decide your goal, 3 years, 5 years, or 10 years.
Longer horizons allow you to ride out volatility and benefit from compounding.
If you’re thinking short term, you’re speculating, not investing.
2. Allocate Wisely – The 60/30/10 Rule
60%: Blue-chip cryptos like Bitcoin (BTC) and Ethereum (ETH) , the foundation of your portfolio.
30%: Promising large/mid-cap projects (Layer-1s, AI, DeFi leaders).
10%: High-risk, high-reward small-cap or emerging tokens.
This keeps your portfolio stable while still giving growth exposure.
3. Diversify Across Categories
Don’t just hold coins, diversify across crypto sectors:
~Layer-1 platforms (ETH, SOL, AVAX)
~DeFi (AAVE, UNI)
~Infrastructure (LINK, ARB)
~AI/Metaverse (INJ, RNDR, MATIC)
This ensures that if one sector underperforms, others balance your returns.
4. Use SIP or DCA Method
Instead of buying everything at once, invest gradually through Systematic Investment Plans (SIP) or Dollar Cost Averaging (DCA) .
This helps you accumulate more during dips and reduces emotional stress during corrections.
5. Secure and Rebalance Regularly
Use hardware wallets for long-term storage. Don’t keep large amounts on exchanges.
Review your portfolio every 3–6 months and rebalance to maintain original allocation.
Trim profits from overperforming assets and add to undervalued ones.
Rahul’s Tip:
Crypto investing is not about catching every rally, it’s about staying long enough to see technology grow and adoption rise. Patience is your biggest alpha.
Conclusion:
A strong crypto portfolio is like a business, diversified, secure, and managed with discipline.
If you build it smartly, it can become a powerful wealth creator over time.
If this post helped you plan your crypto journey, like it, drop your thoughts in comments, and follow for more practical investment insights!
How Liquidity Zones in Forex Mirror in Bitcoin Markets?Hello Traders!
If you’ve studied liquidity concepts in Forex trading , you might’ve noticed how similar they behave in the crypto market , especially in Bitcoin.
Both markets are driven by liquidity and order flow, not random price movements.
Let’s understand how these two worlds mirror each other and how you can use that knowledge to trade smarter.
1. What Are Liquidity Zones?
Liquidity zones are price areas where a large number of orders are placed, stop losses, buy/sell limits, or pending entries.
Institutions and big players target these zones to execute their large positions with minimal slippage.
That’s why price often “hunts” highs or lows before the real move starts.
2. Liquidity Behavior in Forex
In pairs like EUR/USD or GBP/USD, liquidity often builds near session highs and lows.
Smart money pushes price to these zones to trigger retail stops and grab liquidity.
Once liquidity is collected, the market usually reverses in the opposite direction.
3. The Same Psychology in Bitcoin
Bitcoin may not be a currency pair, but it runs on the same emotional patterns, fear, greed, and impatience.
Liquidity clusters near obvious highs/lows, round numbers (like $60,000 or $50,000), and breakout points.
Big players hunt these zones in the same way as in Forex, because crypto markets are even more sentiment-driven.
4. How to Identify These Zones on BTC Charts
Mark previous day’s highs and lows, these are classic liquidity targets.
Check where price made impulsive moves in the past; those areas often have resting orders.
Look for quick “fakeouts” beyond these levels followed by strong rejection, a sign liquidity was grabbed.
5. How to Trade the Mirroring Pattern
Wait for liquidity grab candles (spikes above/below key levels).
Enter on confirmation of reversal (engulfing or pin bar).
Place stops beyond the liquidity wick and target the next range midpoint.
Rahul’s Tip:
Whether it’s Forex or Bitcoin, the chart structure changes, but human behavior doesn’t .
If you understand how liquidity works in one market, you can easily read the traps in another.
Conclusion:
Liquidity is the universal language of smart money.
The same tricks used in Forex, fakeouts, stop hunts, and reversals, repeat daily in Bitcoin charts.
Once you learn to spot them, you’ll see that both markets are mirrors of each other in how they trap and move traders.
If this post helped you see the connection between Forex and Bitcoin, like it, drop your view in comments, and follow for more deep market insights!
The Truth About Overnight Riches What Influencers Won’t Tell YouHello Traders!
You’ve seen it everywhere, screenshots of massive profits, luxury cars, and captions like “I made this in one trade.”
The illusion of overnight riches sells fast, but what you don’t see is the reality behind it.
Let’s uncover what most influencers never talk about, the truth behind quick money in trading.
1. The Reality Behind the Screenshot
That big profit post doesn’t show how many losses came before it.
Many traders show one winning trade out of dozens of failed ones.
You never see the emotional stress, sleepless nights, and blown accounts behind that single success.
2. Overnight Riches Come with Overnight Risk
The faster you try to make money, the faster you can lose it.
Trading with oversized lots or without stop losses may look exciting, until one bad move wipes you out.
Wealth that lasts is built on consistency, not chaos.
3. The Boring Stuff Makes You Rich
Proper risk management, discipline, and patience are not flashy, but they’re what actually make traders successful.
While others chase quick money, real traders master control over emotions and capital.
Slow growth feels boring, but it’s the only path that’s sustainable.
4. The Hidden Cost of “Fast” Success
Chasing overnight profits creates mental pressure and greed.
Even if you win once, you’ll keep gambling to repeat it, until luck runs out.
True freedom in trading comes when you stop forcing success and start following process
Rahul’s Tip:
Don’t compare your beginning to someone else’s highlight reel. The real traders you admire have spent years learning, failing, and improving before they started winning.
Conclusion:
The idea of overnight riches is a dream sold to those who don’t know better.
But once you understand trading is a skill, not a lottery, you’ll stop rushing and start growing steadily.
The best traders don’t chase money; they chase mastery, and money follows naturally.
If this post gave you clarity about the real journey of trading, like it, share your thoughts in comments, and follow for more honest trading insights!

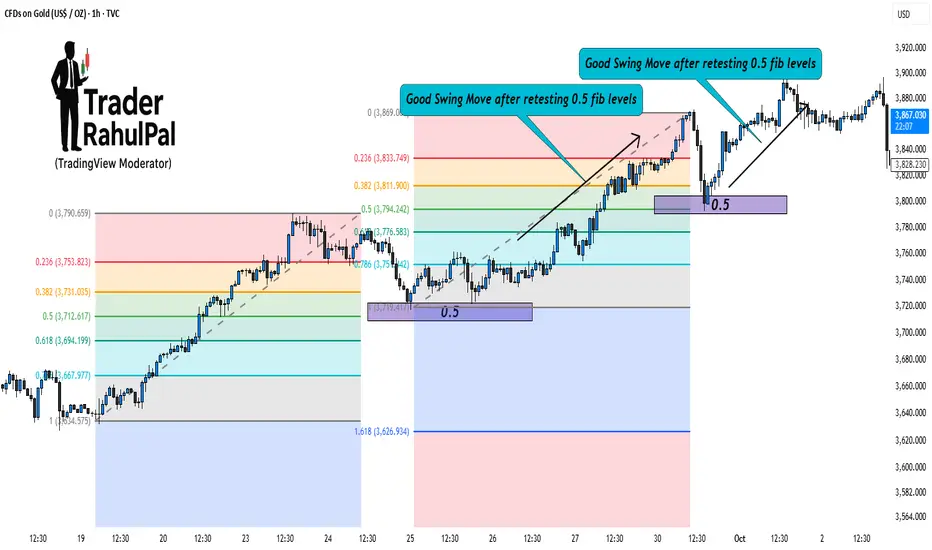
1 of the best Gold Swing Trading Strategy with Fibonacci Levels!Hello Traders!
Gold (XAU/USD) is a perfect instrument for swing trading because of its clean technical reactions.
One of the most reliable tools to trade gold swings is the Fibonacci retracement .
When used correctly, it helps you catch pullbacks and ride the next wave in the trend. Let’s break it down step by step.
1. Identify the Swing Move
First, find a strong impulse move on gold, either bullish or bearish.
This becomes your “anchor move” for drawing Fibonacci levels.
The idea is to wait for price to retrace part of this move before continuing in the main direction.
2. Draw Fibonacci Levels
Take the swing low to swing high (for bullish) or swing high to swing low (for bearish).
Mark key retracement levels: 38.2%, 50%, and 61.8% .
These levels often act as strong support or resistance zones for gold.
3. Look for Confirmation
Don’t trade blindly at a Fib level. Wait for confirmation like reversal candlesticks (pin bars, engulfing) or RSI divergence.
Volume spikes near Fibonacci zones also confirm institutional buying/selling.
4. Entry & Risk Management
Enter trades near 38.2%, 50%, or 61.8% retracements when confirmation appears.
Place stop loss just beyond the next Fibonacci level.
Set targets at previous swing highs/lows or Fibonacci extension levels like 127% and 161.8%.
5. Why It Works Well on Gold
Gold respects technical levels strongly due to high liquidity.
Institutions also use Fibonacci retracements to scale in and out of positions.
This makes Fibonacci one of the most effective tools for swing traders in gold.
Rahul’s Tip:
Always combine Fibonacci with structure. If a Fib level aligns with a key support/resistance, that zone becomes even stronger.
Conclusion:
Swing trading gold with Fibonacci retracements is simple yet powerful.
By focusing on impulse moves, waiting for retracements, and confirming with price action, you can trade gold with more confidence and less guesswork.
If this post gave you a clear strategy, like it, share your thoughts in comments, and follow for more practical gold trading setups!
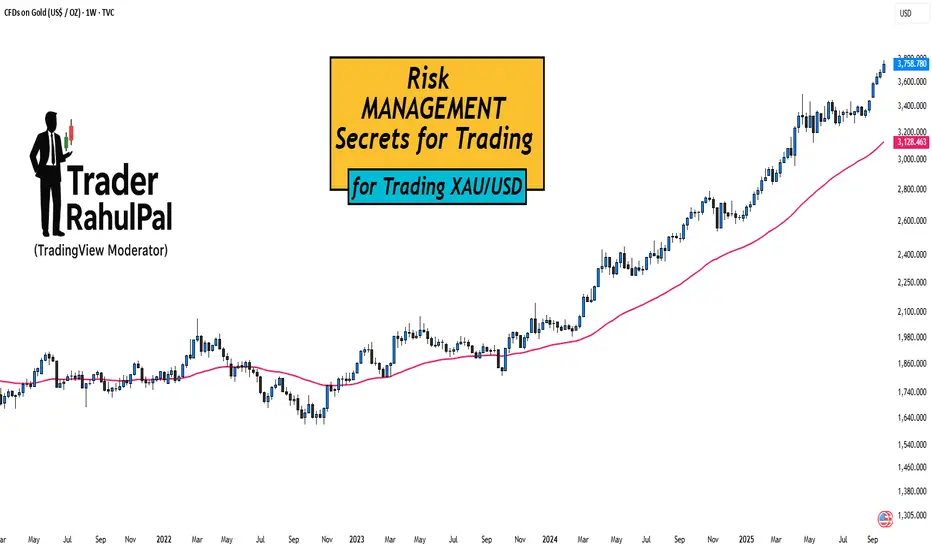
Risk Management Secrets for Trading XAU/USD!Hello Traders!
Gold (XAU/USD) is one of the most rewarding instruments, but also one of the most dangerous if you don’t manage risk properly.
Many traders lose not because their strategy is bad, but because they fail to protect their capital.
Here are some key risk management secrets every gold trader must know.
1. Position Sizing is Everything
Gold moves fast, a $5 move can wipe out accounts if the lot size is too big.
Always calculate position size based on risk per trade (ideally 1–2% of your account).
This way, even if you hit multiple stop losses, your account survives.
2. Wider Stops, Smaller Lots
Gold often spikes and hunts tight stop losses.
Use slightly wider stops, but reduce lot size to balance the risk.
This gives your trade room to breathe without increasing overall risk.
3. Never Trade News Without a Plan
During events like NFP, CPI, or Fed speeches, XAU/USD becomes extremely volatile.
If you’re not experienced, it’s better to stay out.
If you do trade, cut position size and expect slippage.
4. Daily Loss Limit
Decide in advance how much you can lose in one day (for example, 3% of account).
If that limit is hit, stop trading for the day.
This prevents emotional revenge trading, which is the biggest killer in gold trading.
5. Use Partial Profits
Gold reverses quickly, so book partial profits when the trade moves in your favor.
This locks in gains and reduces pressure.
Move stop loss to break-even once part profits are secured.
Rahul’s Tip:
Your job as a trader is not to catch every move, but to stay in the game .
Risk management may feel boring, but it’s the only reason why professional traders survive while retail traders blow up.
Conclusion:
In XAU/USD trading, strategy decides entries, but risk management decides survival.
By controlling lot size, stops, and emotions, you can make gold work for you instead of against you.
If this post helped you see risk management in a new light, like it, drop your thoughts in comments, and follow for more trading wisdom!
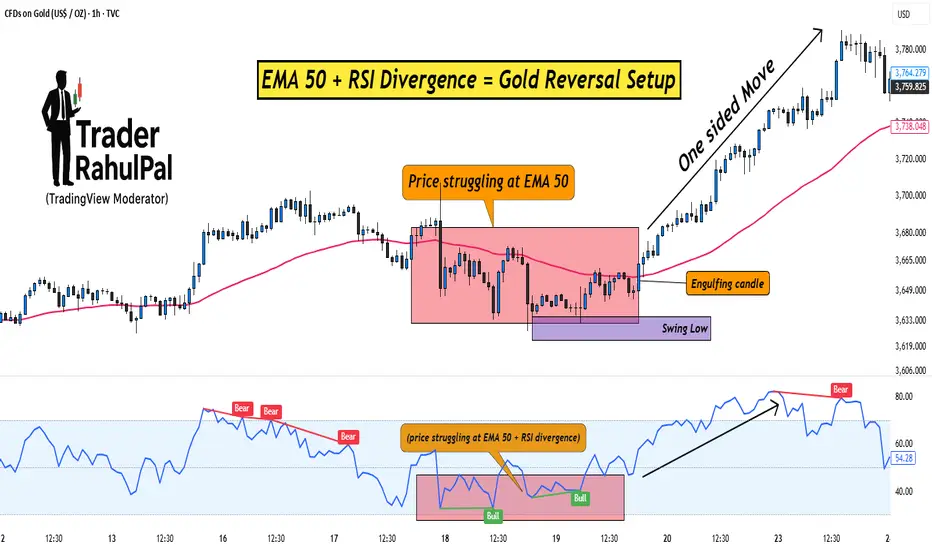
EMA 50 + RSI Divergence = Gold Reversal Setup!Hello Traders!
Gold often makes sharp one-sided moves, trapping traders who enter too late. But if you know how to combine a simple moving average with a momentum indicator, you can spot high-probability reversal setups.
One such method is using the EMA 50 together with RSI Divergence . Let’s break down how it works.
1. Why EMA 50?
The 50-period EMA acts as a dynamic trend filter.
When gold trades above it, the short-term trend is bullish; below it, bearish.
Price often retests the EMA 50 during pullbacks, making it a key level to watch for reversals.
2. What is RSI Divergence?
Divergence happens when price makes a new high/low, but RSI doesn’t confirm it.
Example: Price makes a higher high, but RSI makes a lower high → bearish divergence.
This signals that momentum is weakening, even if price is still moving strongly.
3. Combining EMA 50 with RSI Divergence
First, check where price is relative to EMA 50.
Next, look for divergence on RSI near that zone.
If both align (price struggling at EMA 50 + RSI divergence), chances of a reversal increase sharply.
4. Entry & Risk Management
Wait for a confirmation candle near EMA 50 (like engulfing or pin bar).
Place stop loss just above recent swing high/low.
Target the next support/resistance zone for exits.
Rahul’s Tip:
Don’t use divergence alone, combine it with EMA 50 for structure and you’ll filter out most false signals. This setup works best on higher timeframes like 1H or 4H for gold.
Conclusion:
EMA 50 gives you the trend filter, and RSI divergence reveals momentum weakness.
Together, they form a reliable reversal setup that helps you enter gold trades at the right time instead of chasing moves.
This Educational Idea By @TraderRahulPal (TradingView Moderator) | More analysis & educational content on my profile
If this post gave you a new setup idea, like it, share your thoughts in comments, and follow for more practical trading strategies!
Geopolitical Events and Gold Spikes – The Hidden Pattern!Hello Traders!
Every time the world faces tension, war threats, sanctions, or political instability, one asset almost always reacts first: Gold .
But instead of looking random, these spikes follow a hidden pattern that traders can use to understand market psychology. Let’s decode it.
1. Why Gold Reacts to Geopolitical Events
Gold is a global safe-haven asset. When uncertainty rises, investors park money in gold for safety.
Unlike currencies or stocks, gold isn’t tied to any government, which makes it a natural hedge against political risks.
2. The Initial Panic Spike
At the first headline of conflict or political crisis, gold prices often jump suddenly.
This is driven by panic buying, where institutions and retail both rush to hedge their portfolios.
The move is usually sharp but short-lived, as markets wait for clarity.
3. The Follow-Through or Fade
If the geopolitical issue escalates (like war or sanctions), gold continues to rise as demand for safety increases.
If tensions cool down quickly, the spike fades and gold retraces back to its earlier levels.
This second phase is where traders can judge whether the move has real strength or was just fear-driven.
4. How Traders Can Use This Pattern
Don’t chase the first panic spike, spreads are wide, and risk is high.
Wait to see if the issue escalates or calms down before deciding direction.
Combine news with technical zones, gold often spikes into resistance or support during such events.
Rahul’s Tip:
Treat geopolitical spikes as opportunities to observe how gold reacts to fear.
Over time, you’ll notice that the pattern repeats: panic spike → wait for confirmation → follow-through or fade.
Conclusion:
Gold is more than just a commodity, it’s a barometer of global fear.
By understanding how it reacts to geopolitical events, you can stop being surprised by sudden moves and start using them to your advantage.
If this post helped you spot the hidden pattern in gold spikes, like it, share your view in comments, and follow for more global market insights!
Why Gold and US Bonds Move Together!Hello Traders!
If you follow global markets, you’ll notice that Gold and US Bonds often move in the same direction.
When one rises, the other usually does too. But why does this happen? Let’s understand the link in simple words.
1. Both Are Seen as Safe Havens
In times of uncertainty, whether it’s recession fears, geopolitical tension, or market crashes, investors rush towards safety.
Gold is considered a timeless store of value.
US Bonds are backed by the US government, making them the safest fixed-income asset globally.
So, in panic situations, both attract inflows together.
2. Driven by Interest Rates & Inflation
When inflation rises or central banks cut interest rates:
Bond yields fall, but bond prices rise as investors lock in fixed returns.
At the same time, low yields make gold more attractive since the “opportunity cost” of holding it decreases.
That’s why both often rally when interest rates are falling.
3. Dollar Weakness Adds Fuel
Both gold and US bonds are influenced by the US dollar.
A weaker dollar makes gold cheaper for global buyers, pushing prices up.
Foreign investors also buy US bonds when the dollar weakens, supporting bond demand.
4. Why Traders Must Watch This Correlation
If both gold and US bonds are rising, it usually signals fear and risk-off sentiment in global markets.
If both are falling, it often reflects rising risk appetite, money moving back into equities.
This correlation can help you gauge global market mood even before equities react.
Rahul’s Tip:
Don’t just watch Nifty in isolation. Keeping an eye on gold and US bonds can give you early clues about global risk sentiment. It’s like reading the heartbeat of safe-haven flows.
Conclusion:
Gold and US bonds move together because they serve the same purpose, safety in uncertain times .
Understanding this relationship can help you read the bigger picture and prepare for market shifts more confidently.
If this post helped you connect the dots, like it, share your views in comments, and follow for more global market insights!
Index Funds vs ETFs – Which is Better for Retail Investors?Hello Traders!
When it comes to passive investing, two options always come up, Index Funds and ETFs (Exchange Traded Funds) .
Both track an index like Nifty or Sensex, but the way they work is different.
Let’s break them down so you know which one suits you better.
1. What are Index Funds?
Index funds are mutual funds that replicate a market index like Nifty 50.
You can invest directly through SIP or lump sum, just like other mutual funds.
They don’t trade on the stock exchange; instead, you buy/sell via the fund house.
NAV is calculated once a day, you get units at that day’s NAV.
2. What are ETFs?
ETFs also track an index like Nifty or BankNifty, but they trade like stocks on the exchange.
You need a demat account to buy/sell ETFs.
You can trade them intraday, just like shares.
Price changes throughout the day as they trade live in the market.
3. Key Differences You Must Know
Liquidity: ETFs depend on exchange volumes. Index funds are more stable since you transact with the AMC.
Ease of Use: Index funds are simpler for beginners (no demat needed). ETFs suit traders who want flexibility.
Costs: ETFs usually have lower expense ratios, but you pay brokerage. Index funds may have slightly higher costs but no brokerage.
Investment Style: Index funds are great for long-term SIPs. ETFs are better for those who want intraday liquidity or tactical entries.
Rahul’s Tip:
If you’re just starting and prefer SIPs without worrying about trading, go for index funds.
If you’re comfortable with demat and want real-time flexibility, ETFs give you more control.
Conclusion:
Index funds and ETFs both are powerful tools for retail investors.
The “better” choice depends on your style, simple and steady with index funds, or flexible and active with ETFs.
This educational idea By @TraderRahulPal (TradingView Moderator) | More analysis & educational content on my profile
If this post made the difference clear for you, like it, drop your choice in comments, and follow for more simple investing insights!
What is Buyback & Why Companies Do It?Hello Traders!
Every now and then, you’ll hear the news, “XYZ company announces share buyback.”
But what exactly is a buyback, and why do companies spend so much money to purchase their own shares? Let’s break it down in simple terms.
1. What is a Buyback?
A buyback (also called share repurchase) happens when a company buys its own shares from the stock market.
This reduces the number of shares available in the market, which can increase the value of the remaining shares.
2. Why Do Companies Do Buybacks?
To Increase Shareholder Value: With fewer shares in circulation, earnings per share (EPS) goes up, often supporting a higher stock price.
Utilize Excess Cash: Instead of keeping large cash reserves idle, companies return value to shareholders by buying back shares.
Signal of Confidence: A buyback is often seen as management’s confidence that the stock is undervalued.
Better Than Dividends (Sometimes): Unlike dividends, buybacks can be more tax-efficient for both the company and investors.
3. Does Buyback Always Mean Positive?
Not necessarily, Sometimes companies use buybacks to artificially boost EPS without real growth. If the business fundamentals are weak, a buyback is just a short-term push and doesn’t solve deeper issues.
Rahul’s Tip:
Don’t buy a stock just because of a buyback announcement. Always check if the company has strong fundamentals, healthy cash flows, and a genuine reason behind the buyback.
Conclusion:
A buyback is a powerful tool, but only when backed by strong business performance.
It can reward long-term shareholders and show management’s faith in the company.
But as smart investors, we should look beyond the headline and judge the real financial health.
By @TraderRahulPal (TradingView Moderator) | More analysis & educational content on my profile!
If this post made buybacks clear for you, like it, share your view in comments, and follow for more simple investing insights!
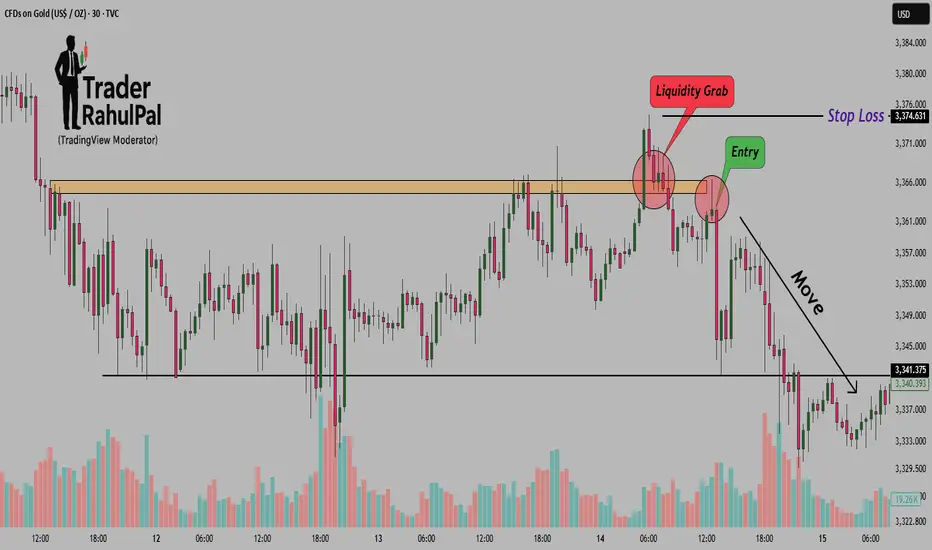
The Secret of Liquidity Grab – Why Price Hunts Highs Before FallHello Traders!
Have you ever noticed how the market first breaks a recent high, traps breakout traders, and then suddenly reverses? This is not random, it’s called a liquidity grab .
Understanding this concept can completely change how you see price action.
1. What is a Liquidity Grab?
Liquidity means orders in the market, stop losses, buy orders, sell orders.
When price hunts a previous high or low, it triggers stop losses and pending orders. This creates a sudden burst of liquidity.
Institutions use this liquidity to enter or exit large positions without causing slippage.
2. Why Price Hunts Highs Before Falling
At previous swing highs, many breakout traders place buy orders and short sellers place stop losses.
When the price spikes above that level:
Breakout traders enter long positions.
Short sellers’ stop losses get triggered (buy orders).
This creates a pool of buying liquidity. Once institutions have sold into this buying pressure, price often reverses sharply.
3. Why This Matters for Retail Traders
Most retail traders get trapped during these liquidity grabs.
They either chase breakouts too late or panic exit at the wrong time.
By recognizing this pattern, you can avoid being the liquidity and instead trade with the smart money.
4. How to Use This in Trading
Wait for the Grab: Don’t rush into a breakout. Wait to see if price quickly reverses after taking out a high/low.
Confirm With Volume: A liquidity grab often shows a sudden spike in volume followed by an opposite move.
Look for Rejection Candles: Pin bars, engulfing candles, or sharp wicks at highs/lows confirm the trap.
Rahul’s Tip:
Next time you see price breaking a high, don’t get excited. Ask yourself, is this a real breakout or just a liquidity grab? Waiting a little longer often saves you from being trapped.
Conclusion:
Liquidity grabs are the hidden traps of the market. Price doesn’t move randomly, it seeks liquidity first.
By understanding this, you can avoid becoming the victim and instead align yourself with the institutions.
If this post gave you clarity on liquidity grabs, like it, share your thoughts in the comments, and follow for more smart price action insights!
How FII & DII Flows Impact Nifty & BankNifty Daily Moves!Hello Traders!
Every evening, traders check the data: FII (Foreign Institutional Investors) bought or sold ₹X crores, DII (Domestic Institutional Investors) did the opposite.
But how do these flows actually affect the daily moves of Nifty and BankNifty? Let’s break it down.
1. FII Flows Drive Short-Term Sentiment
FIIs have massive capital, and their buying or selling often leads to sharp moves.
When FIIs are heavy buyers, indices like Nifty and BankNifty usually see strong rallies because of large inflows.
When they sell aggressively, the market often corrects, especially in large-cap stocks where they hold big stakes.
2. DII Flows Provide Stability
DIIs include mutual funds, insurance companies, and pension funds.
They act as a counterbalance to FIIs.
When FIIs sell in panic, DIIs often buy the dip, providing support to the market.
This is why sometimes, even with heavy FII selling, Nifty doesn’t crash as much as expected, DIIs are absorbing the supply.
3. Sector Impact – Why BankNifty Moves More
FIIs and DIIs both invest heavily in banking and financial stocks.
That’s why BankNifty often reacts more sharply to their flows compared to other sectors.
FII buying in banks = sharp rallies.
FII selling in banks = bigger drag on BankNifty.
4. Daily Data vs Long-Term Trend
Daily FII/DII numbers show short-term sentiment but don’t decide long-term trends alone.
Sometimes FIIs sell for weeks due to global issues, but strong domestic growth attracts them back eventually.
It’s important to watch whether the flows are consistent in one direction or just short-term adjustments.
Rahul’s Tip:
Don’t overreact to just one day’s FII/DII numbers. Look at the trend over several sessions.
Combine this data with charts of Nifty and BankNifty for a clearer picture.
Smart traders use flows as confirmation, not as the only reason to take trades.
Conclusion:
FII and DII flows are like the push and pull forces in the market.
FIIs bring speed and sharp moves, while DIIs bring balance and stability.
By tracking both, you can understand why Nifty and BankNifty move the way they do, and plan your trades with more confidence.
If this post made FII/DII flows clearer for you, like it, share your views in the comments, and follow for more real-world trading education!