Difference btw Beginner, Pro and Full time Traders ( Mtfa view )In this Big 20 minutes video, I will try to explain the most beautfull conept of Multi time frame analysis from the perspective of 4 different types of trader .
Charts used are older than 3 months
Rainindustries

RAIN: Turnaround Fundamental Play,Trendline BO,Chart of the WeekNSE:RAIN When Carbon Giants Face the Perfect Storm of Bearish Signals and Sectoral Headwinds NSE:RAIN showing signs of Fundamental Turnaround. Let's understand this week's "chart of the week"
As per the Latest SEBI Mandate, this isn't a Trading/Investment RECOMMENDATION nor for Educational Purposes; it is just for Informational purposes only. The chart data used is 3 Months old, as Showing Live Chart Data is not allowed according to the New SEBI Mandate.
Disclaimer: "I am not a SEBI REGISTERED RESEARCH ANALYST AND INVESTMENT ADVISER."
This analysis is intended solely for informational purposes and should not be interpreted as financial advice. It is advisable to consult a qualified financial advisor or conduct thorough research before making investment decisions.
Price Action Analysis:
Long-Term Trend Structure:
- The stock demonstrated a spectacular bull run from 2021 lows around ₹75-80 levels to highs of ₹272.75 achieved in mid-2021
- Post the euphoric rally, the stock entered a prolonged consolidation and distribution phase spanning from July 2021 to early 2024
- During 2022-2023, the stock oscillated in a broad range between ₹130 and ₹ 220, forming a rectangular consolidation pattern
- From late 2023 onwards, the stock began showing signs of weakness with lower highs formation
Current Breakdown Phase (2024-2025):
- A decisive breakdown occurred in late 2024 when the stock breached the crucial ₹140-145 support zone
- The stock has entered a steep declining phase, currently trading around ₹124.60 (as of Dec 20, 2025)
- The recent price action shows a sharp downturn with the stock making new 52-week lows at ₹99.90
Volume Spread Analysis:
Volume Trends:
- A massive volume spike is visible in the most recent sessions, reaching approximately 36.64 million shares
- This represents nearly 4x the average weekly volume of around 9.36 million shares
- Historical volume analysis shows earlier spikes during the 2021 peak (around 80 million) and the 2024 rally attempts
Key Technical Levels:
Support Zones:
- Major Support: ₹99.90 - The recent 52-week low and next critical support level
- Psychological Support: ₹100 - Round number support with psychological significance
- Ultimate Support: ₹80-85 zone - Corresponds to early 2023 lows
Resistance Zones:
- Immediate Resistance: ₹135-140 - Previous support turned resistance
- Minor Resistance: ₹150-155
- Major Resistance: ₹165-170
- Strong Resistance: ₹180-185 - Breakdown point of the larger distribution pattern
- Formidable Resistance: ₹200-210 - Multiple failed rally attempts from this zone
Base Formation Analysis:
- No clear base formation is visible in the current structure
- The stock is in an active downtrend without any consolidation base
- The previous base was formed between ₹140-180 during 2023-2024, which has now failed
- A new base formation would require at least 2-3 months of sideways consolidation
- An ideal base would form above the ₹100 psychological level with declining volume
Sectoral Overview:
Industry Classification:
- Rain Industries operates in the Chemicals and Petrochemicals sector
- Specifically focused on Carbon Products, Advanced Materials, and Cement segments
- The company is a leading vertically integrated producer of calcined petroleum coke (CPC) and coal tar pitch (CTP)
- Products serve the aluminium, steel, graphite electrodes, and construction industries
Global Market Position:
- Rain Industries is among the world's largest producers of calcined petroleum coke
- The company is the largest coal tar distiller globally
- Operations span across 14 locations in 8 countries across three continents
- Annual production capacity: 2.4 million tons of CPC and 1.0 million tons of tar distillation
Sectoral Challenges (2024-2025):
- The aluminium industry, which accounts for approximately 42% of Rain's revenues, has faced headwinds
- Global aluminium production continues to expand to meet growing demand, with LME aluminium prices trading around $2,600 per ton
- European aluminium smelters face structural decline pressures due to high energy costs
- Raw material availability constraints have impacted production schedules
- Supply chain issues and challenges in securing raw materials could impact production and costs
Sector Outlook for 2025-2026:
- The global aluminium market is projected to reach $355 billion by 2030, expanding at a CAGR of approximately 4.8%
- Demand growth expected from the automotive industry's lightweighting trend and electric vehicle adoption
- Increasing emphasis on low-carbon aluminium and sustainability initiatives
- Aluminium's recyclability has become significant, with recycling requiring only 5% of the energy needed for primary production
- Infrastructure spending in India and globally should support aluminium and construction material demand
Fundamental Backdrop:
Recent Financial Performance:
- Q3 FY2025 revenue stood at ₹44.76 billion with adjusted EBITDA of ₹6.48 billion
- Q2 2025 showed revenue growth of 17% quarter-over-quarter, driven by higher CPC volumes and prices
- The company operates at approximately 90% capacity utilization
- For Q2 FY2026, the company posted a profit of ₹106.01 crore, reversing a ₹179.11 crore loss year-over-year
Business Segment Performance:
- Carbon Segment: Largest revenue contributor with sales volumes of 664,000 MT in Q2 FY2025
- Advanced Materials: Showed 317% EBITDA growth quarter-over-quarter due to improved seasonality
- Cement Business: Faces challenges, but outlook is improving with infrastructure spending
- Company approved ₹7.57 billion cement expansion with commercial operation date in H2 2027
Financial Health Concerns:
- The company has a low interest coverage ratio and delivered poor sales growth of 4.46% over the past five years
- Return on equity is negative at -0.31% over the last 3 years
- Market capitalization as of November 27, 2025, stood at ₹3,619.08 crore
- High net debt of $699 million could constrain financial flexibility
- PE ratio of -104.48 indicates negative earnings
Recent Developments:
- The company declared a dividend of ₹1.00 per share in June 2025, yielding 1.58%
- Safety performance improved significantly with the Total Recordable Incident Rate decreasing to 0.03 in H1 2025
- Management focusing on cost-saving measures, ESG compliance, and debt optimisation
- Company investigating application of biocarbon materials in its product portfolio
Valuation Metrics:
- 52-week high: ₹180 (touched in early 2025)
- 52-week low: ₹99.80
- Current price: ₹124.60
- Price-to-Book ratio: 0.60 (as of Dec 2025)
- Stock down approximately -27.80% year-over-year, underperforming Sensex's 9.5% gain
Risk Factors and Challenges:
Operational Risks:
- Dependence on raw material availability, particularly green petroleum coke
- Energy cost volatility, especially in European operations
- Capacity utilization challenges impacting profitability
- Competition in battery materials and advanced materials segments
- Planned maintenance activities disrupting production schedules
Market and Sectoral Risks:
- Aluminium industry demand uncertainty in the European and US markets
- Geopolitical tensions affecting global trade and supply chains
- China's production nearing regulatory ceiling could trigger market distortions
- Regulatory changes and environmental compliance costs are increasing
- Potential tariff impacts on international trade
Financial Risks:
- High debt levels constrain strategic flexibility
- Negative operating cash flow concerns
- Low profitability margins despite revenue growth
- Currency fluctuation risks due to global operations
- Interest coverage ratio remaining weak
My 2 Cents:
Fundamental vs Technical Divergence:
- While the company shows operational improvement in recent quarters, market sentiment remains negative
- The gap between fundamental progress and stock performance is widening
- High debt levels and sectoral headwinds overshadow operational gains
- Market positioning the stock as a value trap rather than a value opportunity currently
- Investor confidence needs restoration through consistent delivery and debt reduction
NSE:RAIN represents a classic case of a fundamentally improving company caught in a perfect storm of technical breakdown, sectoral headwinds, and erosion of sentiment. The chart structure has deteriorated significantly, with the stock breaking below multi-year support zones and displaying all characteristics of a sustained downtrend. While the aluminium sector outlook for 2025-2026 appears constructive and the company has shown operational improvements, the market is clearly sceptical about near-term prospects given the high debt burden and challenging market environment.
The coming months will be crucial in determining whether Rain Industries can stabilise around the psychological ₹100 mark or if further capitulation to ₹85-90 levels is in store. Only a decisive reclaim of ₹140 with volume would suggest that the worst is behind, making it a level to watch closely for any signs of trend reversal.
Full Coverage on my Newsletter this Week
Keep in the Watchlist and DOYR.
NO RECO. For Buy/Sell.
📌Thank you for exploring my idea! I hope you found it valuable.
🙏FOLLOW for more
👍BOOST if you found it useful.
✍️COMMENT below with your views.
Meanwhile, check out my other stock ideas on the right side until this trade is activated. I would love your feedback.
As per the Latest SEBI Mandate, this isn't a Trading/Investment RECOMMENDATION nor for Educational Purposes; it is just for Informational purposes only. The chart data used is 3 Months old, as Showing Live Chart Data is not allowed according to the New SEBI Mandate.
Disclaimer: "I am not a SEBI REGISTERED RESEARCH ANALYST AND INVESTMENT ADVISER."
This analysis is intended solely for informational purposes and should not be interpreted as financial advice. It is advisable to consult a qualified financial advisor or conduct thorough research before making investment decisions.

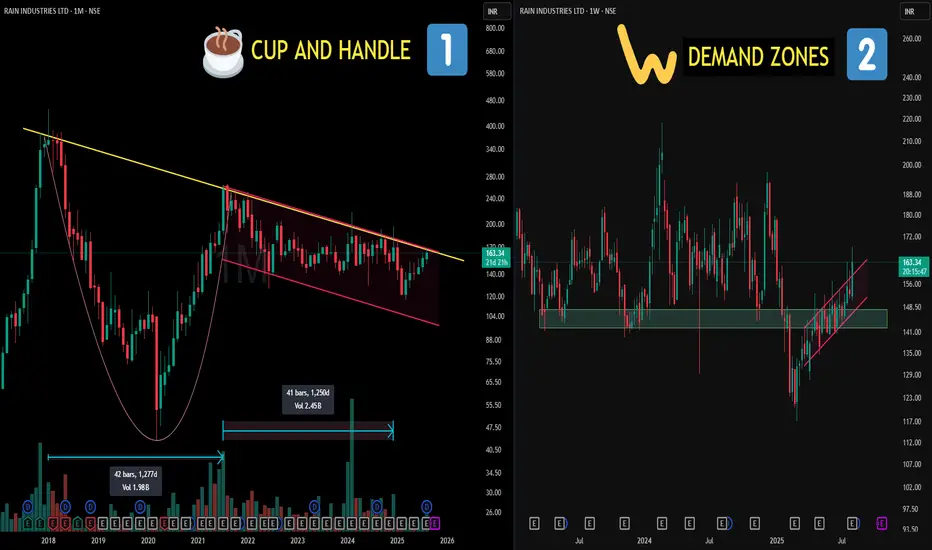
2500 Days of Structure? CUP & HANDLE Decoded!📌Left Side (Chart 1: Monthly TF)
🧠 Cup and Handle Pattern:
A bullish continuation pattern that resembles the shape of a tea cup on longer timeframes. The “cup” shows a gradual rounded bottom (accumulation phase), followed by a smaller downward or sideways "handle" (last shakeout), often before strength resumes. It reflects long-term accumulation and investor confidence.
📈 Cup Duration in this case : 1277 days (approx. 3.5 years)
🧠Parallel Channel (Handle):
A price structure where two trendlines contain price movement within a defined up or down slope. Often marks controlled consolidation or correction — neither side is dominating, until one breaks.
📈 Handle Formation in this case : 1250 days (approx. 3.4 years)
📌 Right Side (Chart 2: Weekly TF)
🧠 This is the zoom lens on the handle zone:
📍A key Demand Zone was breached temporarily… but reclaimed with conviction.
📍 Strong re-acceptance and consolidation followed, showing organized price behavior.
📍 The upper trendline of the parallel channel is where price recently pushed through — again, no forecasting — just a structural breakout from a well-defined zone.
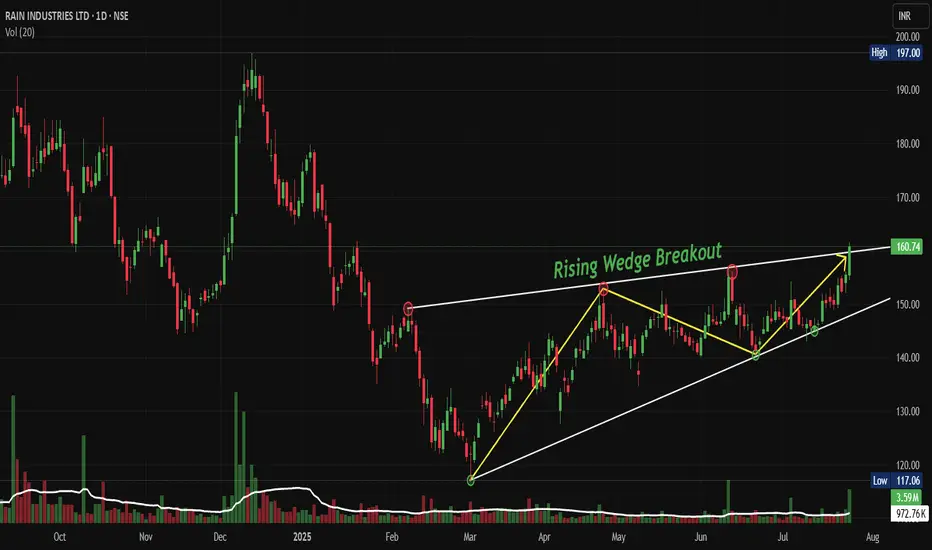
RAIN: Breaks Out of Rising Wedge Pattern Signals Fresh UptrendNSE:RAIN Breaks Out: Rising Wedge Pattern Signals Potential Bullish Run to 180+ Levels
Signals Fresh Uptrend After Months of Consolidation
Price Action:
- NSE:RAIN has been trading within a well-defined rising wedge pattern since March 2025
- The stock has recently broken out above the upper trendline of the wedge at approximately 160 levels
- Current price of 160.74 represents a significant move above the key resistance zone
- The breakout is accompanied by increased volume, suggesting genuine buying interest
Volume Spread Analysis:
• Volume breakout accompanied the wedge pattern breakout
• Higher volumes during up moves compared to down moves indicate bullish participation
• Volume spike visible during the recent breakout at 160+ levels
• Average volume of 972K around today, 3.59M shares with recent surge to higher levels
Base Formation and Accumulation Zone:
• The stock established a strong base between 117-125 levels from March to July 2025
• Multiple retests of the 117 support level showed strong buying interest
• Base formation lasted approximately 4 months, indicating thorough accumulation
• Volume during base formation remained relatively stable with occasional spikes
Key Support and Resistance Levels:
• Primary Support: 117.06 (marked as swing low and base support)
• Secondary Support: 140-145 zone (previous resistance turned support)
• Immediate Resistance: 165-170 zone (next major hurdle)
• Target Resistance: 180-185 zone (measured move target)
• 52-week High: 197.00 (ultimate resistance level)
Technical Patterns:
Rising Wedge Breakout Pattern:
• Clear rising wedge pattern formed over 4-5 months
• Lower highs and higher lows converged into a wedge formation
• Breakout occurred at 160+ levels with strong volume confirmation
• Pattern suggests continuation of the broader uptrend
Trend Analysis:
• Long-term trend: Bullish (higher highs and higher lows since March 2025)
• Medium-term trend: Bullish breakout from consolidation
• Short-term trend: Strong bullish momentum post-breakout
• Moving averages alignment suggests sustained upward momentum
Chart Patterns and Indicators:
• Cup and handle formation visible in the broader timeframe
• Multiple flag patterns during the consolidation phase
• Price above all key moving averages, indicating bullish sentiment
Trade Setup and Strategy:
Entry Levels:
• Aggressive Entry: 155-160 levels (on any minor pullback)
• Conservative Entry: 145-150 levels (on deeper retracement to support)
• Breakout Entry: Above 165 levels with volume confirmation
• averaging between 150-160 for position building
Exit Levels and Targets:
• Target 1: 180-185 levels (initial profit booking - 15-20% upside)
• Target 2: 195-200 levels (testing previous highs - 25-30% upside)
• Target 3: 220-230 levels (extended target - 40-45% upside)
• Swing high exit: Trail stops below key support levels
Stop-Loss Strategy:
• Initial Stop-Loss: Below 140 levels (10-12% risk from current levels)
• Trailing Stop-Loss: Below 150 levels once 180 is achieved
• Pattern Stop-Loss: Below the wedge support around 145 levels
• Time-based stop: Exit if no progress in 2-3 months
Position Sizing and Risk Management:
• Maximum position size: 2-3% of total portfolio
• Risk per trade: Not more than 1% of portfolio value
• Scale in approach: 50% at entry, 30% on dip, 20% on breakout confirmation
• Maintain a risk-reward ratio of a minimum of 1:3
Sectoral and Fundamental Backdrop:
Company Overview:
• NSE:RAIN is one of the world's largest producers of calcined petroleum coke, coal tar pitch and other high-quality basic and speciality chemicals
• Market Cap: 5,405 Crore with Revenue: 15,472 Cr
• Promoter Holding: 41.2% indicating stable management control
Financial Health Assessment:
• The company has a low interest coverage ratio, which poses some financial risk
• Net Profit: ₹-115.10Cr as on March 2025 (Q4 FY25) showing current losses
• The company has delivered a poor sales growth of 4.46% over the past five years
• Recent debt reduction efforts as management focuses on prepaying obligations
Business Segments Performance:
• Carbon Business: Environment-friendly and energy-efficient practices have made RAIN's carbon business highly profitable and sustainable
• The carbon business co-generates energy at six calcined petroleum coke plants with a combined power-generation capacity of approximately 135 MW
• The speciality chemicals segment is showing resilience despite market challenges
Sector Outlook and Industry Trends:
• In 2025, the industry is expected to continue its recovery, adjusting to new market drivers while balancing short- and long-term goals
• Chemical industry focusing on decarbonization and innovation initiatives
• India Ratings affirms Rain Industries' credit rating at IND A/Stable with stable outlook and improved operational outlook
Key Risk Factors:
• Cyclical nature of the chemical industry affecting margins
• High debt levels and interest coverage concerns
• Global economic slowdown has an impact on demand
• Raw material price volatility
• Environmental regulations affecting operations
Positive Catalysts
• Debt reduction strategy showing management commitment
• Stable credit rating with improved operational outlook
• Strong technical breakout indicating renewed investor interest
• Global chemical industry recovery supporting sector sentiment
• Energy co-generation capabilities providing cost advantages
Risk Assessment and Monitoring:
Key Levels to Watch:
• Break below 145: Bearish signal, consider exit
• Sustain above 165: Bullish confirmation for higher targets
• Volume patterns: Declining volume on up moves would be concerning
• Sector rotation: Monitor chemical sector performance relative to the broader market
Regular Review Parameters:
• Weekly closing above key moving averages
• Monthly volume trends and institutional participation
• Quarterly earnings performance and guidance
• Industry developments and regulatory changes
• Management commentary on debt reduction progress
Exit Triggers:
• Fundamental deterioration in business metrics
• Break of key technical support levels
• Adverse sector developments
• Better opportunities in other stocks/sectors
• Achievement of target levels with profit booking
My Take:
NSE:RAIN presents a technically attractive setup with the rising wedge breakout, but investors should be cautious about the fundamental challenges. The trade setup offers good risk-reward ratios for short to medium-term positions, while long-term investors should wait for clearer signs of fundamental improvement.
Keep in the Watchlist and DOYR.
NO RECO. For Buy/Sell.
📌Thank you for exploring my idea! I hope you found it valuable.
🙏FOLLOW for more
👍BOOST if you found it useful.
✍️COMMENT below with your views.
Meanwhile, check out my other stock ideas on the right side until this trade is activated. I would love your feedback.
Disclaimer: "I am not a SEBI REGISTERED RESEARCH ANALYST AND INVESTMENT ADVISER."
This analysis is intended solely for informational and educational purposes and should not be interpreted as financial advice. It is advisable to consult a qualified financial advisor or conduct thorough research before making investment decisions.
RAIN- Good consolidation - 40%+ potential - Strong BO possible? Price Analysis & Overview:
1. Good consolidation.
2. Exceptional volumes surges.
3. Price reacting from the higher levels but also not willing to move down at the same time showing equal buying & selling strength.
Price need to cross 187 level for buyers to get dominated.
4. RRR is favourable.
5. Must be on Radar.
Trade Plan:
Entry = Post 185 level BO
SL = 10-15%
TP = 1:2,1:3,1:4,1:5
- Stay tuned for further insights, updates and trade safely!
- If you liked the analysis, don't forget to leave a comment and boost the post. Happy trading!
Disclaimer: This is NOT a buy/sell recommendation. This post is meant for learning purposes only. Views are personal. I share whatever I do. Please, do your due diligence before investing.
Thanks & Regards,
Anubrata Ray

SWING IDEA - RAIN INDUSTRIESRain Industries has emerged as an intriguing prospect, presenting a compelling case for a potential upswing.
Reasons are listed below :
Rain Industries has established a sturdy support base at the 145 level, providing a solid foundation for potential upward movement.
The weekly timeframe reveals a bullish engulfing candle, signaling a potential shift in sentiment and setting the stage for a positive trend reversal.
A bullish marubozu candle on the daily chart further strengthens the bullish case, indicating strong buying interest and potential momentum in the short term.
The stock is bouncing back from the golden Fibonacci zone, adding a technical aspect to the trade setup and reinforcing the probability of a favorable price movement.
The uptick in trading volumes is a positive indicator, suggesting growing market interest and participation in Rain Industries.
Despite highs shifting down, the absence of new lows is a noteworthy observation, hinting at a potential reversal and the resilience of the stock in the face of downward pressure.
Target - 184 // 206 // 253
StopLoss - weekly close below 145

RAIN is ready to give 40% from these levelsRain Industries has made Broadening Triangle Pattern
Stock has made volatility pattern which is indicating 260-280 levels from the pattern
Lets see how stock goes up from hereon.
Thank You !!

Rain industries Ltd Rain industries Ltd weekly 2 years breakout first target 260 and second target is 400

RAIN INDUSTRIESclear breakout of triangle pattern , if crosses the handle . clear tgt of Rs. 500 in few months time, if it crosses 270 levels.
regards
THE STOCK THEORY

RAIN INDUSTRY MULTIYEAR TRENDLINE BREAKRAIN Industry has given Trendline Breakout couple of weeks back, It gave its range breakout of 190 odd levels last week.
Support below160 DCB as all weekly EMA has confluence at those levels.
This is tricky script has multiple instances of failed breakout in past so decide as per your risk appetite...
DISCLOSEURE:- This post is for educational purpose only,
I am not certified SEBI RA or TA,

RAIN INDUSTRIESOn the Verge of breakout of the handle.
Cup and Handle pattern .
20 and 50 EMA Cross
SL 141
TGT 1st 270
TGT Long 418

RAIN Industries not a bullish setupRain Industries is one stock where retails are more optimistic than the promoter but techinically their are 3 major red flags in price action
1 It has not crossed 61.8% retracement of fall from ATH to bottom 2020
2 The rise from lows of 2020 is not impulsive (god knows how some people are marking impulsive rise from 2020 bottom)
3 It has not crossed 61.8% retracement of fall from 2021 top to recent bottom yet
Why people try to force counts when we see every move is over lapping their are more than 5000 stocks traded on NSE still people are forcing their own views in name of technicals & a sudden price action in direction of their trend they count themselves as doing miracle my personal take is when its difficult to fit Elliott counts stay away from the Stock.

RAIN INDUSTRIES CHANNEL BREAKOUTRain Industries breaking a channel
with good volume built up
#target can be 255
EDUCATIONAL IDEA

RAIN review - giving ample opportunity to enter for 270++NSE:RAIN
cmp 178
chart posted on 5th Sept 2023 when the price was 174
spent 3 months near this price and now it looks like going up
expecting 270 as 1st target
The objective of this analysis is knowledge sharing and education. There isn't any buy or sell advise in this article. Every stock is held for a short to medium amount of time and is positional.
It is expected of each person to carry out independent research and evaluation to ascertain whether my perspective is consistent with your studies.
link of 5th Sept 2023 article posted below

Buy Rain - Before It becomes "come again"Fundamentals:
Positive:
1. Increase in revenue
2. Profit from operating activities are increasing
3. Book value per share is increasing
4. ROCE increasing
5. Debt to equity is 1.1
Negative
1. Recent Qtr performances
2. 41% promoter holding
Technical:
1. Multi-year trendline breakout
2. High momentum
3. High Volume
Therefore buy it before it feels like,
" Rain - Rain Come Again"
SL : 158
R1: 185, R2: 203, R3:258

RAIN INDUSTRIES READY TO RAIN MONEY.RAIN INDUSTRIES on weekly TF looks promising for a potential BIG breakout.
Weekly candle is very bullish, KEEP A LONG TERM VIEW.
ENTRY AT CURRENT PRICE OR IN THE RANGE OF 150-160
STOP LOSS @140
TARGETS : 190, 200, 250
TRAIL USING A COMBINATION OF 20 AND 50 EMA ON DAILY TF.

Rain Industries: entered for 200% + upmove➡️ Held by Mohnish Pabrai who didn't book it at the previous ATH even
➡️Trading below B.V.
Cons: susceptible to input costs and govt. regulations

RAIN Industries - Bottom Forming pattern - Multibagger📈 Exciting Bullish Pattern Alert! 🐂
📊 Pattern: Falling Wedge
📌 Symbol/Asset: RAIN
🔍 Description: Stock is forming falling wedge pattern around the Long Term Support.
We can clearly see bottom is in making.
There is a strong support of around 130-135 and we can see huge bounce from hereon.
Rain Industries is a Buy On Dips.
Not to Miss this opportunity.
👉 Disclosure: We are not SEBI registered analysts, this is not a buy or sell recommendation.

Rain 1W Best Buying Time / Short Term Me Darna Hai To Karo Long Term Ke Hisab Se Dekhaoge To Insaan Hoye Ya Share Market Ek Din Jaana To Upar Hi Hai ✨✌🏻

EXCITING BULLISH PATTERN📈 Exciting Bullish Pattern Alert! 🐂
📊 Pattern: Wedge
📌 Symbol/Asset: Rain
🔍 Description:
Moment Stock with Strong Support on hourly and daily chart. Trading above 200 day EMA lows.
👉 Remember: Technical patterns are just one piece of the puzzle. Consider conducting further research, consulting with a financial advisor, and managing your risks appropriately.

RAIN IND Daily looking bullishRAIN IND Daily chart has trendline breakout/inverted head and shoulder breakout with 200 ema support on daily candle.
Good to buy at 169 for targets of 190,206 with sl below 157

RAINRAIN:- The stock has given a breakout, if the stock sustains above 164.75 then we can see an upside movement
Hello traders,
As always, simple and neat charts so everyone can understand and not make it too complicated.
rest details mentioned in the chart.
will be posting more such ideas like this. Until that, like share and follow :)
check my other ideas to get to know about all the successful trades based on price action.
Thanks,
Ajay.
keep learning and keep earning.

RAIN trend change?1. Buy or Sell at your own risk
2. Don't risk more than 1%-2% of your capital as stop loss
3. Position Size formula: - Stop Loss Amount/(Buy Price - Initial Stop Loss Price)
4. Sell on initial Stop Loss hit or RSI close below 40
5. Some other ways to sell stocks can be
a. 25% or 50% up in three weeks or less
b. Weekly tailing tops with high volume
c. Exhaustion gaps
d. Heavy daily volume without further upside
e. Largest one day price drop
It looks like the downtrend in NSE:RAIN is going to change. It's a buy with stop at ₹155.
Disclaimer: I am not SEBI Registered. Do trade or invest at your own risk, I am not responsible for any losses and won't claim anything from your profits either. Take financial advice from your advisors before jumping in.
