Cement Stocks on Bulls Eye??!!!Just got an eye on cement stocks-Ambujacem,ultracem,shreecem,ramcocem,dalbharat,acc,indiacem,jkcem....looks like a bullish pressure mounting up...
Niftycommodityindex too shows Bullishness!!!
Let's wait and watch!!!
Expecting Diwali to be lightup with cement stocks!!!!!
Thank you!!!!
Just my view...not a tip nor advice!!!!
RAMCOCEM

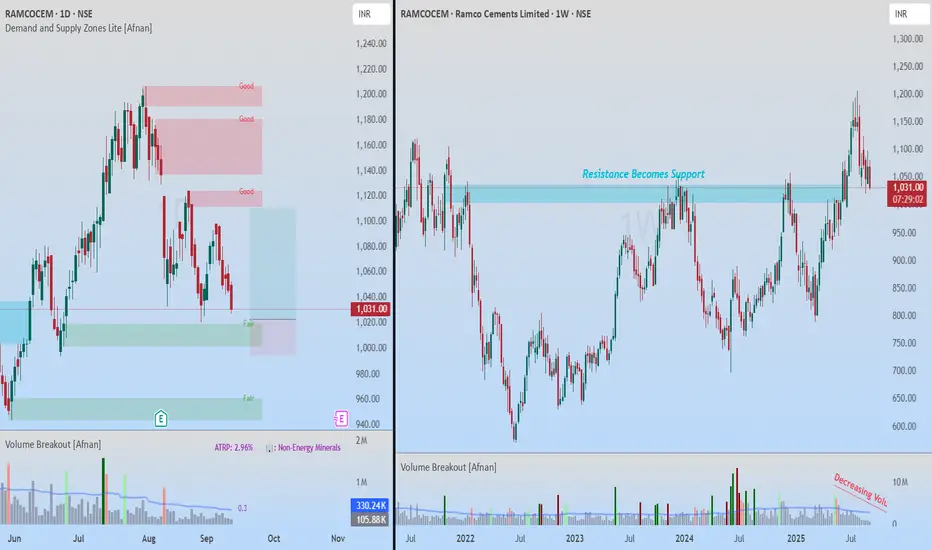
Dual Lens Analysis: Demand & Supply Meets Breakout Retest📊 Supply & Demand View 📊
Supply and demand zones are essentially institutional footprints . Large players never execute their full orders at once; instead, they build positions in chunks. This behavior leaves behind visible imbalances on the chart. Whenever price revisits these zones, strong reactions are often seen.
On the daily chart of Ramco Cements , price has reacted multiple times near a demand zone without fully testing it. Each time, we witnessed a bounce — a sign of heavy buying interest.
Now, the stock is once again approaching this zone for the third time, which statistically makes it a strong area to monitor. The weekly chart structure also shows higher highs and higher lows, signaling that the broader trend is bullish. With no immediate higher timeframe supply overhead, the setup offers a 1:3 favorable risk-to-reward scenario.
🚀 Breakout Retest View 🚀
On the weekly chart , Ramco Cements displays a textbook breakout retest. After years of respecting a major resistance level, price finally broke out, created fresh all-time highs, and is now pulling back to retest that very level.
This aligns perfectly with the principle of polarity: old resistance often flips into strong support.
Volume adds further conviction. Post-breakout, volume has been drying up during the pullback — an indication that sellers lack conviction.
✨ Final Takeaway ✨
Both perspectives — demand zone strength and breakout retest confirmation — are aligning bullishly. This confluence strengthens the case for Ramco Cements to resume its upward journey.
💡 Risk Management Reminder 💡
While the setup looks strong, risk management remains key. Always use SL and size positions carefully. Even the best setups can fail, but disciplined risk control ensures long-term success.
“In trading, patience and discipline are often the real edge.”
🔄 Stay disciplined, stay consistent — the market rewards those who wait! 🔄
This analysis is purely for educational purposes and is not intended as a trading or investment recommendation. I am not a SEBI registered analyst.
THE RAMCO CEMENETS - RAMCOCEMRAMCO CEMENTS share has broken out, with the first target set at the all-time high. I recommend placing the stop loss below 980.


RAMCOCEM:18% upmove possible🟢Picture perfect #VCP
🟢undertaking capex and increased cash from operations
🟢highest ever sales
🔴22% promoter holding pledged
🔴higher PE than some peers

Ramco Cements on sell side Technical Pattern:
There is a descending triangle pattern forming, suggesting a potential bearish breakout.
The price is consolidating, and the blue line indicates a possible downward trend continuation.
Market Sentiment: The slight increase in price with moderate volume suggests cautious optimism, but the technical pattern indicates potential for a downward move.

Ramco Cement Swing Long Setup - Ramco Cement looks all set for an expansion
- Ramco is currently trading at 831
- Accumulation Zone - 815-825
- SL - 3%
- Chase - 8%

THE RAMCO CEMENTS - SEIZING THE LONG SWING OPPORTUNITYSymbol - RAMCOCEM
Ramco Cements is currently trading at 772
730 - 770 is a good support area for The Ramco Cements.
I'm seeing a trading opportunity on buy side.
Buying Ramco Cement Futures at CMP 772
I will be adding more if 745 comes & hold with SL of 730
Targets I'm expecting are 812 - 845 - 930 & beyond.
Disclaimer - Do not consider this as a buy/sell recommendation. I'm sharing my analysis & my trading position. You can track it for educational purposes. Thanks!

RAMCO CEMENT AT RESISTANCEcmp 996
bearish H. triggred at 1003
tgt 980 / 975 / 969 / 961 / 955 / 950 / 944++
cbsl 1050
some correction from highs expected in RAMCOCEM
Regards
Keshav
14/10/2023

RAMCOCEM | Investment Pick📊 DETAILS
Sector: Cement
Mkt Cap: 22,440 cr
Ramco Cements Ltd is engaged in manufacture of cement, Ready Mix Concrete (RMC) and Dry mortar products. It primarily caters to the domestic market of India.
TTM PE : 80.14 (High PE)
Sector PE : 46.97
Beta : 0.73
📚 INSIGHTS
MID RANGE PERFORMER
Stock with medium financial performance with average price momentum and valuation. These stocks may be affordable and are showing some investors interest.
1.46% away from 52 week high
Outperformer - The Ramco Cements up by 5.23% v/s NIFTY 50 down by -1.55% in last 1 month
📈 FINANCIALS
Piotroski Score of 5/9 indicates Average Financials
Disclaimer: This analysis Is For educational purposes only, And I'm not a SEBI registered analyst.
If you found this analysis helpful, I encourage you to like and share it. Your observations and comments are also welcomed below. Your support, likes, follows, and comments motivate me to consistently share valuable insights with you.
🔍 More Analysis & Trade Setups 🔍
For more technical analysis and trade setups, make sure to follow me on TradingView: www.tradingview.com

Ramco Cement BuyIchimoku Cloud Broken
Price Retraced After Good Upmove
All The Leading Technical Indicators Positive
Cement Stocks In My Buying Scanner
Buy Ramco At Cmp 902
SL - 860 ( Day Closing Basis )
Target - 1055/1135

RAMCOCEM - Bullish Swing ReversalNSE: RBLBANK is closing with a bullish swing reversal candle supported with volumes.
Today's volumes and candlestick formation indicates strong demand and stock should move to previous swing highs in the coming days.
The stock has been moving along the horizontal support for the past few days which is indicating demand.
One can look for a 8% to 11% gain on deployed capital in this swing trade.
The view is to be discarded in the event of the stock breaking previous swing low.
#NSEindia #Trading #StockMarketindia #Tradingview #SwingTrade

Clear Flag and pole pattern in Ramco Cement.Ramco Cement is forming a flag and pole pattern on the weekly charts and there is a bullish moving averages cross over.
Stock has been consolidating for a month and is trading in a 40 points range. The break out can give good 150+ points as per the measure target.
Indian markets are trading near the ATH and stock will follow the indices.
On the daily time frame, the stock is respecting the 20 EMA and is taking good support from it. RSI indicator is showing some negative divergence and is around 50 levels.
Entry :- Above 950
Target :- 1037, 1090
Swing and positional trades can be initiated in the stock. Even short term stock purchase can also be created in the stock.
Wait for the market to show some break out as there is a bullish pattern formation.

RAMCOCEM - Long Setup, Move is ON..NSE:RAMCOCEM
✅ #RAMCOCEM trading above Resistance of 934
✅ Next Resistance is at 1050
Related charts:
Charts are self-explanatory. Levels of breakout, possible up-moves (where stock may find resistances) and support (close below which, setup will be invalidated) are clearly defined.
Disclaimer: This is for demonstration and educational purpose only. This is not buying or selling recommendations. I am not SEBI registered. Please consult your financial advisor before taking any trade.

RAMCOCEMRamco cements has been given 18 weeks of Insider Bar consolidation breakout and price is now consolidating above IB breakout level for last two weeks, keep this setup in radar for longs

RAMCOCEMRAMCOCEM:- Wait for breakout, strong support is at 765.80, keep an eye on the stock
Hello traders,
As always, simple and neat charts so everyone can understand and not make it too complicated.
rest details mentioned in the chart.
will be posting more such ideas like this. Until that, like share and follow :)
check my other ideas to get to know about all the successful trades based on price action.
Thanks,
Ajay.
keep learning and keep earning.

Trendline Breakout in The Ramco Cements Limited...Chart is self explanatory.
Disclaimer: This is for demonstration and educational purpose only. This is not buying or selling recommendations. I am not SEBI registered. Please consult your financial advisor before taking any trade.

Ramco cement long for target of 950Trying to form inverted head and shoulder pattern on weekly charts. Once the pattern completes around 800, long for target of 950 and above. Look for volume with breakout.

Breakdown in Ramco Cements Ltd...Chart is self explanatory. Levels of breakdown, possible down-moves (where stock may find support) and resistances (close above which, setup will be invalidated) are clearly defined.
Disclaimer: This is for demonstration and educational purpose only. This is not buying or selling recommendations. I am not SEBI registered. Please consult your financial advisor before taking any trade.

RAMCO KI DIWAR TUTE YA NAI STOCK TO GAYAThis chart is self explainatory nothing much to write just writing for the sake of criteria. but make sure you take it only for educational purpose only.

Preparing for Inverted HnS Pattern The Scrip is possibly moving for an Inverted HnS pattern and we may see a good upmove in this scrip. keep this in radar.

RAMCOCEM Long / Short | IntradayWe can go
Long in intraday above 730.60
Short in intraday below 719.40
Volumes are indicating more towards the Bullish side , but still, we can plan and trade both sides!

RAMCOCEM Is at short term trend line1 on daily chat reversal possibilities are there
2 this short term trend line is very decent
3 consolidation at trend line looks promising
