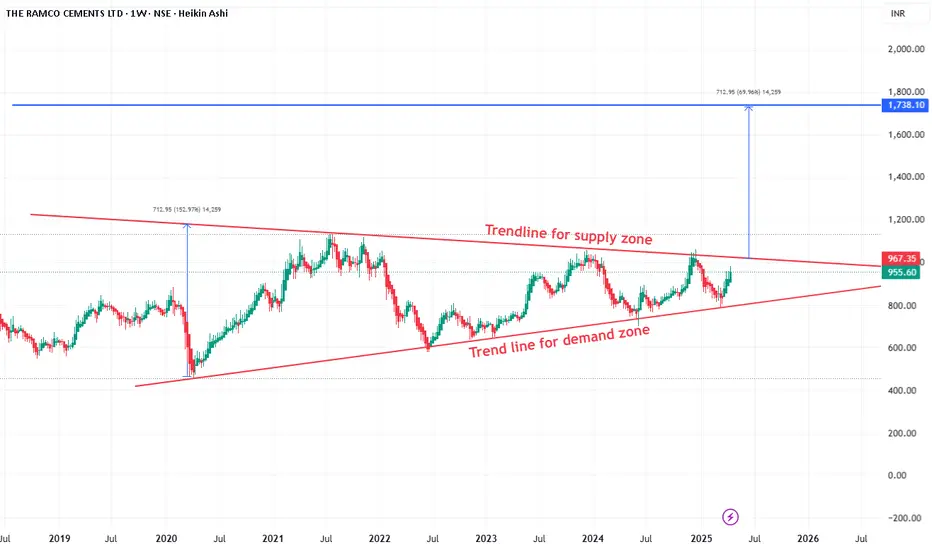
Ramco Cement may give break out of triangle pattern soon.Ramco Cement as per chart is trading on triangle pattern. As per indicator stock is bullish and ready for breakout. Major supply zone is 1010. After crossing this level, it may give massive move for considerable gain. It can accumulate here add more after breakout.
Ramcocement
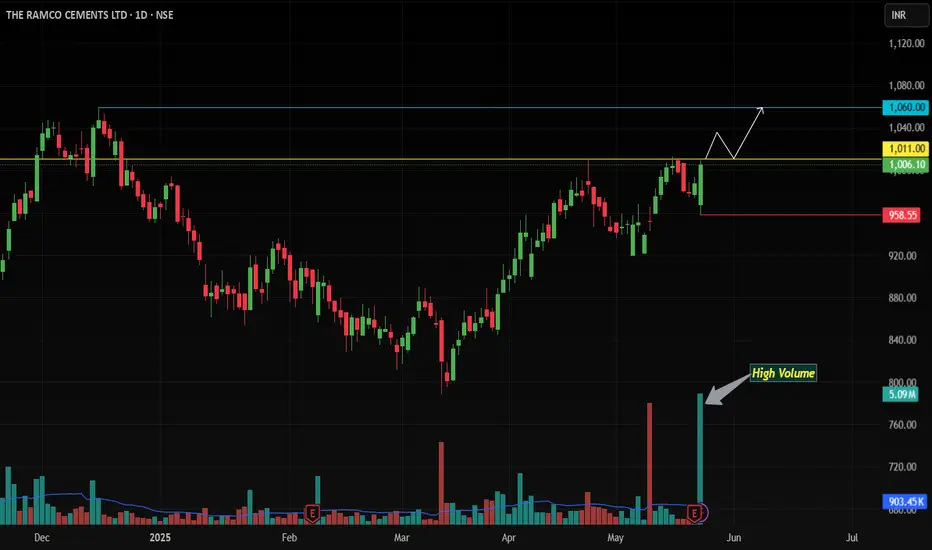
Bullish Breakout Alert! Key Resistance Zone Tested !Analysis Timeframe: Daily Chart | Instrument: The Ramco Cements Ltd (NSE: RAMCOCEM, BSE: RAMCOCEM)
Current Price: Near 1011-1015 | Key Levels: Resistance Zone (1011-1015), Support: 958 (Trailing SL)
🔍 Technical Setup Overview
Ramco Cements (NSE: RAMCOCEM) is flashing a high-conviction bullish reversal pattern on the daily chart, backed by surge in volume and multi-indicator confirmations:
Bullish Engulfing Candle 🕯️🔥
Today’s price action formed a Bullish Engulfing pattern, with the current candle fully swallowing the prior candle. This signals a strong shift in control from sellers to buyers, especially on extremely high volume (institutional accumulation).
EMA Alignment & Dynamic Support
Price rebounded sharply from the 20 EMA and sustains above the 50 EMA and 200 EMA, confirming the broader uptrend’s strength.
Resistance Breakout Potential
The 1011-1015 zone is a critical supply area. A daily close above 1015 would confirm the breakout, opening the path for a rally.
Momentum Confirmation
MACD: Bullish crossover
RSI: Crossed above, signaling bullish momentum acceleration.
🎯 Trade Strategy
Entry Trigger:
Go Long on Daily Close Above 1015
Targets:
First Target: 1060.
Trailing SL Strategy: After 1060, trail SL to the prior daily candle’s low. Exit only on a daily close below the trailing level.
Risk Management:
Initial Stop Loss: 958 (Today’s low, aligns with Bullish Engulfing pattern validity).
Risk-Reward Ratio: 1:2+ (Optimal for swing trades).
📉 Why This Works
Pattern Power: Bullish Engulfing + volume surge = high-probability reversal signal.
Trend Confirmation: Price above all key EMAs + breakout alignment.
Trailing SL: Locks profits while allowing for extended upside in a trending market.
🛡️ Key Risks
False Breakout: Failure to close above 1015 could trap bulls.
Market Sentiment Shift: Broader volatility may disrupt momentum.
Disclaimer: Trading involves risk. This is not financial advice. Verify setups independently.
#NSE #BSE #Breakout #BullishEngulfing #TechnicalAnalysis #RAMCOCEM #StockMarket
SMASH THAT BOOST BUTTON if you’re bullish! 🚀 Follow for more high-probability setups!
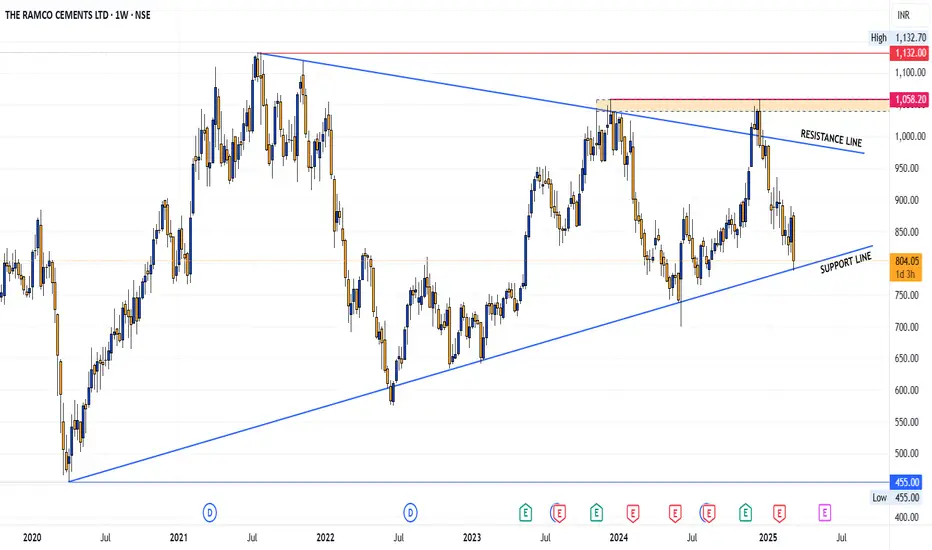
Ramco Cements: A triangle pattern is emergingRamco Cements is developing a triangle pattern, which occasionally offers support and resistance points that can create trading opportunities. I've highlighted these levels on the chart, and I hope this might be useful for anyone looking to navigate these price movements.
Ascending triangle pattern in Ramco CementsChart -> The Ramco Cements Ltd Daily
Textbook based ascending triangle pattern breakout seen with high volumes!
CMP: 900
Good Range To Buy: 875 to 910
Targets: 938, 970, 1015, 1050
SL: 855 Daily Close
Disclaimer: This is for educational purposes only, not any recommendations to buy or sell. As I am not SEBI registered, please consult your financial advisor before taking any action.

Ramco Cements on sell side Technical Pattern:
There is a descending triangle pattern forming, suggesting a potential bearish breakout.
The price is consolidating, and the blue line indicates a possible downward trend continuation.
Market Sentiment: The slight increase in price with moderate volume suggests cautious optimism, but the technical pattern indicates potential for a downward move.

Ramco cements ltd., Looking going; short term investmet; Add this to watchlist and wait for entry.👁️🗨️
For short term investment ;
Leave a " Like If you agree ".👍
.
Wait for small retracement & daily candle to close above - "840".
Trade carefully untill ENTRY level.
.
Entry: 840 / 780
Target: 870-915-1040-1100
sl: 815 (840) / 780 (765)
major stoploss / support: 780.
.
Enter only if market Breaks
"Yellow box" mentioned.
.
.
Don't make complicated trade set-up.📈📉
Keep it " simple, focus on consistency "💹
Refer our old ideas for accuracy rate🧑💻
Follow for daily updates👍
.
Refer old posted idea attached below.

Ramco Cement Swing Long Setup - Ramco Cement looks all set for an expansion
- Ramco is currently trading at 831
- Accumulation Zone - 815-825
- SL - 3%
- Chase - 8%

THE RAMCO CEMENTS - SEIZING THE LONG SWING OPPORTUNITYSymbol - RAMCOCEM
Ramco Cements is currently trading at 772
730 - 770 is a good support area for The Ramco Cements.
I'm seeing a trading opportunity on buy side.
Buying Ramco Cement Futures at CMP 772
I will be adding more if 745 comes & hold with SL of 730
Targets I'm expecting are 812 - 845 - 930 & beyond.
Disclaimer - Do not consider this as a buy/sell recommendation. I'm sharing my analysis & my trading position. You can track it for educational purposes. Thanks!

Long Position in Ramco CementLooking at the chart in the higher time frames you can see a clear tap in to the M timeframe OB.
A strong displacement to the upside creating a OB in the W timeframe - unmitigated.
Gap at the top acting as a magnet for price to move into.
Very clean CoCH and BOS giving confirmation of the move up into higher levels.
A great entry be entry in the GOLDEN level of price retracement - 60% fibs
Levels are in confluence with the W +OB.
Expect price to tap into the W +OB and move higher to the magnets (GAP liquidity, trendline short liquidity)

RAMCOCEMENT RESISTANCE BREAKOUTRamcocement breaking long term resistance
good volume and rsi
target can be 1050
educational idea only

Ramco Cement BuyIchimoku Cloud Broken
Price Retraced After Good Upmove
All The Leading Technical Indicators Positive
Cement Stocks In My Buying Scanner
Buy Ramco At Cmp 902
SL - 860 ( Day Closing Basis )
Target - 1055/1135

Clear Flag and pole pattern in Ramco Cement.Ramco Cement is forming a flag and pole pattern on the weekly charts and there is a bullish moving averages cross over.
Stock has been consolidating for a month and is trading in a 40 points range. The break out can give good 150+ points as per the measure target.
Indian markets are trading near the ATH and stock will follow the indices.
On the daily time frame, the stock is respecting the 20 EMA and is taking good support from it. RSI indicator is showing some negative divergence and is around 50 levels.
Entry :- Above 950
Target :- 1037, 1090
Swing and positional trades can be initiated in the stock. Even short term stock purchase can also be created in the stock.
Wait for the market to show some break out as there is a bullish pattern formation.

#RAMCO Cement BO will sustain or not ! Stock has given BO with strong volume spike on weekly TF forming a round bottom pattern, follow chart for proper support and resistance levels

Positional Trade Buy (RAMCOCEM)Name- RAMCOCEM
Trading Style- Positional
Strategy- MCC ( Momentum + Consolidation + Confirmation )
Buy Above Breakout Candle High
Stoploss Below Breakout Candle Low
Target Should be 1:2
Note: All the details are provided on the chart itself
Check updates regularly regarding this trade idea

Ramco cement long for target of 950Trying to form inverted head and shoulder pattern on weekly charts. Once the pattern completes around 800, long for target of 950 and above. Look for volume with breakout.

Ramco CementRising Wedge is a bearish Pattern
IF Ramco Cement Break the lower trend line we may further see much more selling this stock
*Only for education purpose*

Ramco cements triangle breakoutRamco cement looks like going up for short span. but still in correction

Preparing for Inverted HnS Pattern The Scrip is possibly moving for an Inverted HnS pattern and we may see a good upmove in this scrip. keep this in radar.

Ramco cement breakout on hourly chartRamco cements
Head and shoulder breakout on hourly chart
could be bullish on short term
can be bought at a retest of around 615
Stay tuned for 640 and 650 on short term

RAMCOCEM Head & ShouldersRAMCOCEM has formed extended head and shoulders on 1D chart along the 920 baseline. Breakdown from here can be significant hence caution suggested for longs. No fresh shorts yet as the trendline is not broken. If the baseline is broken, the stock can see a measured move fall toward 750.

Long RAMCO CEMENT...High Probability SetupRAMCO CEMENT
Cmp - 1028
Stop - 1000
Expectation -
T1 - 1070
T2 - 1120, Review at 1120
Expected Holding Period - 3 months or earlier for T1, 5 months or earlier for T2
View:- Swing/Investment

Simple Trade Setup | RAMCOCEMENT | 01-11-2021 [ INTRADAY]NSE:RAMCOCEM
I am posting this from one of the follower's request on Twitter.
Observations:
1) On daily time frame, we can see it took Good support from 50DMA and gave breakout of 1050 level.
If it gives dip till 1040/1050 level and takes support from it then it will be buying opportunity.
Target will be 1140.
Please refer below chart : 1day Time Frame.
2) On 15min time frame we can see it gave breakout of cup and handle pattern.
Please refer below chart : 15min Time Frame.
-------------------------------------
Trade Setup for Date 01-11-2021:
1) Don't Jump in to trade at the beginning of the market. Let it get settle for 15-20min first and judge the price action.
2) Everything is mentioned on the chart. I hope it is easy to understand.
3) All the levels will work as support, resistance, entry and exit w.r.t price action near that level.
4) Avoid gap up or gap down chase. Wait and trade between levels.
Please refer below chart for levels.
Hope I made it easy to understand it.
Do comment your doubt or suggestion.
Note: Trade with Strict SL. It may or may not hit all the levels. So one can book profit / loss at respective level considering how price action works near that level.

Ramco Cement Trade Setup For MondayThere is a strong support at the level of 963, stock tested this level two times.
.
On Monday if stock goes below 960, we can short this trade for the target of 930.
.
What's your view on this comment below in the box.
