KansaiNerolac - Dravas box BreakoutKansai Nerolac has broken out of a 5 months long-range pattern. Looks good for Swing traders.
Rangebreakout

IGL RANGE BOUND BREAKOUTEXPECTING MOVE UPSIDE COZ IT HAS BEEN CONSOLIDATED FOR LONG TIME and retested the trendline
Disclaimer: Please consult your financial advisor,
Investment/Trading in the securities market is subject to market risk, We are not responsible for your profit or loss

Venkeys: my bar-by-bar trade analysis from 1700-3100+Following is my bar-by-bar trade analysis of Venkeys, currently sitting at 80%+ ROI.
a. Entered NSE:VENKEYS thanks to the range breakout + RSI 60 breach, indicating momentum. Stop placed at around gap filling (1650). 50DMA was ~9% away from LTP.
b. Price saw a strong move on the upside on the next day with a sizeable gap-up. 2,000 psych level held + very strong volumes.
c. The next day, the price saw a strong rejection of higher levels, but it had held on to the gap up and closed above the prev candle's high. Not exiting here was a tough decision, but such trades don't come up often, and exiting too early may mean you leave far too much on the table. I'd moved my stop to gap-filling and subsequent 2100 rejection.
d. Price shook out weak hands by testing lower levels but showed a very strong upmove.
e. What follows are a few candles that signal exhaustion at higher levels including an inverted hammer. But by this point, I understood that Venkeys appears to have a history of showing price rejection after making a high and that a strong move might follow. The only way to catch on to this strong move would be to set a trailing stop and let the markets do the work. A stop was set to prev candle low (for partial qty) as I wanted to secure profits, too.
f. Trailing stop hit, booked partial quantity profits. Now let the rest of the position run. Potential gap retest possible, but booking partial profits helps you stay in the trade for longer. However, this can also make you hold on to a position for longer than you would have. So best to be strict.
g. Started showing signs of support after the dip.
h. Tried to breakout, but sellers stepped in making an inverted hammer pattern. But, this is more or less normal. Still holding.
i. Strong move after a doji. Staying alert as the price had just breached FIB level. This is where price had typically started showing exhaustion.
j. Observing the price movements carefully. Next round of selling around highs. The potential of a further move is still there, as the price has shown its personality. But placing a trail is important.
k. Holding position despite the sliding price. In hindsight, I might have waited a little longer than required. Exiting once the lows of the inverted hammers were broken could have been better.
l. News of China suspending the import of frozen seafood owing to COVID-19 traces emerges. Venkeys slides, and I'm cautious at this point. Trail hit as 2700 levels are rejected.
m. Strong move, but price remains sideways after that for the most part.
n. Yet another strong move, and now the price is above 3,000 psych level.
o. Still holding partial quantity with the intention to trail as long as the move lasts. I will update as the price moves...
This was compiled during the live market, so there's a chance that what I've said in points n. and o. has been negated by EOD.
I know the smallcase alphabets I've used are also used in EW analysis. My intention isn't to display any EW, but that was the easiest way of marking the candles for easy reference.
P.S. I used FIB channels to test how they work. They aren't exactly my entry or exit basis, but I will do a quick tutorial on them, too.
Hope this helps! Happy trading :)

TATASTEEL BullishWas moving in a range from last month, has broken the lower support three days back and today tested the resistance,
Now in the coming days, it might move further down. Follow the price action for Entry and exit points.

KSCL | KAVERI SEED | Ready for UpmoveHello Traders, I am back with another Swing trade for this coming week. Smash that LiKe button NoW!
Kaveri Seed : Breakout & Retest Done on weekly Chart.
Looks good from here to reach 10-15% or even more. let see I am already IN.
recommended SL : below low of weekly candle
@Follow us ..Don't miss any new stock idea update. Good Luck :)
#monthlybreakout #weeklybreakout #multiyearbreakout

#RainIndustriedBuy Rain industries for target of 230 (short term) stoploss 180
long term target 280 ++ stoploss 165


TATAMETALI - Intraday Analysis (14th June - 2021)Tatametaliks intraday analysis for 14th June. It had a Range breakout on Friday's session. All levels mentioned on the chart. Plan your risk before taking any trading decision.
TLong


DeepakNTR - Range Breaout - Swing/IntradayDeepak NTR consolidation in a range near support. Closed bullish today with good buying volume. Entry-level mentioned in the chart. Plan risk before you trade.

APLLTD BreakoutAplltd breaking out of Range / Resistance and Trendline together. Looks good for swing trader can consider this with proper risk management.

Oberoi Realty from 7 June 2021The stock has given breakout after 145 days
Buy :
15% --> 625
15% --> 630
70% --> 650 AFTER TOUCHING 625 SUPPORT PRICE
ABOVE BUYING SPLIT TO PREVENT FALSE BREAKOUT
Target :
670 -> 680 -> 700 -> 740


FINCABLES FROM 4 June 2021Stock has given breakout _> then retest also done
good upside movement can be seen
right-now it is in resistance zone from historical downside price level if comes down good buy recommended

Escorts Daily ChartEscorts Daily chart has a Range BO but long view on closing above the immediate Trendline.


PEL Daily ChartRange BO In PEL daily chart and retest over the Bo area. Looks good to go long upon reversal at this point.
PLong

ACRYSIL Range Breakout on daily TFACRYSIL has broken range consolidatio with strong volume.
If sustains above 393, can be a good option for swing.
ALong

RIDDHI 8 month range breakoutRIDDHI has given range breakout from 8 month previous high.
Target 1: 382.2 / SL: 308.5

Bhartiartl1.Formation of the symmetrical triangle
2.Rounding bottom pattern
3.fundamental news
Disclaimer: Please consult your financial advisor,
Investment/Trading in the securities market is subject to market risk, We are not responsible for your profit or loss

Nifty Rangebound movement, Range breakout Expected!As you can see Nifty is moving in a range.
In previous idea I showed how to trade range ( Link attached )
If you look at line chart of nifty from all time high nifty use to make lower low on line chart.
Since later march nifty has not made a new low on line chart, Thus moving in range.
In fact Nifty made a high Low as marked on chart. This makes my view sightly bullish on Nifty.
Nifty is also trading above short term moving averages now. I have show 20 MA with line.
You can confirm with other short term moving averages also.
14700-14500 will be support levels now, As long as it sustains above these levels view remains positive
Below 14320-14250 view will be negative.
In broader markets Mid cap & Small Cap indices are either giving breakout or trading near to all time high.
This Show bullish bias overall.
Check NSE:CNXMIDCAP
Check NSE:CNXSMALLCAP
Taking a Break as of now will back after few weeks.
Take care. Stay safe. Keep Growing

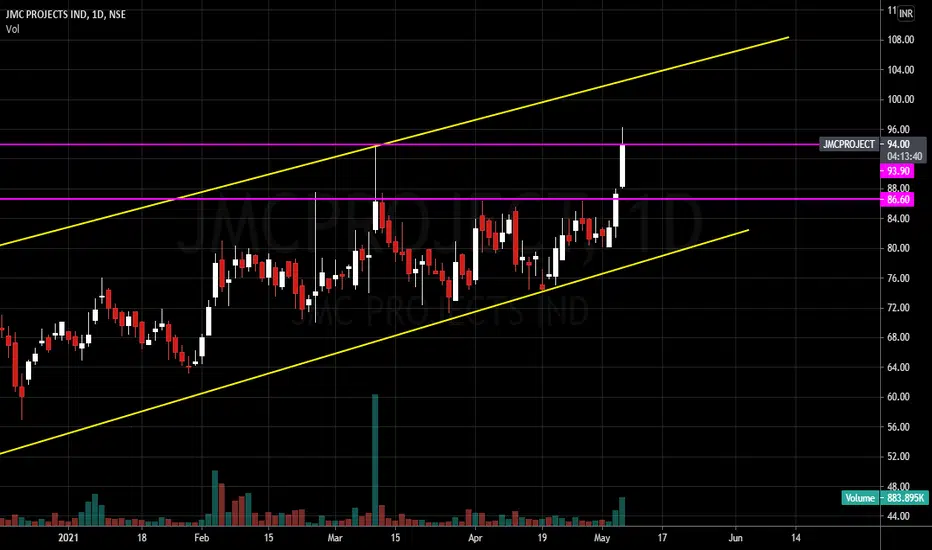
JMCPROJECT : Multi week Range Breakout Bullish above 97 close today
Multi week Breakout
Target 106, 112, 126
SL: 82
Risk is yours and Reward is too yours totally
JLong
Excel industries looking very strongExcel industries charts looking very strong for short term
Range breakout after almost 2 years consolidation
Sustaining above 1050 can take it more upside
View negative below closing of 975 only
DISCLAIMER
( Educational Purpose )
All investments involve risk.
Please Do your analysis before initiating Any trade
Good luck !
