Nifty Range Breakout/Breakdown Expected.Nifty is stuck in a range since 18 March 20.
On 8th March tried to break the range on upside but the attempt was rejected.
Within next 2 sessions Nifty touched the lower end.
Lower end is also the lower range of the gap that was created during the budget move
After 12th March Nifty took support on lower end. of the range. If you observe it took 3 sessions to absorb the selling on 12th March .
Nifty made a Lower High as marked on chart. Yesterday there was a good gap up opening, but it didn't sustained and Nifty reached the lower end of the range.
This makes my view slightly on bearish side, but will wait for the Range Breakout/Breakdown.
When there is range breakout usually big moves occur.
Check Attached links for references
If Nifty Breaks down there is no immediate support in between till the indecision zone marked.
Bank Nifty has already reached the same indecision zone. Check the Chart Below
Rangetrading

Nifty: Bouncing From Support--Stocks IdeasThe charts posted below are for educational purpose only.
If Nifty does not perform, these stock may also not perform. If Nifty performs, some of them may outperform. 14350 should be a panic stop for Nifty with 15300, the upper end of range, as target.
Always take calculated risk on any trade.
Regards

Buy On Dip StockAnalysis :-
1. Stock is trading in old range from 2013.
2. Buy on dip on trendline provided or if further brokedown than enter on 200 moving average provided.
3. Stock is trading in range so better book profit immediately on its most recent resistance seen. There is 100 of other stocks to look for opportunity. Never be emotionally invested and stuck in a stock
4. Diploy not more than 3% to 5% capital.

Angle Broking trading in range good for 13%Trading in range
Taken a support at 320
Good for 375
SL - 315 on closing basis
R:R - 1:2.5

Double Confirmation Trade on Nifty50There were 2 strong indications to go short on Nifty:
1. M pattern (Double top) forming around 15,230.
2. TrendLine break and last kiss was also seen.
The target logically was the last region of consolidation where I expected Nifty to find support, which was around 15,100.
The market has been range bound since the post budget rally and is finding it difficult to break significant levels to move higher. This means that trading the boundaries is more logical and will yield more profits.
The market bounced back very sharply from 15,000 and moved to the other extreme of 15,200.

HDFC bank | Trendline Breakdown 🎯⭕ Swing Trading opportunity ! 4hr Chart Alert !!!⭕
--short below =1429 or CMP
--Target = 1397 | 1358
--Stop-loss = 1465
--R:R =1.49
--Expected Profit = (5% )
--Expected Holding = 15 days only
#ThankU For Checking Out Our Content , We Hope U Liked IT 📌
======================================================
⭕Technical Reasons to trade or Strategy applied :- ⭕
1) hdfc bank has given the breakdown of trendline & support & 50ems as well
2) doji candlestick pattern & big bearish candle running
3) volumes is also decent
4) rsi divergence strategy applied
Guys check out the related ideas as well, it will work really well GUARANTEED !
🙏FOLLOW for more !
👍LIKE if think is useful !
✍COMMENT Below your view !


BAJAJFINANCE :AnalysisThe stock has given breakout from its monthly as well as weekly support levels. A possible retracement is underway, if this support level was held firm by this stock then there will be continuity in the uptrend.
.
The safest entry levels are above 5400.00 Levels and SL must be below the immediate swing low.
.
Wating current market sentiment Risky Trades can enter at 5100.00 levels if found sustaining the support levels.
Recommended Sl must be near 4950.00 to 4900.00
.
Calculate ur RR ratio and then trade.
PS: I am expecting a halt at support levels for a bit them momentum might continue.

HDFCBANK | Small range bound opportunity for 6%HDFCBANK | Small range bound opportunity for 6% - Infact this is one of the main reason why i was bullish in the morning in BANKNIFTY
CMP : 1373 (Dip upto 1355)
Target : 1445
SL : 1343
Simple 1:3 risk reward setup

TCS | Descending Triangle / Range Trading Swing Trading opportunity ! Weekly Chart Alert !
Enter on lower time frame after breakout 🎯
Lot Size =300
Target = 2878
Stop-loss = 2576
1) Descending Triangle and Range trading can be done
2) Parallel channel Formation
3) Support zone is 2249-2299
Guys check out the related ideas as well, it will work really well guaranteed !
FOLLOW for more !
LIKE if think is useful !
COMMENT Below your view !

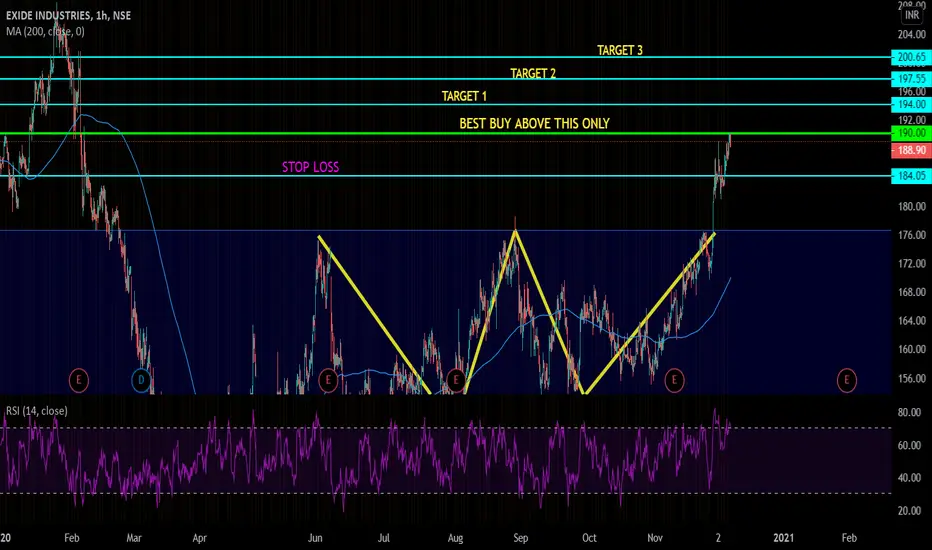
EXIDEIND 1HRTHE STOCK IS IN BULLISH TREND BEFORE IT GAVE A BREAKOUT OF THE BULLISH W PATTERN THEN IT WAS CONSOLIDATING IN A RANGE TOMMORROW
IT MIGHT BREAK ITS RANGE
BEST BUY WILL BE ONLY ABOVE 190 PLUS NOT BEFORE IT
ONE CAN GO FOR THE TARGETS MENTIONED IN THE CHARTS.
IOC | price is not moving but RSI is making HHStock is at strong support level , price is now at range and accumulation of share is must happening as volatility deceased
RSI is continuously making Higher High
Possible upside breakout will happen
targets are mentioned i.e 83
lot size = 5700
check out the other ideas as well
FOLLOW & LIKE & COMMENT

Hindalco | looks good for up side ..... buy it guys if break downside then cancel the trade
All the best for the upcoming trades
check the other ideas as well

LT | Accumulation Zone | Range Trading LT is now at range , wait for the breakout and breakdown and then place your trade
Targets are mentioned through arrow
DONT forget to check out the related ideas
LIKE & FOLLOW & COMMENT

Took support from $ 39 for 4th timePrice took support from the same level once again, it should break 41.5 level to make new high else this consolidation/ swing trade will continue.

3 Months of range market - Buy on supportPrice trading inside a range for the last 3 months and it is expected to continue in this month also, as price reached the support last month and moved up to the trend line it is expected to reject here and once crosses the trend line it will head to the resistance level at the top.
Good positional buy in cash !!!

M_M | Range Trading | Daily Analysis Mahindra & mahindra now trading at range
once it break then it will possible go up till target = 718.65

Support & resistance in POWERGRID i was BANNED for violating house rule so i am republishing again without any alteration
Bought @ 177.35
Target @ 199.40
Lot size = 4000

Britannia trade analysis & opportunities Price after a big up trend breaking 2 years resistance now trading in range market / consolidation.
If breaks 4000 then once again a big uptrend is possible. But one can trade this script when the price touches the channel bottom.
Recently price touched 3600 range and went up to the channel 3900, in this trade one would have made 300 points with simple price action.
2 chances to initiate a trade. Either wait for 4000 cross or buy on channel bottom considering it as support level.

Bank Nifty - 17th Sep Weekly Expiry IdeaSell 23100CE
Sell 21500PE
Breakevens: 21670.0-23330.0
Max Profit at CMP - 5,765
Will Place a StopLoss Buy&Sell GTT orders at the Break-Even Prices on Futures to cover exposure to range break.

WIPRO ------ Analysis1.Wait for perfect breakout
2.Formed triangle pattern
3. check comment box regularly
#tradethetip

COAL INDIA ---- Daily Chart Analysis Wait for breakout or breakdown
but look for buying opportunities
mostly upside

