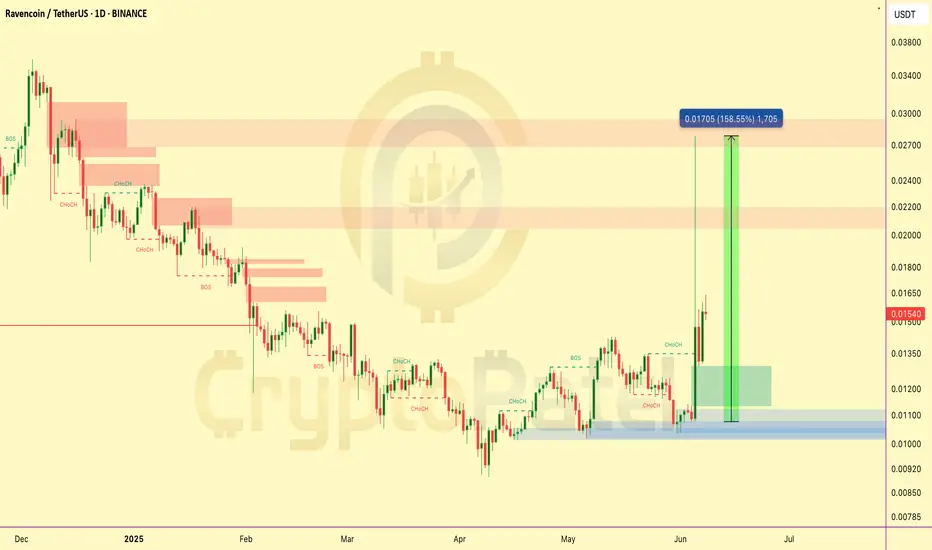
RVN/USDT Just Flipped Bullish —But Caution:High Volatility AheadRavencoin ( NGM:RVN ) pumped 158% within the last 4 days, but after the rally, it dumped -42% — showing a classic highly volatile pump & dump behavior.
👉 This type of move signals caution — it’s best to avoid blindly entering such setups.
✅ The upside rally tapped all key Bearish Order Blocks — leading to the sharp rejection.
✅ Despite the drop, RVN is still trading +45% above the recent 4-day bottom — volatility remains very high.
Current downside FVG (Fair Value Gap) → $0.01132–$0.01296
→ If price taps this zone, it could offer a better risk/reward entry — but only for experienced traders watching closely.
Summary: The chart currently does NOT look ideal for fresh entries — stay patient and let the structure develop.
👉 Save this post to stay updated — I’ll share if a new safer entry emerges!
NFA & DYOR
Ravencoin
One of the best crypto to begin your trading\investing with.Raven coin is one crypto i am having my eyes on lately, it has given good returns after the crash and expecting it to continue the same

💡 Don't miss the great buy opportunity in RVN/USDTrading suggestion:
. There is a possibility of temporary retracement to suggested support line (0.0820). if so, traders can set orders based on Price Action and expect to reach short-term targets.
Technical analysis:
. RVN/USD is in a range bound and the beginning of uptrend is expected.
. The price is above the 21-Day WEMA which acts as a dynamic support.
. The RSI is at 67.51.
Take Profits:
TP1= @ 0.0945
TP2= @ 0.1010
TP3= @ 0.1085
TP4= @ 0.1190
TP5= @ 0.1320
SL= Break below S2
❤️ If you find this helpful and want more FREE forecasts in TradingView
. . . . . Please show your support back,
. . . . . . . . Hit the 👍 LIKE button,
. . . . . . . . . . . Drop some feedback below in the comment!
❤️ Your Support is very much 🙏 appreciated!❤️
💎 Want us to help you become a better Forex trader?
Now, It's your turn!
Be sure to leave a comment let us know how do you see this opportunity and forecast.
Trade well, ❤️
ForecastCity English Support Team ❤️

💡Don't miss the great buy opportunity in USDJPYTrading suggestion:
. There is a possibility of temporary retracement to suggested support line (0.0820). if so, traders can set orders based on Price Action and expect to reach short-term targets.
Technical analysis:
. RVN/USD is in a range bound and the beginning of uptrend is expected.
. The price is above the 21-Day WEMA which acts as a dynamic support.
. The RSI is at 67.51.
Take Profits:
TP1= @ 0.0945
TP2= @ 0.1010
TP3= @ 0.1085
TP4= @ 0.1190
TP5= @ 0.1320
SL= Break below S2
❤️ If you find this helpful and want more FREE forecasts in TradingView
. . . . . Please show your support back,
. . . . . . . . Hit the 👍 LIKE button,
. . . . . . . . . . . Drop some feedback below in the comment!
❤️ Your Support is very much 🙏 appreciated!❤️
💎 Want us to help you become a better Forex trader?
Now, It's your turn!
Be sure to leave a comment let us know how do you see this opportunity and forecast.
Trade well, ❤️
ForecastCity English Support Team ❤️

There is a trading opportunity to buy in RVNUSDTechnical analysis:
. RaventCoin/US Dollar is in a range bound and the beginning of uptrend is expected.
.The price is above the 21-Day WEMA which acts as a dynamic support.
. The RSI is at 65.
Trading suggestion:
. There is a possibility of temporary retracement to suggested support zone (0.0236 to 0.0192). if so, traders can set orders based on Price Action and expect to reach short-term targets.
Beginning of entry zone (0.0236)
Ending of entry zone (0.0192)
Entry signal:
Signal to enter the market occurs when the price comes to " Buy zone " then forms one of the reversal patterns, whether " Bullish Engulfing ", " Hammer " or " Valley " in other words, NO entry signal when the price comes to the zone BUT after any of reversal patterns is formed in the zone. To learn more about " Entry signal " and the special version of our " Price Action " strategy FOLLOW our lessons :
Take Profits:
TP1= @ 0.03395
TP2= @ 0.04317
TP3= @ 0.05055
TP4= @ 0.05798
TP5= @ 0.06845
TP6= @ 0.08190
TP7= Free

Raven #RVNBTC join the wave 5buy under 640-635 sat
Target 1 800 sat
Target 2 840 sat
Target 3 +850 hodl
stop loss 615 sat

There is a possibility for the beginning of an uptrend in RVNBTCTechnical analysis:
. RAVENCOIN/BITCOIN is in a range bound and the beginning of uptrend is expected.
. The price is above the 21-Day WEMA which acts as a dynamic support.
. The RSI is at 50.
. The RSI downtrend and the price downtrend in the daily chart are broken, so the probability of the resumption of an uptrend is increased.
Trading suggestion:
. There is a possibility of temporary retracement to suggested support zone (0.00000400 to 0.00000330). if so, traders can set orders based on Price Action and expect to reach short-term targets.
Beginning of entry zone (0.00000400)
Ending of entry zone (0.00000330)
Entry signal:
Signal to enter the market occurs when the price comes to " Buy zone " then forms one of the reversal patterns, whether " Bullish Engulfing ", " Hammer " or " Valley " in other words,
NO entry signal when the price comes to the zone BUT after any of the reversal patterns is formed in the zone.
To learn more about " Entry signal " and the special version of our " Price Action " strategy FOLLOW our lessons:
Take Profits:
TP1= @ 0.00000510
TP2= @ 0.00000604
TP3= @ 0.00000698
TP4= @ 0.00000815
TP5= @ 0.00001000
TP6= Free
