RBL BANK - Bullish Flag & Pole Breakout (Weekly T/F)Trade Setup
📌 Stock: ASAHI INDIA GLASS ( NSE:RBLBANK )
📌 Trend: Strong Bullish Momentum
📌 Risk-Reward Ratio: 1:3 (Favorable)
🎯 Entry Zone: ₹261.00 (Breakout Confirmation)
🛑 Stop Loss: ₹225.00 (Weekly Closing Basis) (-5 % Risk)
🎯 Target Levels:
₹275.40
₹289.85
₹304.25
₹318.65
₹333.10
₹347.50
₹ 361.00 (Final Target)
Technical Rationale
✅ Bullish Flag & Pole Breakout - Classic bullish pattern confirming uptrend continuation
✅ Strong Momentum - Daily RSI > 60, Weekly RSI >60 Monthly rsi >60
✅ Volume Confirmation - Breakout volume 130.71M vs previous day's volume 24.71
✅ Multi-Timeframe Alignment - Daily and weekly charts showing strength
Key Observations
• The breakout comes with significantly higher volume, validating strength
• Well-defined pattern with clear price & volume breakout
• Conservative stop loss at recent swing low
Trade Management Strategy
• Consider partial profit booking at each target level
• Move stop loss to breakeven after Target 1 is achieved
• Trail stop loss to protect profits as price progresses
Disclaimer ⚠️
This analysis is strictly for educational purposes and should not be construed as financial advice. Trading in equities involves substantial risk of capital loss. Past performance is not indicative of future results. Always conduct your own research, consider your risk appetite, and consult a financial advisor before making any investment decisions. The author assumes no responsibility for any trading outcomes based on this information.
What do you think? Are you watching NSE:RBLBANK for this breakout opportunity? Share your views in the comments!
RBLBANK

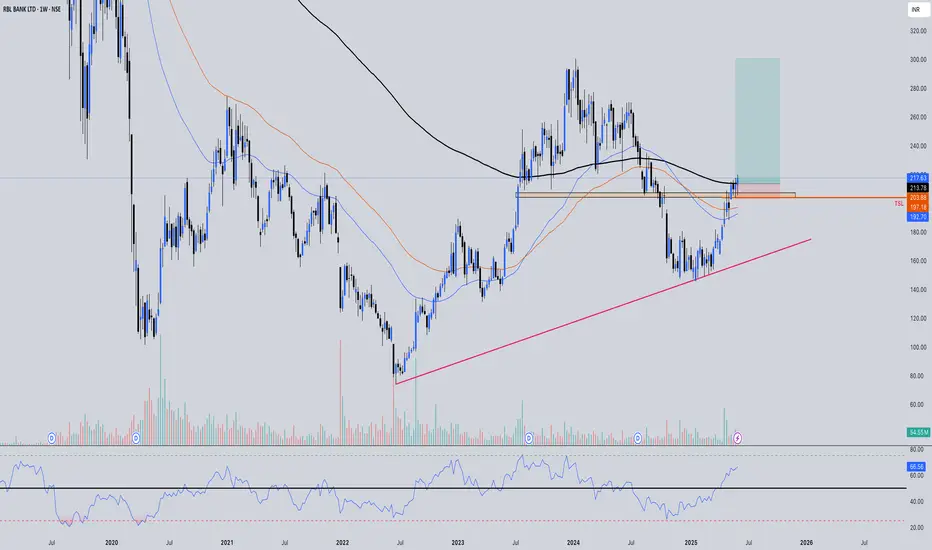
RBL Bank -Multi-Year #Breakout After 4 Years of ConsolidationRBLBANK has broken out of a multi-year resistance zone after a long accumulation phase since 2020.
This type of structure often leads to sustained upside momentum if the #breakout holds.
📌 Breakout Zone: ₹280 – ₹300
📌 Current Price: ~₹327
📌 Structure: Higher Highs & Higher Lows
📌 Volume: Strong accumulation visible
📌 Trend: Strong uptrend above long-term trendline & EMAs
Key Levels
Immediate Resistances ₹360
₹425 (Major long-term level)
Supports
₹300 – breakout retest zone
₹260 (major swing support)
As long as price stays above ₹300, bulls remain in control 🐂🔥
Technical Highlights
✅ 4-year consolidation breakout
✅ Major downtrend line broken
✅ Strong volume confirmation
✅ Clean price action + trend continuation
View
Bias remains bullish as long as price holds above the breakout zone.
Breakout + retest setups may offer opportunities in trending markets.
Not investment advice — for educational chart analysis only. Always do your own research.

Rbl bank Grey line nifty50 index vs rbl bank price
When index fall , this stock stay in range absorp selling pressure well
How smooth stock now moving
Just look interesting chart

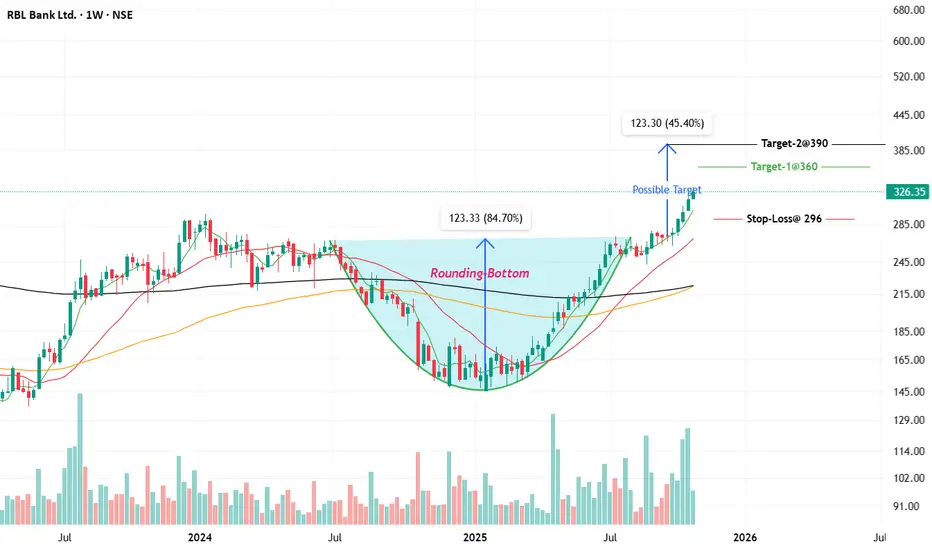
RBL Bank on the Verge: Weekly Chart Signals a Fresh Trend BreakRBL Bank has shown strong bullish momentum in its weekly chart, supported by rising price, strong moving averages, and a robust uptrend. The stock is currently trading near its 52-week high at around ₹326, indicating significant strength in the ongoing trend.
Technical Indicator Analysis
• Price and Trend: The stock has risen over 42% in the past year and over 7% in the last month, supported by strong volume and positive sentiment.
• Moving Averages: The 50-week and 200-week moving averages are sloping upwards, and the price is trading well above both, which is a bullish sign.
• Relative Strength: RSI (implied by the breakout and new highs) likely remains in bullish territory, confirming momentum.
• Support and Resistance: The stock has immediate support near ₹300 and strong resistance is seen at the recent high of ₹331.50.
Chart Pattern and Target
• Pattern Observed: A continuation breakout, possibly following a flag or rounding bottom pattern, is implied. The price action has broken past key resistances, and the trend remains strong.
• Entry Point: New entries can be considered on minor pullbacks toward ₹310-315, or on a weekly close above ₹331.50 for momentum traders.
• Target: Immediate target is the all-time range toward ₹350 . If momentum continues, longer-term targets could be in the ₹380–400 zone, using previous swing projections and extension from current levels.
• Stop Loss: Suggested stop-loss for positional trades is below ₹296 on a closing basis to protect gains and manage downside risk.
Overall, the weekly technical for RBL Bank support a bullish stance with buy-on-dip and breakout strategies, as long as the price remains above the key moving averages and stop-loss.
📌 Thanks a ton for checking out my idea! Hope it sparked some value for you.
🙏 Follow for more insights
👍 Boost if you found it helpful
✍️ Drop a comment with your thoughts below!
RBLANK: Volume Squeeze Hints at Major BreakoutIdea Summary: Daily Time frame
RBLANK formed a massive 'Mother Candle' on Oct 20, 2025, then consolidated inside its range for 7 days. Volume has been declining during this compression, creating a classic volatility squeeze. The stage is set for a high-probability breakout.
Trade Setup (Bullish Breakout):
Trigger: Daily close above 328.85
Confirmation: Surge in volume (must exceed 20-period average)
Target 1: 340
Target 2: 380
Target 3: 400
Stop Loss: 302 (trail stops after T1)
The Rationale:
The mother candle showed institutional interest. The 7-day consolidation with declining volume indicates exhaustion of sellers. Any breakout with significant volume expansion confirms fresh buying momentum, suggesting a sustained move.
Volume Logic: Declining volume during consolidation + volume expansion on breakout = high-probability trade. Without volume confirmation, the breakout lacks conviction.
Risk: Position size according to the 302-329 risk range. False breakouts possible without volume confirmation.
Disclaimer: Educational purpose only. Trade at your own risk.

RBLBANK ( M ) BREAKOUTStock Name : RBL BANK ( M )
Friends, after a long time, this stock has broken out in the monthly time frame after about five years and eight months. This type of breakout is considered very strong and there are only two days left for the completion of this month's candle. So we can consider this as a complete breakout. If you look at the range of the breakout, it was Rs 180. Then you can add the stock to your watch list.
Target 1 : 396 - 400
Target 2 : 475 - 500
Note: Our posts are posted for learning purposes. You will be responsible for any profit or loss you make from the advice given in the channel. Before investing in the stock market, you must consult your financial advisor.
WE ARE NOT A SEBI REGISTERED

RBL: Is set for a smooth upmove?⚡️Price Analysis:
1️⃣ Price broke the resistance.
2️⃣ Price structure is bullish.
3️⃣ Price trading above EMAs
4️⃣ Overall there is good volume & strength
✨ Key Observations:
➡️ RRR favourable at CMP.
➡️ Price should continue the upside momentum.
➡️ Overall banking sector is strong.
⚠️ Disclaimer: This is NOT a buy/sell recommendation. This post is meant for learning purposes only. Views are personal. Please, do your due diligence before investing.⚠️
💬 Share your thoughts in the comments below! ✌️
🔥Trade Safe!✅🚀
RBL BANK ANALYSISMy Chart of the Week is a potential turnaround story.
A stock once called the next "Yes Bank" is now showing signs of serious strength. Here's the deep dive on RBL BANK. 👇
Stock: RBL BANK
CMP: ₹276
Here’s why it's on my primary watchlist:
1. The Technical Picture
The structure is clean. It's breaking out of a long consolidation base after clearing a major resistance zone that has held for over 1.5 years. This is a classic sign of a character change.
2. The Relative Strength 💪
This is what separates leaders from laggards.
RBL BANK has shown impressive strength, holding firm during market volatility and outperforming both the NIFTY and its own sector. This is not the behavior of a weak stock.
3. The "Smart Money" Catalyst 🔍
This is the most compelling part. After years of underperformance, big money is taking notice.
Mutual Funds and FIIs have been increasing their stakes significantly over the last two quarters. They are placing their bets before the crowd arrives.
My Game Plan:
My Analysis: A confluence of a strong technical breakout, leadership-level relative strength, and clear institutional accumulation points to a potential re-rating of the stock.
🎯 Target: I'm looking for an initial move of 35-40%, after which I will trail my stop-loss to ride the trend.
🛡️ Stop-Loss: My risk is defined. I am wrong if the price breaks below ₹242.40.
(As always, this is my analysis for educational purposes. Please do your own research and manage your risk.)

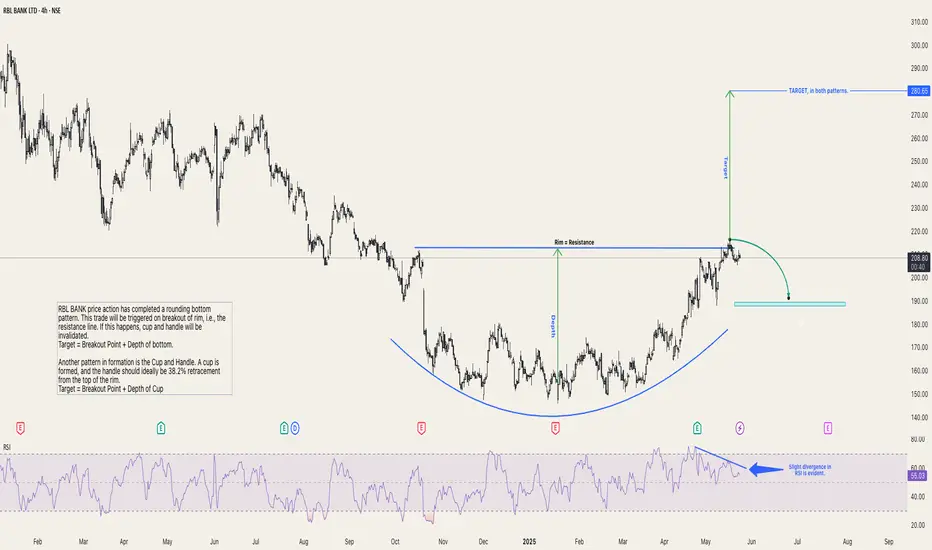
RBLBANK: Bullish pattern in focusRBL BANK's price action has completed a rounding bottom pattern. This trade will be triggered by the breakout of the rim, i.e., the resistance line. If this happens, the cup and handle will be invalidated.
Target = Breakout Point + Depth of bottom.
Another pattern in formation is the Cup and Handle. A cup is formed, and the handle should ideally be 38.2% retracement from the top of the rim.
Target = Breakout Point + Depth of Cup
Trade will be triggered on the breakout of the resistance line trading at around ₹213-₹216
Apno Ka BankRBL BANK -
Incorporated in 1943,RBL Bank is a banking company engaged in providing specialized services under five business verticals namely: Corporate Banking, Commercial Banking, Branch & Business Banking, Retail Assets and Treasury & Financial Markets Operations.
CMP 209
This is just to boost my confidence. No Suggestions for buying.
Disclosure: I am not SEBI registered. The information provided here is for educational purposes only. I will not be responsible for any of your profit/loss with these suggestions. Consult your financial advisor before making any decisions.

RBL Bank Ltd- Range Breakout + Trendline Break!RBL Bank Range Breakout + Trendline Break! 💥🚀
📅 Published on: April 16, 2025
📊 Chart Insight:
RBLBANK has given a dual breakout—piercing above a long-standing descending trendline and breaking out of a rectangle consolidation zone. This combo setup indicates a potential trend reversal or continuation rally from here on.
🔍 Technical Highlights:
🔺 Pattern: Rectangle range breakout + descending trendline breakout
🟪 Consolidation Range: ₹148–₹178 (marked in purple)
📈 Breakout Candle Close: ₹181.57
📊 Volume Surge: 218.23K—strong bullish confirmation
📌 Support & Resistance Levels:
🟢 Immediate Support: ₹178 (top of the rectangle zone)
🟢 Next Strong Support: ₹164 (middle of the rectangle)
🔴 Resistance Levels to Watch:
₹188 (trendline zone retest)
₹198
₹212 (gap fill level)
📈 Trendline Analysis:
Price has broken above the major descending trendline from April 2024 highs.
This trendline had been acting as dynamic resistance and is now a potential trend shifter.
🧠 Trade Idea/Strategy:
💹 Entry: Near ₹178–₹181 (post-breakout retest ideal)
🛑 Stop-loss: Below ₹164
🎯 Targets: ₹188 ➡ ₹198 ➡ ₹212
📍 Visual Indicators Used:
✅ Rectangle drawn to capture sideways accumulation
✅ Trendline from previous highs marking resistance
✅ Volume spike indicating strong buying interest
📘 Note: Multiple timeframe confirmation is advised. Volume and structure align well with bullish bias.
🔔 Disclaimer: Educational post only. Always do your own research or consult with a SEBI-registered advisor

Banks in focus, chart: 4 RBLChart -> RBL Bank Daily
CMP: 183
Good Range to Buy: 178 to 185
Targets: 200, 210, 223, 235
SL: 175 Daily Close
Disclaimer: This is for educational purposes only, not any recommendations to buy or sell. As I am not SEBI registered, please consult your financial advisor before taking any action.

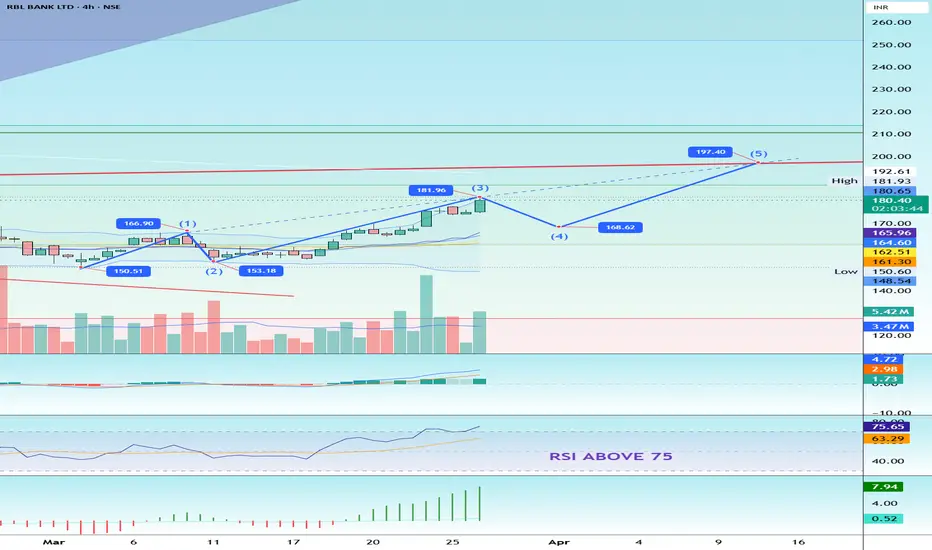
Short term idea on RBLBANK 181>170>197 Using Elliott Wave on 4hBased on Elliott wave and following the trend line we are able to determine that the stock can correct to 170 level and then begin journey towards its 200 DMA and reach a target of 197-200 in April month only.
Overall Trend is Bullish and this 170 will be the moment of lifetime. This stock has a potential for 3.5x in less than 2 years.
RBL BANK TECHNICAL - Monthly RBL Bank, formerly known as Ratnakar Bank Limited, is a private sector bank in India established in 1943. Here are a key technical points about RBL in the chart for your reference based on recent information available

RBL BANK - Sideways to bearish journey aheadAs we can see stock doing sideways journey from past quarter between 160 - 180
Finally trend line has also been broken recently
Now at this point it seems that stock will resist one final time at previous resistance area of 178 - 180
If happens so, it may also try to give a pull back till the trend line or previous support area of 158 - 160
Post that it may trend upside again
Lower time frame confirmation is compulsory for trade
Trade Cautiously !

RBL BANK#RBLBANK
RBLBANK is showing promising momentum,
forming a strong higher highs pattern!
It's looking like a solid buy setup.
Question for you: Will you consider
buying near *175, eyeing a potential target of *450+

RBL BANK FOR 300% UPSIDEtechnically RBL bank is a buy call for upside seen more than 300% to it's lifetime high and is retraced even 45% from its 52 week high.
This Private bank major is below RSI and generating a buy signal on the charts.
Fundamentals are looking good for long term.
Note: Having a notable holding in the entity at various price levels.

Gear for 300 points in RBLBNK: 2.3X possible from 212🚨#StockToWatch
📈Gear for 300 points in #RBLBNK: 2.3X possible🚀
🏷️CMP: 212
👌🏼Book Value: 245
🎯Target according to Pattern: 526
⏳Timeframe: 15 months
🔍Pattern: Inverse Head and Shoulder
💪🏻Strong Support at 206

Wedge pattern Breakout in RBL BANK (Monthly Chart) RBL Bank reached an ATH of 716.4 in May'19 and corrected approximately 90% to reach 74.15 in the month of June 2022. It then took support at lower trend line of the wedge and rose by 255% in 7 months i.e. till Jan'23. Since then the price has been hovering near the upper trend line (resistance) of the wedge.
Risky Traders Entry: Only above 176 (daily closing price)
Safe Traders Entry: above 180 (June month closing)
Stop Loss: 172.5 (daily closing basis)
Fundamentals:
Qtr Revenue grew 20% YoY and Qtr Net Profit grew 37% YoY.
declared Positive results for the last 7 consecutive quarters.
Highest ever revenue of Rs.3170 Cr and Highest ever profit of Rs.271 Cr.
Lowest NPA and Highest Credit to Deposit Ratio.

RBL Bank - Low Risk OpportunityCMP 235 on 28.07.24
The stock price has been traveling in a rising wedge pattern in the last months. This time, again at the lower levels of the wedge. A pink support line is to be noticed too. It has taken support on this line and bounced back 3-4 times. So it seems at multiple support this time.
In the last 2 sessions, the stock has shown some reversal signs with bigger volumes. MACD should also be considered.
If the pattern continues, we may see targets of 260/280/300 in the coming weeks.
Buy levels are between 235 and 225 in split quantity.
Please remember that if the price is sustained below the pink support line, it will bring weakness to the trade setup. One has to start thinking of an exit if trading below the pink line.
Always keep your risk management in your control. Plan some position sizing in these kinds of setups.
This illustration is only for learning and sharing purposes, not trading or investment advice in any form.
All the best.

RBL - BUY BUY BUYRBL BANK (LTP-268)
Another Gem from our Treasury
Many of you have missed rally is PSU Banks like PNB, UCO etc - Now this is your time.
New IMPULSIVE WAVE (Upmove) will start soon (min 50-70%)
Don't let is go
Getting Rich is our Birth Right🙏🙏

RBL BANK - Bullish Swing Reversal with VolumesNSE: RBLBANK is closing with a bullish swing reversal candle supported with volumes.
Today's volumes and candlestick formation indicates strong demand and stock should move to previous swing highs in the coming days.
The stock has been moving along the horizontal support for the past few days which is indicating demand.
One can look for a 13% to 18% gain on deployed capital in this swing trade.
The view is to be discarded in the event of the stock breaking previous swing low.
#NSEindia #Trading #StockMarketindia #Tradingview #SwingTrade

Head and Shoulder in RBL BankStock gives breakout of Head and Shoulder Pattern on weekly timeframe and price is giving breakout, just wait for weekly closing to enter.
Now this stock has the higher chances of moving upwards Best entry price around 190.
CMP : 181
Target : 219
Target 2: 274
Stoploss : 163
This is not a buy or sell call, this analysis is shared for educational purpose.
