Equitus Small Finance Bank: Breakout with volumeNSE:EQUITASBNK shows bullishness because of:
A clear rectangular consolidation brakout
High volume
The daily candle is bullish engulfing with the low touching the bottom of the channel (but still able to pass the mid point, near to top channel)
Trade: Buy above 58, SL: 56, T: 65/68
Sell below: 54, SL: 57, T: 51/48
Rectangle

Alkali- Rounding Bottom PatternNSE:ALKALI 135
1. Chart Formed long Rounding Bottom pattern with 11 years data
2. Price trading inside the Pole and Flag pattern with is above breakout in RB
3. Breakout above the 145. level in the chart
4. Upcoming levels to watch post breakout near 200-260
5. Support near 100-110 level.
#TechnicalAnalysiswithMrChartist

NACL: Rounding Bottom Breakout with volumeNSE:NACLIND is showing bullishness because of:
A 6 months long rounding bottom breakout with very high volume sprout
A recent rectangular breakout.
High volume buildup in last 3 sessions, the build up is increasing.
Trade: Buy above 100, SL: 96, T: 105/107.50

JKTyres: Range BreakoutNSE:JKTYRE is showing a good range breakout with very high volume spout.
The symmetrical triangle as well as rectangular range is broken out with high volume.
Trade: Buy above 199 (today's closing), SL: 188 (today's 61.8% Fib Range), Target: 205, 210 (Higher order Fibs)

IT WILL ALWAYS GIVE RELIANCE Reliance is looking good on weekly chart by breaking falling trendline resistance after long time and gives a positive crossover divergence on MACD indicator too so we can see coming bullishness in this fundamentally strong counter.
Cause of long-:
1- Falling resistance trendline breakout.
2-MACD breakout.

Kirloskar Brothers : Classic NR7 Breakout #KIRLOSBROS showing a text book example of NR7 Breakout with Huge Volumes
>> Good Strength in Stock
>> Good Volume Participation
>> Try to enter at retracement (if any) near safe entry Levels, or else immediately
Happy Trading !!!

17 Years Multiyear Rectangle Consolidation Breakout at RCF 17 Years #Multiyear Rectangle Consolidation #Breakout at #RCF (Rashtriya Chemicals & Fertilizers Ltd) Weekly Chart. Its #Outperformed #Nifty
What Is a Rectangle?
A rectangle is a pattern that occurs on price charts. A rectangle is formed when the price reaches the same horizontal support and resistance levels multiple times. The price is confined to moving between the two horizontal levels, creating a rectangle. The concept of a rectangle is similar to a Darvas Box.
KEY TAKEAWAYS -
1. A rectangle occurs when the price is moving between horizontal support and resistance levels.
2. The pattern indicates there is no trend, as the price moves up and down between support and resistance.
3. The rectangle ends when there is a breakout, and the price moves out of the rectangle.
Some traders like to trade the rectangles, buying near the bottom and selling or shorting near the top, while others prefer to wait for breakouts.
ONLY FOR #educational
NOT SEBI REGISTERED. #LEARNEARN (TRUST YOURSELF)
#nifty50 #sharemarket #BREAKOUTSTOCKS #Multibagger #sharemarket #sharemarketindia #sensex #technicalanalysis #Chartanalysis #headandshoulders #doubletop #doublebottom #parallelchannel #relativestrength
DISCLAIMER: I am not SEBI registered analyst. All posts are for educational purpose only. I am not responsible for your any loss or profit. Consult your adviser before taking any trade. I help people to learn technical analysis & charts reading.

ESCORTS: RANGE BREAKOUT WITH HUGE VOLUMEESCORTS: RANGE BREAKOUT WITH HUGE VOLUME
Buy above 2208, Can achieve 2250/275/300 in short term
Intraday : Keeping Trailing SL for max gains
Disclaimer: Im not SEBI registered, Contact your financial advisor before any investment.

SHERVANIBOX PATTERN / RECTANGLE PATTTERN
32 months of consolidation happening (from March 2020) in the range of 186_419 after a Break Out Retest. Seems like stock is waiting for some big trigger.Can blast one sided, once it sustains or MCB above 419.
Buy on sustain/MCB above 419 | WCBSL 264 | Tgt 550 / 650 / 750+
(or)
Buy around 340_270 | WCBSL 170 | Tgt 550 / 650 / 750+

6.9 Years Multiyear Rectangle Consolidation Breakout at JTEKT6.9 Years #Multiyear Rectangle Consolidation #Breakout at #JTEKTINDIA (JTEKT India Ltd) Weekly Chart. Its #Outperformed #Nifty.
What Is a Rectangle?
A rectangle is a pattern that occurs on price charts. A rectangle is formed when the price reaches the same horizontal support and resistance levels multiple times. The price is confined to moving between the two horizontal levels, creating a rectangle. The concept of a rectangle is similar to a Darvas Box.
KEY TAKEAWAYS -
1. A rectangle occurs when the price is moving between horizontal support and resistance levels.
2. The pattern indicates there is no trend, as the price moves up and down between support and resistance.
3. The rectangle ends when there is a breakout, and the price moves out of the rectangle.
Some traders like to trade the rectangles, buying near the bottom and selling or shorting near the top, while others prefer to wait for breakouts.
ONLY FOR #educational
NOT SEBI REGISTERED. #LEARNEARN (TRUST YOURSELF)
#nifty50 #sharemarket #BREAKOUTSTOCKS #Multibagger #sharemarket #sharemarketindia #sensex #technicalanalysis #Chartanalysis #headandshoulders #doubletop #doublebottom #parallelchannel #relativestrength
DISCLAIMER: I am not SEBI registered analyst. All posts are for educational purpose only. I am not responsible for your any loss or profit. Consult your adviser before taking any trade. I help people to learn technical analysis & charts reading.

Consolidation BreakoutTataconsumer - showing sideways consolidation from last month. Now it gives breakout from the last one-month range forming a Bullish candle i.e. Engulfing or like a Marubozu candlestick pattern with good volume spurt, it may touch 850-860 level which is next resistance level .
Disclaimer - All updates/posts/discussions are only for education and learning purpose only. not provide any tips/recommendations/advice.

8 Years Multiyear Rectangle Consolidation Breakout at ACCELY8 Years #Multiyear #Rectangle Consolidation #Breakout at #ACCELYA (Accelya Solutions India Ltd) Weekly Chart. Its #Outperformed #Nifty.
BSE: 532268 / NSE : ACCELYA
What Is a Rectangle?
A rectangle is a pattern that occurs on price charts. A rectangle is formed when the price reaches the same horizontal support and resistance levels multiple times. The price is confined to moving between the two horizontal levels, creating a rectangle. The concept of a rectangle is similar to a Darvas Box.
KEY TAKEAWAYS -
1. A rectangle occurs when the price is moving between horizontal support and resistance levels.
2. The pattern indicates there is no trend, as the price moves up and down between support and resistance.
3. The rectangle ends when there is a breakout, and the price moves out of the rectangle.
Some traders like to trade the rectangles, buying near the bottom and selling or shorting near the top, while others prefer to wait for breakouts.
ONLY FOR #educational
NOT SEBI REGISTERED. #LEARNEARN (TRUST YOURSELF)
#nifty50 #sharemarket #BREAKOUTSTOCKS #Multibagger #sharemarket #sharemarketindia #sensex #technicalanalysis #Chartanalysis #headandshoulders #doubletop #doublebottom #parallelchannel #relativestrength
DISCLAIMER: I am not SEBI registered analyst. All posts are for educational purpose only. I am not responsible for your any loss or profit. Consult your adviser before taking any trade. I help people to learn technical analysis & charts reading.

Multiple bullish signals 1. Trend line support
2. Bounce from support zone
3. Short term trend line breakout
4. Retesting trend breakout levels
5. Rectangle pattern breakout
Targets previous swing highs
Sl previous swing low

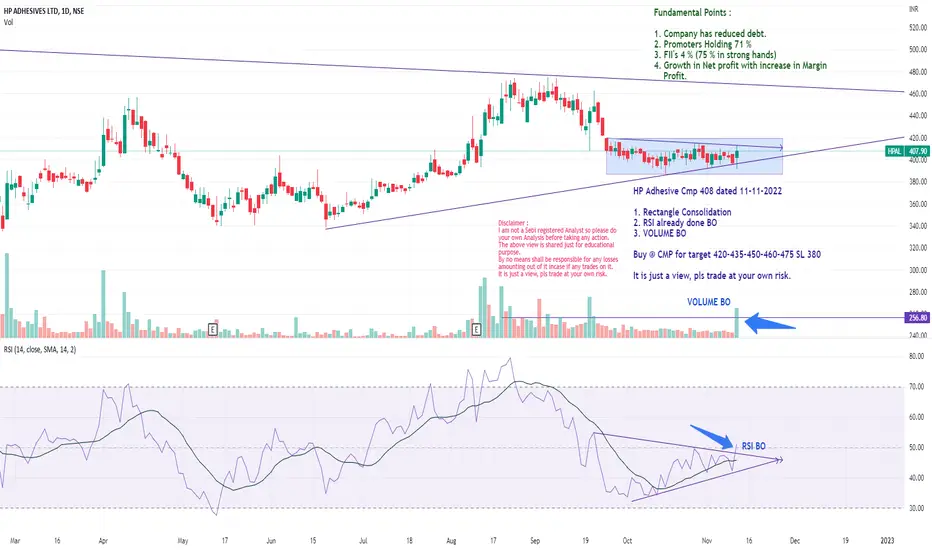
HP Adhesive Cmp 408 dated 11-11-2022 FUNDAMENTAL & TECHNICALVIEWHP Adhesive Cmp 408 dated 11-11-2022
Analysis based on FUNDAMENTALS & TECHNICALS
1. Rectangle Consolidation
2. RSI already done BO
3. VOLUME BO
Buy @ CMP for target 420-435-450-460-475 SL 380
Fundamental Points :
1. Company has reduced debt.
2. Promoters Holding 71 %
3. FII's 4 % (75 % in strong hands)
4. Growth in Net profit with increase in Margin Profit.
Disclaimer :
I am not a Sebi registered Analyst so please do your own Analysis before taking any action.
The above view is shared just for educational purpose.
By no means shall be responsible for any losses amounting out of it incase if any trades on it.
It is just a view, pls trade at your own risk.
HDFC Bank Daily Timeframe AnalysisHDFC Bank getting ready for Breakout
It has formed Narrow range of last 8 sessions and Inside bar candles in last 3 sessions
Making LH - LH structure
Consolidating above last 88 days support zone and sustaining after dynamic resistance (trendline) breakout and formed NR7
If Breakout above 1468 and sustained can go long with SL 1445 and momentum targets of 1487,1513,1540

Tci stock bullish from support TRG 800Tci stock has Taken good support from trend line .
Stock has high probability of Given ROI of 15-18 %

Kotak Mahindra Bank I have observed that Kotak Mahindra Bank is in weekly range of 1650-2000 since two years. Bank Nifty has shot-up up to 71 percent in last two years. Kotak Mahindra Bank is one of the fig four bank in major four private banks namely HDFC, ICICI, Axis and Kotak.
Still kotak mahindra bank is within the range. If, Kotak Mahindra Bank breaks range of 2000 and moves above, we will see fantastic rally in such stock.

Banknifty view for 10 Nov ExpiryNSE:BANKNIFTY is Trading in a narrow price range from date 24 nov to 4 nov.
41,500 is crucial level for banknifty. Its a strong resistance or supply zone. Banknifty is trying to break this resistance. On Nov 1 it succeed to break resistance but not able to sustain. Also this level is tested for multiple times.
On the other hand, 40850 is strong support. 2 times banknifty took support from that level and gone upside.
Banknifty is curretly neither in Up trend nor in Down trend. Its just moving in between 41500 - 40850. we can say sideways.
On longer time frame like daily or weekly we can clearly see an up trend. So if we get banknifty around 40850 and gives us a bullish confirmation we will think for Long (Bullish view) for target of 41100,41300 & 41500.
If Banknifty breaks 41500 level and sustain above that we will surely go for Long (Bullish view) for target of 41700, 41800 & 42000.
In worst case banknifty will break its support level 40850 and sustains below we can go for short(Bearish view) for target of 40600, 40500,40300.
If we think logically, most of the major banks NSE:SBIN , NSE:AXISBANK , NSE:HDFCBANK , NSE:ICICIBANK having good quarterly earning report. FII have started buying recent. So we can expect a bullish move for upcoming days. But, we are close to all time high.
Disclaimer : I am not SEBI registered analyst. Do your own analysis before taking trade. I am not responsible for your profit or loss.

Tata Motors : Range BreakoutTata motors has given a beautiful range Breakout and also retest done.
can show good imminent upside movement
capture Quick 5/10/15% movement.

BESTAGROBOX PATTERN / RECTANGLE BREAKOUT
Buy @ cmp & in dips till 1440 | WCBSL 1365 | Tgt 1850 / 1950+
In past, stock moved more than 550 points twice after the BOX / RECTANGLE BREAKOUT. Now again gave breakout of same pattern. Price Action indicates stock can move 450_550+ points from the Breakout level.

LEVEL TO SEE FOR DEVYANI INTERNATIONNSE:DEVYANI
There is box is fromed on 4 hours chart pattern
If it breaks there is chance of great movenment both side
This is foe educational purpose

EKC ready to breakout ! follow for more 🙏ekc is ready for break ou buy with cinirmation after retest of stock and ready to profits. follow for more such technical analysis

MUTHOOTFIN Consolidation from 3 months !!NSE:MUTHOOTFIN
#NSE:MUTHOOTFIN Consolidation from last 3 months, Breakout sustainability may give good momentum !!
