ITI Technically looks Good. Potential stage 2 Underway.📈 Stock Analysis: Indian Telephone Industries Limited (ITI) - Daily Chart 📊
🟪Setup Overview:
➡️Entry Zone: ₹408.65
➡️Current Price: ₹379.20
➡️Stop Loss: ₹323.70 (Closing Basis)-Deep SL. Manage risk and position size properly.
➡️Target 1: ₹501.20
➡️Probable Long-Term Target: ₹718.85
🟪Key Observations:
➡️Volume Spurt: Recent bullish candles are accompanied by notable volume spikes, indicating accumulation and strong buying interest.
➡️Range Breakout in Progress: The stock has been consolidating in a tight range for several months and is now showing signs of breaking out above the upper boundary.
➡️Technical Strength: The breakout aligns with a well-defined risk-reward setup.
Higher volume near resistance increases the probability of a sustained move.
➡️Risk-Reward Ratio: With the stop-loss defined at ₹323.70 (closing basis), this setup offers a favorable risk reward for positional traders.
➡️Sectoral Support: ITI is part of a growing sector with robust demand potential, which adds a fundamental tailwind to this technical setup.
🟪Strategy:
A decisive close above the Entry Zone (₹408.65) could trigger the next upward leg toward Target 1 (₹501.20).
Long-term investors can look for a potential rally toward ₹718.85 if the trend sustains.
Maintain strict discipline with the stop-loss to manage risk effectively.
⚠️Fundamentally very weak.
⚠️Still we are in a sell-on-rise market.
⚠️High Chances of breakouts failing. Once again reiterating the importance of risk management.
📢 Disclaimer:
This analysis is for educational purposes only and should not be considered investment advice. Please do your own research before making any trading or investment decisions. 🙌
Rectangle

2 years breakout coming soon in JINDAL WORLDWIDEWe can see the price is consolidation in a fixed range since 2023, a breakout 474 will likely take the price to 820 levels as per advance technical analysis.
Jindal Worldwide Ltd., incorporated in the year 1986, is a Small Cap company (having a market cap of Rs 8,802.85 Crore) operating in Textiles sector.
Jindal Worldwide Ltd. key Products/Revenue Segments include Textiles, Income from Project Development, Export Incentives and Other Operating Revenue for the year ending 31-Mar-2024.
For the quarter ended 30-09-2024, the company has reported a Consolidated Total Income of Rs 571.35 Crore, up 15.67 % from last quarter Total Income of Rs 493.94 Crore and up 45.65 % from last year same quarter Total Income of Rs 392.27 Crore. Company has reported net profit after tax of Rs 17.33 Crore in latest quarter.

Greaves Cotton Cmp 252 Rectangle BOGreaves Cotton Cmp 252 dated 10-12-2024
Weekly Chart (Positional)
1. Rectangle Bo @ 250 (done)
2. Price Rise with Volumes
3. RSI BO
Buy above 255 SL 200 target 260-280-300-325-350-375-400
It is just a view, please trade at your own risk.

EICHERMOTORS RECTANGLE BREAKOUT Eichermotors breaking a rectangle box on
weekly basis with volume spike
macd crossover this week,bullish rsi
#target 6000 after breaking 5450
#positionaltrading
NO BUY/SELL RECOMENDATION

A good example of shakeout and then bullish breakout1. Prior uptrend on Day TF with 200 SMA.
2. Sideways for arounf 3 weeks and have given decisive breakout today with higher volume
3. Note that after few days of sideways, it has dipped for couple of days. This is shakeout to eliminate weak buyers in the market. Hence, strong buy on today's breakout.
4. Buy above high of day candle and SL below the same candle (today).
5. Trail the profits with 9 EMA.

Ashoka Buildcon. Breakout and retest done-Broke out of a base and retest done.
-Volumes are improving
-Trading above Key DMAs.
-Good ROE and ROCE
Keep this on your radar.
SL is deep so please position size accordingly and do not put everything in one go. Fine-tune the SL and Target at your discretion.

Jubilant Pharma-Consolidation breakout can give good returnsJubilant pharmova has been trading in a big range since last few years.
Stock has managed to close above the resistance and has also retested the breakout.
Stock has potential to fly from this levels.
Keep stock in watchlist. A nifty500 stock and hence can be relatively safer option.
Not a recommendation.

Infosys Ltd. Watch for Darvas Box Breakout.
📉 Current Price Action:
Infosys is consolidating within a Darvas Box pattern, trading close to a 3-year-old resistance zone near ₹1,953.7. The stock is forming a base after a pullback, suggesting potential for a breakout.
📈 Trade Setup:
Entry: ₹2,002.1 (above the resistance zone)
Stop-Loss (SL): ₹1,707.6 (on a closing basis)
Target: ₹2,335.8 (medium-term potential)
🚩 Key Observations:
The stock is holding above its Key DMAs, indicating near-term strength.
Consolidation near a key resistance signals a build-up for a breakout, but volumes need to support the move.
If the breakout fails, watch for price action near the lower support zone (₹1,707) for signs of reversal.
⚠️ Caution:
Wait for a confirmation candle with good volume before entering.
Avoid premature entries as the stock could continue consolidating within the current range.
Nifty IT Sector Context:
Nifty IT is showing signs of base formation after a significant pullback. A sectoral breakout above 44,317 could drive momentum across IT stocks, including Infosys.
💡Follow the price action and adjust your strategy based on market cues. A clean breakout could lead to strong upward momentum.

GARUDAGARUDA showing very good strength 1st time in last 5 sessions since listing. Market participation also increased. 110 is new support area. So as long as its above 110 level, it may continue momentum ride from hereon.

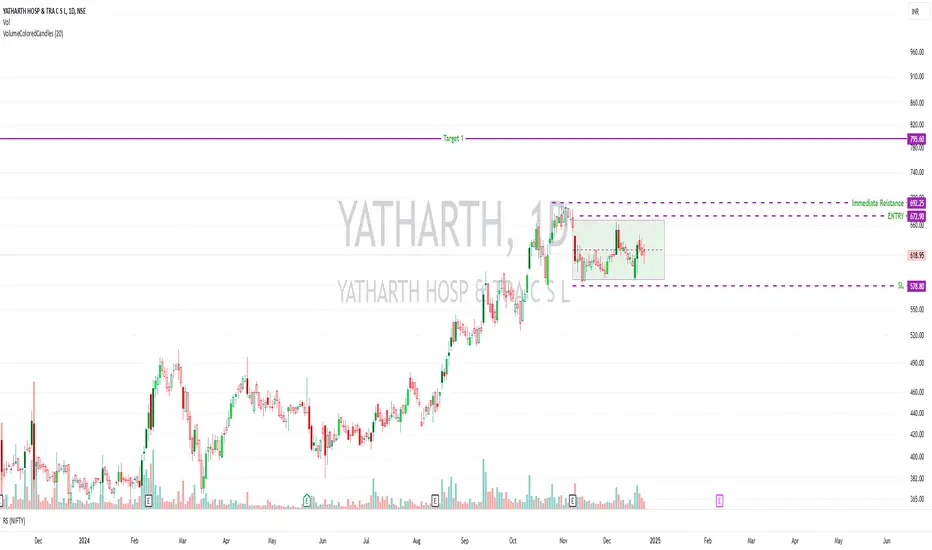
Yatharth Consolidation Breakout in Progress?? Some Insights...⏺️Technical Analysis
⏹️S napShot
Entry: 672.9
SL: 578.8
Positional Target 795.6
692.25 is an immediate resistance, breakout from this level with volume and wide range candle can be considered for further addition or fresh entry. Exercise caution since overall market is bearish and sell on the rise.
✅Detailed Analysis
⏹️Price Action: The stock is currently in a consolidation phase, with strong support at ₹578.80 and resistance at ₹692.25.
⏹️Entry is suggested at ₹672.90, with an immediate target of ₹795.60. If the resistance at ₹692.25 is broken with significant volume, it may signal the start of a new uptrend.
⏹️Stop-loss is placed at ₹578.80 to protect capital in case of adverse price movement.
⏺️Volume & Momentum: The price action indicates the stock has strong buyer interest near the lower end of the consolidation range.
⏺️The Relative Strength (RS) against the Nifty shows a gradual upward trend, indicating that the stock is outperforming the market.
✅Fundamental Analysis
⏺️Key Metrics:
⏹️Market Cap: ₹5,314 Crore – A mid-cap company in the growing healthcare sector.
⏹️Current Price: ₹619.
⏹️P/E Ratio: 41.1 – The stock is trading at a higher valuation compared to the industry average, suggesting strong growth expectations. However, this should be justified by robust revenue and profit growth.
⏹️Book Value: ₹109 – The Price-to-Book ratio is ~5.67, indicating that the stock is priced significantly above its net assets.
⏹️ROCE (Return on Capital Employed): 23.9% – A strong indicator of efficient capital utilization, well above the 15% benchmark for quality companies.
⏹️ROE (Return on Equity): 21.7% – This shows the company is generating significant returns for shareholders.
⏹️Dividend Yield: 0.00% – Indicates the company is likely reinvesting profits into growth rather than paying dividends.
⏺️Sector Analysis:The Indian healthcare industry is growing rapidly, driven by increasing demand for medical services, rising incomes, and expanding medical insurance coverage.
Yatharth Hospitals is positioned to benefit from this growth, especially in urban and semi-urban areas.
⏺️ Strengths: Strong Profitability Ratios: Both ROCE and ROE are impressive, reflecting efficient operations and shareholder returns.
⏺️ Signalling Growth Potential: With no dividend payouts, the company is focused on reinvestment and expansion, signalling aggressive growth plans.
⏺️ Valuation Concerns: While the company shows strong operational metrics, the high P/E ratio suggests the market is pricing in significant growth. Investors should monitor quarterly earnings to ensure growth expectations are met.
⏺️ Risk Factors: High valuation could lead to short-term volatility if earnings do not meet market expectations.
Rising competition in the healthcare sector and regulatory risks (like price caps on services) could impact margins.
⏺️Trade Plan
Positional: For traders, a breakout above ₹692.25 with volume provides an opportunity for a quick rally toward ₹795.60.
Maintain a stop-loss at ₹578.80 to minimize risk.
⏹️ Long-Term: The company has strong fundamentals and operates in a growing sector, making it a promising long-term investment.
However, given its high valuation, investors should ideally wait for dips or monitor quarterly results to ensure consistent performance before making significant allocations. Overall market is sell on the rise and bearish. So risk management is the key.
Anand rathi wealth nearing consolidation endAnand rathi wealth is a fantastic wealth compounder fundamental stock. Company has posted more than 30% growth in sales and profit in Q2. Consolidation will breakout soon with a potential of 50%.

Emmbi Industries Ltd Technically checks many boxes.Emmbi Industries Ltd.
📅 Timeframe: Daily Chart
Technical Observations
1. Cup and Handle Breakout:
2. Inverse H&S
3. Base Breakout
The stock has formed a classic Cup and Handle and an inverse Head and Shoulders pattern, which is a bullish continuation setup.
3. Three White Soldiers:
Post-breakout, the stock formed Three White Soldiers (three consecutive bullish candles), a strong bullish indicator.
Fundamental Snapshot
💼 Market Cap: ₹300 Crores (Small Cap).
📊 Current Price: ₹169.
📈 High/Low: ₹172 / ₹87.6 (52-week range).
📚 Book Value: ₹104 (Price to Book Ratio: ~1.63).
📉 PE Ratio: 29.6 (relatively higher compared to industry standards).
💸 Dividend Yield: 0.18% (low yield).
📊 ROCE: 8.43% (moderate efficiency).
📈 ROE: 6.03% (average return for shareholders).
Key Levels to Watch
-Entry Point: ₹172 or wait for multiyear Breakout level
175.
-Stop Loss (SL): ₹129.73 (Below the handle and
consolidation support).
🎯 Targets:
All-Time High (ATH): ₹262.45 (Medium-to-long-term target).
Strengths of the Setup
✅ Volume Confirmation:
Breakout backed by rising volumes, indicating strong market interest.
✅ Trend Alignment:
Stock is trading well above the 50-day and 200-day moving averages, supporting the bullish trend.
✅ Healthy Consolidation:
The long consolidation before the breakout reduces the chance of a false move.
Risks and Considerations
⚠️Microcap Company.
⚠️ Valuation Concerns:
PE ratio (29.6) is on the higher side, indicating the stock might be overvalued compared to peers.
⚠️ Dividend Yield:
At 0.18%, the dividend yield is minimal, which may not attract dividend-seeking investors.
⚠️ Broader market conditions (e.g., Nifty 50, Nifty 500) should support bullish sentiment 📉.
Trading Plan
📌 Buy Above: ₹172.0 or wait for breakout of 175
📌 Stop Loss (SL): ₹129.73 (Strictly on closing basis)
📌 Targets:
Medium-Term: ₹262.45 🎯
📊 Watch for a pullback retest of ₹159.00 with rising volumes. It can be an excellent re-entry or adding opportunity.
Do not forget to position size since the SL is extremely Deep. Risk management is the key here. Market conditions are bad and unpredictable. Please excuse Ttypos if any.

OLA ELECTRIC MOBILITY: Consolidation After Channel Breakout.✅ Falling Channel Breakout: The stock recently broke out of a steep falling channel, indicating a potential trend reversal.
✅ Consolidation Above Support: Currently consolidating between ₹92-₹103, forming a solid base for the next potential move.
✅ Volume Spike on Breakout: Significant volume was observed during the breakout phase, adding conviction to the bullish bias.
🎯 Key Levels to Watch:
Entry: ₹103.30 (Breakout confirmation above the consolidation range)
Stop Loss: ₹88.53 (Closing Basis)
Target 1: ₹123.37
Target 2: ₹158.16
💡 Risk/Reward Analysis:
Risk: ~15% (₹103.30 to ₹88.53)
Reward: ~19% for Target 1, ~53% for Target 2
📌 Trade Setup: Wait for a breakout above ₹103.30 with volume to confirm entry. Ensure strict risk management to protect your capital.
Caution: Market volatility may influence the stock's movement. Always align trades with your investment strategy and risk tolerance.
#OlaElectric #BreakoutStocks

SHARDACROP: Breakout Alert!
From our Previous entry( which I posted here) Stock clocked 23%. Now it is:
✅ Consolidation Above Breakout Zone: Healthy consolidation near ₹879, indicating strength and accumulation.
✅Base on Base Formation
✅ Volume Confirmation: Significant volume during the breakout phase, validating bullish sentiment.
✅ Support from Moving Averages: Price trading above the 50 and 200 DMAs, confirming a bullish bias.
🎯 Key Levels:
Entry Zone: ₹-879-880
Medium-Term Target: ₹1,050-1,100
Stop Loss: ₹773 (Closing Basis)
💡 Risk/Reward:
Risk: ~11.8%
Reward: ~20%-22%
📌 Note: Always maintain proper risk management and conduct your own research before taking any position.

Rudrabhishek Enterp Ltd (REPL) Breakout with Huge Volume⚠️Risky Bet.
1. Early Entry above 264. SL 215. A retest of 240 levels is possible. Any signs of retest and reversal are an entry opportunity. Retest Level. 240
Or
2. Wait for a fresh breakout above 282 for an entry. SL Below the breakout candle.
These are my views and my way of doing things. Please do your due diligence and research. Do not jump into a trade with a huge allocation based on Tips.
Reasons to go Long:
✅Huge Volume 4x volume compared to previous
sessions.
✅Wide Range clean candle
✅Broke out of Darvas Box
✅Trading right below a 3-year-old resistance. Hence
the early entry.
✅Technically Good.
❗️Microcap/Small cap company.
❗️Fundamentally Weak.

Maharashtra Seamless- Double Bottom & Rectgular pattern BreakoutMaharashtra Seamless has given a double bottom and rectangular breakout with big volumes. I am expecting this stock to move towards our targets. Other factors:
1. From a downward channel, the stock has started its reversal giving a double bottom and rectangular pattern breakout.
2. Volume Candle - The breakout candle is big volume candle
3. The 20 EMA is crossing 50 EMA is a sign of bullishness
4. Fundamentally:
- 55% market share share in seamless pipes
- Zero Debt
- 850cr of capex in till FY 26
- consistent profitability
This stock given above parameters should move towards our targets.
Keep following @cleaneasycharts as we provide Right Stock at Right Time at Right Price!!!
Cheers!!!

RECTANGEL PATTERN - ULTRATECH CEMENTUltratech Cement chart is on the verge to break the Rectangle Resistance.
Previous Resistance zone turned into the support area.
We can see now good up move in this stock.
Let us see.

RECTANGLE PATTERN- DOMSDoms Industries has formed the Rectangle Pattern.
Previous resistance turned into the support. Now it has formed new resistance and now trying to take rest near high. If it breaches the trendline with good volume, shall go long.
Let us see.

CHALET 1D1. Pattern Breakout: Ascending triangle breakout on the daily chart.
2. Volume Confirmation: High volume (6.16M) supports the breakout.
3. Price Action: Current price at ₹1,013.85, up 9.28%.
4. Resistance Turned Support: Previous resistance at ₹900 now acts as support.
5. Target Projection: Potential upside target around ₹1,100 based on the breakout.
6. Trend: Strong bullish momentum indicating trend continuation.

Dhani Services Ltd. Based on Rectangle Pattern Breakout
1. Pattern Analysis
- Rectangle Pattern:
- Timeframe: 2 Years
- Description: The stock has been consolidating within a rectangle pattern, with a well-defined resistance at ₹75 and support at ₹40. This prolonged sideways movement indicates accumulation and a potential buildup for a significant move.
- The breakout above ₹75 marks the end of the consolidation phase and the start of an upward trend, confirming a bullish breakout.
2. Volume Analysis
- Volume Behavior:
- During the consolidation phase, volume remained low, which is typical for a rectangle pattern.
- A notable volume spike during the breakout, as seen recently, signifies increased market participation and validates the breakout.
3. Price Action Analysis
- Resistance Levels:
- ₹75: The previous resistance and breakout level.
- ₹90–₹100: Immediate target zone based on historical price action.
- Support Levels:
- ₹60: Potential retest zone after the breakout.
- ₹40: The lower boundary of the rectangle, serving as the final support.
- Candlestick Behavior:
- The breakout was marked by a strong bullish candlestick with a close near its high, indicating momentum.
- Recent higher highs and higher lows further confirm bullish price action.
4. Validation of Bullish Signal
- The breakout above ₹75 is supported by a clear volume spike, showing increased demand.
- The long consolidation period adds reliability to the breakout, as prolonged patterns tend to yield stronger moves.
5. Target Setting
- Rectangle Pattern Target:
- Height of the rectangle = ₹75 - ₹40 = ₹35.
- Target = ₹75 + ₹35 = ₹110.
- Incremental Targets:
- Target 1: ₹90 (+20% from ₹75).
- Target 2: ₹110 (+46% from ₹75).
6. Entry and Stop Loss
- Entry Levels:
- Primary Entry: Above ₹75 after the breakout.
- Pullback Entry: Near ₹60 if the stock retests the breakout level.
- Stop Loss:
- Place a stop loss at ₹60, below the potential pullback zone.
7. Trade Setup Summary
- Entry Levels:
- Above ₹75 for momentum traders.
- Near ₹60 for a pullback entry.
- Targets:
- Target 1: ₹90 (+20%).
- Target 2: ₹110 (+46%).
- Stop Loss: ₹60.
8. Final Notes
Dhani Services Ltd. has successfully broken out of a 2-year rectangle pattern, with strong volume confirming the breakout. The long-term consolidation suggests that the breakout has significant potential to drive the stock higher, making it an attractive opportunity for traders. Close monitoring of price action around ₹75 and ₹60 is recommended for entry and to manage risk effectively.
DLong

Breakout Soon Stock- Sastasundar Ventures Limited [SASTASUNDR
1. Pattern Analysis
- Rectangle Pattern (10 Months)
- The chart showcases a well-defined Rectangle Pattern, a consolidation phase that has lasted for 10 months.
- The upper boundary of the rectangle is at ₹372, which acts as a resistance level, while the lower boundary is near ₹280, serving as strong support.
- The price is attempting to break out of the rectangle, with a potential move higher if the breakout sustains.
2. Volume Analysis
- Volume and Price Action
- Significant volume spikes are observed during recent price movements, especially during the breakout attempt.
- This increase in volume validates the breakout signal, suggesting strong buying interest.
- The earlier accumulation phase within the rectangle pattern also exhibited gradual volume buildup, indicating institutional participation.
3. Price Analysis
- Current Price Action
- The stock closed at ₹372, up 6.23% in the last session, indicating strong bullish momentum.
- The breakout from the rectangle is accompanied by sharp price action, further confirming the bullish trend.
- Candlestick Patterns
- Recent bullish candlesticks with long bodies and minimal wicks highlight sustained buying pressure near resistance levels.
4. Validation of Bullish Signal
- Breakout Confirmation
- A decisive close above ₹372 on high volume confirms the rectangle breakout, signaling the continuation of the uptrend.
- Sustaining above ₹372 in the coming sessions will be crucial for validating the bullish move.
- Key Levels
- Support Levels: ₹280 (rectangle base) and ₹320 (midpoint of rectangle).
- Resistance Level: ₹372 (breakout level).
5. Entry Point Determination
- Recommended Entry: A buy signal is triggered if the stock sustains above ₹372 with continued volume support.
6. Target Setting
- Pattern Target
- The height of the rectangle (~₹92, from ₹280 to ₹372) is added to the breakout level (₹372).
- Target Price: ₹464.
7. Stop Loss Placement
- Recommended Stop Loss: Place the stop loss at ₹340, slightly below the breakout level, to protect against false breakouts.

Polizybazar broke out of a consolidation. Looks good positionall It just broke out of consolidation. Looks good positionally. If 1968 is broken then can add further or look for fresh entry.
The market is yet to give a clear indication of a reversal. So please trade carefully. The chart shared is only for educational purposes.
Risk: 12.4%
Reward: 24.6%
RR: 1:2

Zen Technologies. Keep both your eyes on and keep it peeled. For:
- Darvas Box
-Vcp
-C&H
-Potential Stage 2 Breakout.
This is apt as a positional trade hence the SL is deep. Add 30-50% at breakout and add the remaining after a retest.
Please study the chart and do your research. Please position the size properly since the SL is deep.
