Fresh Food, Fresh EPS: FRPT Surprises Wall StreetThe Redoubling is my own research project on TradingView, which is designed to answer the following question: How long will it take me to double my capital? Each article will focus on a different company that I'll try to add to my model portfolio. I'll use the close price of the last daily candle on the day the article is published as the initial buy limit price. I'll make all my decisions based on fundamental analysis. Furthermore, I'm not going to use leverage in my calculations, but I'll reduce my capital by the amount of commissions (0.1% per trade) and taxes (20% capital gains and 25% dividend). To find out the current price of the company's shares, just click the Play button on the chart. But please use this stuff only for educational purposes. Just so you know, this isn't investment advice.
Here’s a detailed, structured company overview for NASDAQ:FRPT (Freshpet, Inc.) based on its financial state:
1. Main areas of activity Freshpet, Inc. is a U.S.–based pet food manufacturer focused on producing and marketing fresh, refrigerated meals and treats for dogs and cats. Its core business spans the development, manufacturing, and distribution of natural, minimally processed pet foods under its own brand names, leveraging a proprietary refrigerated distribution network in grocery, pet‑specialty, and other retail channels across North America and Europe.
2. Business model Freshpet generates revenue by selling pet food products directly to retail partners, including grocery chains, pet stores, mass merchants, club stores, and e‑commerce platforms. Its business model is B2B2C: it manufactures products and sells them through retailers who then sell to pet owners. The company emphasizes brand loyalty and repeat purchases via its high‑quality, fresh food offerings, which require refrigeration and are positioned at a premium compared to traditional dry or canned pet food.
3. Flagship products or services Freshpet’s principal offerings include refrigerated dog food, cat food, and pet treats. Products are marketed under the Freshpet brand, with additional treat lines like DogNation and Dog Joy. These items are designed around fresh meat, vegetables, and fruits without preservatives or artificial additives, and are sold in forms such as meals, rolls, and tubs.
4. Key countries for business The company is primarily active in the United States and Canada, where it has the largest retail presence. It also distributes products in Europe, expanding its footprint beyond North America. Retail availability spans multiple channels, including mass, club, grocery, and specialty pet outlets.
5. Main competitors Key competitors stem from both traditional pet food and fresh/natural brands:
Blue Buffalo (General Mills) and Hill’s Pet Nutrition (Colgate‑Palmolive) in premium pet food.
Smaller fresh/natural pet food brands like The Farmer’s Dog, Ollie, and Nom Nom, which often sell direct‑to‑consumer.
Broader food companies like Vital Farms, Utz Brands, Lamb Weston, etc., operate in the wider consumer food sector but overlap competitively in specific product categories.
6. External and internal factors contributing to profit growth External factors:
Strong consumer trend toward pet humanization and premium quality pet food, which supports demand for fresh, healthy options.
Expanding pet ownership and rising pet care spending, especially in North America.
These trends create opportunities for Freshpet to grow its market share and expand retail presence.
Internal factors: Unique refrigerated product positioning and brand loyalty, differentiating it from conventional pet food.
Strategic retailer partnerships and proprietary refrigerated distribution units, enhancing product visibility and repeat purchases.
Operational expansion and marketing focused on health‑conscious pet owners, enabling scalable growth in existing and new markets.
7. External and internal factors contributing to profit decline External factors: Economic pressures and shifts in consumer behavior, with tighter household budgets potentially reducing premium purchases.
Growing competition from major food companies entering the fresh pet food space, e.g., General Mills expanding Blue Buffalo into fresh offerings.
Internal factors:
Dependency on refrigerated logistics increases cost and complexity relative to shelf‑stable pet foods.
Slower growth in certain segments (e.g., cat food) might limit broader adoption as consumer preferences shift.
8. Stability of management Executive changes over past 5 years:
Freshpet’s executive leadership includes CEO Billy Cyr, with recent activity in board and senior management roles, reflecting focused leadership continuity in executing growth strategies.
Impact on corporate strategy and culture:
Management continuity has supported a consistent focus on premium product innovation, refrigerated distribution infrastructure, and brand expansion, contributing to long‑term strategic consistency and strengthening market positioning.
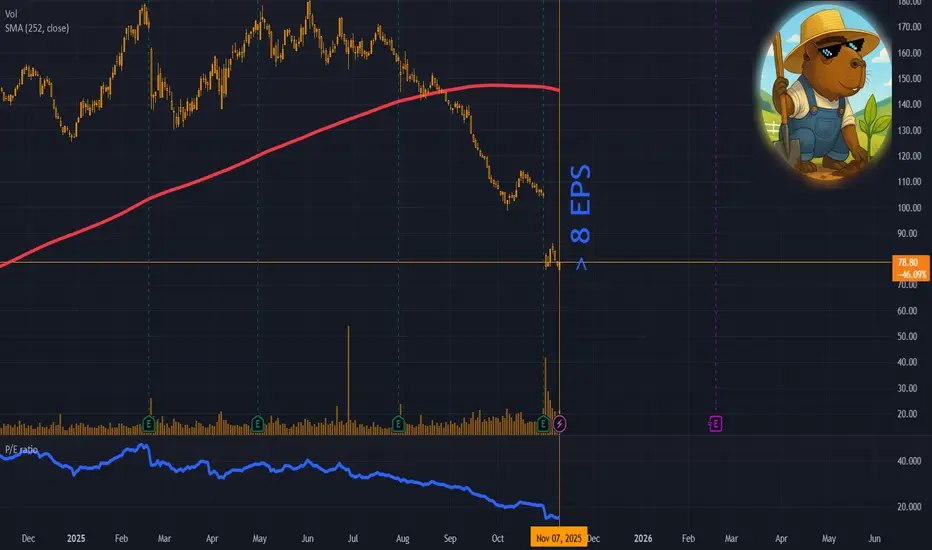
An analysis of business conditions indicates that earnings per share are currently growing above analysts' consensus forecasts amid steady long-term revenue growth, while performance and financial stability indicators such as accounts receivable turnover and debt-to-revenue ratio appear strong, confirming high-quality operational management and a healthy balance sheet structure. Cash flows from operating, investing, and financing activities are assessed as stable, indicating the company's balanced ability to generate and allocate capital. Among the indicators of medium priority, the steady long-term growth in return on capital and gross margin supports the picture of stable profitability, the achieved growth in the operating expense ratio reflects improved cost control, and strong values for supplier payment terms, inventory-to-revenue ratio, and current liquidity confirm reliable working capital management; at the same time, the lack of progress in interest coverage remains the only limiting factor that does not change the overall positive assessment. With a P/E ratio of 27, which is considered acceptable, the current valuation appears reasonable given the moderately stable growth profile. No critical news has been identified that could jeopardize the stability of the business or lead to a risk of insolvency. Considering a diversification coefficient of 20 and a deviation of the current share price from its average annual value of more than 4 EPS, a decision was made to invest 5% of capital in this company at the closing price of the last daily bar, reflecting a balanced and conservative approach to the position within a diversified portfolio.
Redoubling

Carabao: The Thai march goes onThe Redoubling is my own research project on TradingView, which is designed to answer the following question: How long will it take me to double my capital? Each article will focus on a different company that I'll try to add to my model portfolio. I'll use the close price of the last daily candle on the day the article is published as the initial buy limit price. I'll make all my decisions based on fundamental analysis. Furthermore, I'm not going to use leverage in my calculations, but I'll reduce my capital by the amount of commissions (0.1% per trade) and taxes (20% capital gains and 25% dividend). To find out the current price of the company's shares, just click the Play button on the chart. But please use this stuff only for educational purposes. Just so you know, this isn't investment advice.
Here is a detailed overview of Carabao Group Public Company Ltd — a publicly‑listed Thai beverage company SET:CBG best known for its energy drinks, especially the Carabao Dang brand.
1. Main areas of activity Carabao Group Public Company Ltd is a Thailand‑based holding company primarily engaged in the production, manufacturing, marketing, sales, and distribution of energy drinks and other beverages. Its operations span domestic markets and international export channels, with products including energy drinks, functional/non‑carbonated beverages, sport drinks, drinking water, coffee products (instant and ready‑to‑drink), and distribution services for third‑party food and non‑food products.
2. Business model The Company generates revenue through a vertically integrated beverage business model. It manufactures its own branded drinks and beverages and sells them directly through its distribution network in Thailand and abroad. Additionally, it earns revenue by distributing both its own products and third‑party products across retail and modern trade channels. This includes revenue from finished beverage sales, distribution services, and sales of OEM/packaging products from its subsidiaries.
3. Flagship products or services Carabao’s flagship product is the Carabao Dang energy drink, marketed under the Carabao brand globally. Beyond energy drinks, the company offers electrolyte drinks (Carabao Sport), functional / vitamin‑enhanced beverages (e.g., Woody C+ Lock), drinking water, coffee 3‑in‑1 powder, ready‑to‑drink coffee, and other beverage formats. It also distributes third‑party consumer products in food and non‑food categories.
4. Key countries for business Carabao’s business is anchored in Thailand, which contributes the largest share of its revenue (about THB 15.35 billion of THB 20.96 billion in the latest financial year). It also operates in overseas markets across Southeast Asia (including Cambodia, Myanmar, Laos, and Vietnam) and beyond, exporting energy drinks and beverages to around 42 countries.
5. Main competitors Carabao competes with both regional and global beverage brands, particularly in the energy drink segment. Major competitors include: Osotspa Public Company Ltd’s M‑150 — a leading Thai energy drink brand.
T.C. Pharmaceutical Industries’ Krating Daeng — the original Thai energy drink precursor to Red Bull.
Red Bull GmbH (global energy drink brand).
International players such as Monster Beverage and other beverage firms offering energy, functional, and ready‑to‑drink categories.
6. External and internal factors contributing to profit growth External factors:
Growing beverage demand in Southeast Asia, driven by increasing energy‑drink consumption and retail expansion.
Export market penetration, especially in CLMV countries, supporting top‑line growth beyond Thailand.
Internal factors: Vertically integrated operations, including packaging and distribution capabilities, improving cost control and margin sustainability.
Strong domestic distribution network across traditional and modern trade, enhancing market coverage.
Diversification through entry into the beer segment: Carabao Group is investing in the development of its own beer brand, adding another revenue stream to its beverage portfolio. This move taps into the growing beer market in Southeast Asia and could reduce the company’s reliance on energy drink sales. A successful launch in the beer segment strengthens its overall retail presence and broadens its long-term growth opportunities.
7. External and internal factors contributing to profit decline External factors:
Intensifying competition from entrenched local and global energy drink brands exerting price and market share pressure.
Raw material and packaging cost volatility, especially aluminum and sugar, can squeeze margins.
Internal factors:
Dependence on energy drink category makes the company sensitive to shifts in consumer taste toward healthier alternatives.
Profit volatility observed in recent earnings trends compared with industry peers.
8. Stability of management Executive changes over past 5 years:
Carabao Group’s leadership has remained largely stable with Sathien Setthasit as CEO and Executive Vice Chairman, and a consistent executive team across finance and operations. Key figures also include senior directors in sales and operations spanning several years.
Impact on corporate strategy and culture:
This stability supported long‑term strategy continuity, including consistent branding, distribution expansion, and diversification into functional beverages and new products. Extended leadership tenure likely contributes to cohesive corporate culture and strategic clarity.
The analysis indicates that earnings per share currently show no growth, but this is balanced by steady long-term total revenue growth and very strong high-priority indicators, including excellent days sales outstanding, a debt-to-revenue ratio that looks great, and operating, investing, and financing cash flows that all appear strong, supporting overall financial stability. Medium-priority indicators largely reinforce this assessment, with return on equity showing steady long-term growth, solid days payable and inventory-to-revenue positions, strong interest coverage, and a current ratio that shows no recent progress but does not signal stress, while margins and operating expense ratios remain flat. With a P/E ratio of 14, the valuation is considered acceptable and consistent with the company’s current growth and profitability profile. No critical news was identified that could threaten the business or raise concerns about insolvency. Given a diversification coefficient of 20 and a deviation of the current stock price from its annual average of more than 4 EPS, an allocation of 5% at the closing price of the last daily bar reflects a measured and cautious portfolio positioning aligned with diversification principles.

Billions on Broccoli: What Is the Secret of Sprouts?The Redoubling is my own research project on TradingView, which is designed to answer the following question: How long will it take me to double my capital? Each article will focus on a different company that I'll try to add to my model portfolio. I'll use the close price of the last daily candle on the day the article is published as the initial buy limit price. I'll make all my decisions based on fundamental analysis. Furthermore, I'm not going to use leverage in my calculations, but I'll reduce my capital by the amount of commissions (0.1% per trade) and taxes (20% capital gains and 25% dividend). To find out the current price of the company's shares, just click the Play button on the chart. But please use this stuff only for educational purposes. Just so you know, this isn't investment advice.
Here is a detailed overview of Sprouts Farmers Market, Inc. NASDAQ:SFM :
1. Main areas of activity Sprouts Farmers Market is a U.S.-based retail company specializing in fresh, natural and organic foods. The company operates a chain of grocery stores designed to offer a “farm‑stand” experience — with a focus on produce, health‑oriented products and a curated selection of lifestyle‑friendly items. It falls within the consumer retail / food‑retailing industry, and its business segments revolve around grocery retailing of natural and organic food products in the U.S.
2. Business model Sprouts generates revenue primarily through its retail grocery operations (business‑to‑consumer, B2C). Customers visit Sprouts stores to purchase fresh produce, packaged organic/natural goods, deli, bakery, frozen foods, and other grocery items. The company also invests in new store openings and same‑store sales growth to drive expansion and profitability. In addition, it engages in store footprint expansion (new locations) and efficiency efforts (store size optimization, margin improvement) as part of its model.
3. Flagship products or services While “products” in retail are many, key aspects of Sprouts’ offering include:
Fresh produce at the heart of its stores (“farm‑stand heritage”).
Natural, organic and lifestyle‑friendly grocery items — including plant‑based, gluten‑free, keto/paleo‑friendly options.
Grocery store services including deli, bakery, dairy, meat/seafood, bulk foods. Despite the lack of a public breakdown of revenue by category, the company's focus on high-margin, health-oriented products is its competitive advantage.
4. Key countries for business Sprouts’ operations are entirely within the United States. The company runs more than 400 stores across multiple states. Because the market is U.S.-centric, the most important region is the domestic U.S. consumer market — particularly states where Sprouts has high density, and where natural / organic grocery demand is strong.
5. Main competitors Key competitors for Sprouts include other U.S. grocery chains that either emphasize natural/organic products or general supermarkets with strong fresh/health‑focused assortments. Examples include:
Whole Foods Market (owned by Amazon) – a major natural/organic specialist.
Kroger Co. – large general‑grocery chain that also competes on fresh/healthy products.
Publix Super Markets – regional player with store brands and emphasis on fresh/better food experience.
Wegmans Food Markets and other premium supermarket chains. Competition arises on product mix, pricing, store experience, fresh/produce quality, and loyalty offerings.
6. External and internal factors contributing to profit growth External factors:
Rising consumer demand for natural, organic and health‑oriented foods: Sprouts’ own commentary highlights that its “better‑for‑you” product assortments attract customers willing to spend more.
Growth in same‑store sales and new store openings: In a recent period Sprouts reported growth in same‑store sales and net sales.
Favorable macro trend toward fresh/healthy foods, lifestyle‑driven eating and premium grocery experiences.
Internal factors:
Store optimization: The company has discussed improving its margin structure and optimizing capital expenditures (CapEx) per store.
Curated product mix and lifestyle‑oriented offerings (plant‑based, gluten‑free, etc.) which could allow higher margin than mass grocery.
Loyalty programs and marketing aimed at increasing customer retention, basket size and frequency of shopping. For example, upgrades in product assortment and loyalty initiatives were emphasized in analyst commentary.
7. External and internal factors contributing to profit decline External factors:
Highly competitive retail grocery market: margin pressures from national chains, discounters and online grocery.
Inflation and increases in input costs (food, labor, energy) can squeeze margins if price increases aren’t fully passed to consumers.
Economic downturns or shifts in consumer spending could reduce premium/health‑oriented grocery purchases.
Supply chain disruptions, regulatory changes (e.g., organic certification costs, import/export tariffs) could raise costs or limit product availability.
Internal factors:
Execution risk in expansion: opening new stores requires capital and the risk that new locations may underperform.
Margin risk if rising wage/benefit costs erode profitability or if discounting becomes necessary to compete.
Dependence on a “better‑for‑you” positioning; if that niche gets commoditized or competitors copy the model, Sprouts could lose differentiation.
Possible over‑reliance on U.S. market (lack of international diversification).
8. Stability of management Executive changes over past 5 years:
A comprehensive list of CEO, CFO, or Chairperson changes was not found in readily accessible sources during this screening. Sprouts’ investor relations materials, however, emphasize strategic initiatives and capital allocation decisions, such as a substantial share repurchase program.
Impact on corporate strategy and culture:
The company appears to have a stable strategic focus on natural/organic fresh groceries, margin improvement, and store growth; the capital‑allocation decisions (store openings, CapEx discipline, share buybacks) suggest a coherent investment priority. For example, their presentation notes a “structurally improved margin profile”.
If leadership turnover has been modest (i.e., no major disruption publicly noted), then strategic continuity is probably intact. However, without detailed executive change logs I cannot conclusively assess management stability beyond what is implied by ongoing strategy consistency.
The company demonstrates steady long-term growth in earnings per share and total revenue, supported by strong working-capital discipline: days sales outstanding appear excellent, the debt-to-revenue ratio remains healthy, and operating, investing, and financing cash flows are solid. Medium-level indicators such as return on equity and gross margin show consistent improvement, while the operating expense ratio is trending positively, and both payables and inventory efficiency remain strong, though the current ratio shows no progress and requires monitoring for liquidity balance. With a P/E of 15, the valuation appears reasonable and reflects a sound margin of safety at current multiples. Despite the market's turbulent reaction to the latest financial statements, no critical news has been identified that could undermine stability or indicate risks of insolvency. Considering a diversification coefficient of 20 and a deviation of the current stock price from its annual average by more than 8 EPS, a 10% capital allocation was made at the closing price of the last trading day, maintaining a well-balanced portfolio position and a disciplined exposure aligned with diversification principles.
Who I'm Betting On Amid U.S.–China Trade TensionsThe Redoubling is my own research project, which is designed to answer the following question: How long will it take me to double my capital? Each article will focus on a different company that I've added to my model portfolio. I'll use the close price of the last daily candle on the day the article is published as the initial buy limit price. I'll make all my decisions based on fundamental analysis. Furthermore, I'm not going to use leverage in my calculations, but I'll reduce my capital by the amount of commissions (0.1% per trade) and taxes (20% capital gains and 25% dividend). To find out the current price of the company's shares, just click the Play button on the chart. But please use this stuff only for educational purposes. Just so you know, this isn't investment advice.
Here is a company overview of Silergy Corp. (Ticker: TWSE:6415 )
1. Main areas of activity Silergy Corp. is a fabless analog / mixed‑signal integrated circuit (IC) design company, with core strength in power management, signal-chain, and analog ICs used across consumer, industrial, automotive and computing segments. It positions itself with a “virtual IDM” model (i.e. outsourcing wafer fabrication while internally handling design, integration, and system-level functions).
2. Business model Silergy operates on a fabless IC design + licensing / product sales model. It designs analog, mixed-signal, and power-management chips, outsources manufacturing to foundries, then sells the finished ICs (and related services, such as reference designs, simulation tools, technical support). Its customers tend to be OEMs in consumer electronics, automotive, industrial applications, and computing, giving it a B2B business model.
3. Flagship products or services Key product lines include DC–DC regulators, AC/DC converters, power modules, LED drivers, battery management ICs, and signal chain devices (e.g. analog front ends). One notable acquisition is Teridian Semiconductor from Maxim, giving Silergy capabilities in energy‑metering / smart metering ICs. Silergy also invests heavily in R&D (with many engineers) and offers design / simulation support for its customers.
4. Key countries for business While headquartered (and significantly centered) in China (Hangzhou), Silergy also maintains key technology presence in Taiwan (its listing jurisdiction) and in the United States (technology / design offices in Santa Clara, CA). Given its customer base, it likely sells into global electronics markets (Asia, North America, Europe) through its design center networks.
5. Main competitors Silergy competes with global analog / power IC firms such as Texas Instruments, Infineon, ON Semiconductor, Analog Devices, Maxim Integrated (now part of Analog Devices), and other rising Chinese analog IC challengers. In particular, in the PMIC (power management IC) segment, these established global firms are strong incumbents.
6. External and internal factors contributing to profit growth External factors:
Rising demand for power-efficient devices (smartphones, IoT, electric vehicles, renewable energy systems) increases demand for analog / power management ICs.
Global electrification / green energy trends (e.g. energy management, battery systems) create new addressable markets.
The push for regional supply chain localization (e.g. China’s desire for domestic semiconductor capability) could favor Silergy.
Industry cycle recovery in semiconductors may lift demand and pricing conditions.
Internal factors:
Deep R&D investment and engineering talent allow Silergy to bring differentiated designs and higher integration.
Acquisition of Teridian gives it new capabilities and market reach in energy metering / smart grid space.
Its virtual IDM model keeps capital expenditure lower (no major fabs) and allows flexibility in scaling.
Strong relationships with foundries and customers, and its reference design / support offerings, can lock in customers and generate recurring design wins.
7. External and internal factors contributing to profit decline External factors:
Intense competition from entrenched analog / power IC giants that have scale, brand, and ecosystem advantages.
Price pressure in commoditized analog / power segments.
Volatility in semiconductor industry cycles, supply chain disruptions, or foundry capacity constraints.
Regulatory / geopolitical risks (e.g. U.S. export restrictions on advanced semiconductor tech to China) could hamper access or partnership.
Currency fluctuations, especially between TWD, USD, and RMB.
Internal factors:
Dependence on external foundries introduces operational and supply risks.
High R&D and design costs must be offset by sufficient sales volume; design failures or delayed product launches can be costly.
Execution risk in scaling new products / markets (e.g. smart metering) may stretch management.
If margins erode due to pricing or competition, profitability could suffer.
8. Stability of management Executive changes over the past 5 years:
Silergy was founded by a group of Silicon Valley veterans; among its key executives are Chen Wei (Chairman) and You Budong (Co‑CEO). While public filings do not emphasize frequent CEO turnover, as a relatively young and growth semiconductor company, leadership continuity has been fairly stable. (I did not find widely publicized recent CEO or CFO shake‑ups.)
Impact on strategy, priorities, culture:
The relative management stability seems to have supported a long‑term R&D and growth orientation. The acquisition of Teridian, expansion into U.S. design centers, and continued investment in analog / power domains suggest management has prioritized technological scale and geographic reach. The continuity in leadership aids consistency in corporate strategy.
Why am I going to add this company to my model portfolio?
I see growth in both earnings per share and total revenue. However, the days sales outstanding ratio has not changed. Although operating, investing, and financing cash flows are volatile, the balance sheet remains solid. The debt-to-revenue ratio, current liquidity, and interest coverage are all strong. Additional indicators, such as growing return on equity, a stable gross margin, lower operating expenses, and good payment terms, confirm the company’s resilience. The P/E ratio is 33.332, which I consider acceptable, given the company’s growth; however, continued execution remains important. I did not find any critical news that could affect the company's existence. With a diversification coefficient of 20 and a current stock price that deviates by more than 16 EPS from its annual average, I will allocate 15% of my capital to this company. This balanced decision is based on growth indicators and a strong balance sheet while maintaining caution due to the risks related to the external factors.

The Redoubling. BRBR: The New King of U.S. Sports Nutrition?About Redoubling
Redoubling is my own research project, which is designed to answer the following question: How long will it take me to double my capital? Each article will focus on a different company that I've added to my model portfolio. I'll use the close price of the last daily candle on the day the article is published as the trade price. I'll make all my decisions based on fundamental analysis. Furthermore, I'm not going to use leverage in my calculations, but I'll reduce my capital by the amount of commissions (0.1% per trade) and taxes (20% capital gains and 25% dividend). To find out the current price of the company's shares, just click the Play button on the chart. But please use this stuff only for educational purposes. Just so you know, this isn't investment advice.
Below’s a detailed overview of BellRing Brands, Inc. (ticker: BRBR )
1. Main areas of activity
BellRing Brands is a consumer nutrition company focused on the “convenient nutrition” category. It markets protein‑based products (ready‑to‑drink shakes, powders, and nutrition bars) under key brands such as Premier Protein, Dymatize, and PowerBar. BellRing operates as a holding company structure overseeing these brand businesses and focuses on scaling distribution, penetration, and innovation in nutrition.
2. Business model
BellRing generates revenue by selling its nutrition products (shakes, powders, bars) through multiple channels (e.g., club, mass retail, e‑commerce, convenience, specialty) in the U.S. and internationally. Its model is largely B2C (business to consumers) via retail and direct channels, but it also relies on partnerships with retailers, distributors, and co‑manufacturers to handle production, contract manufacturing, logistics, and shelf space. BellRing also invests in marketing, brand building, and household penetration to drive repeat purchases and buy rate growth.
3. Flagship products or services
BellRing’s main brands and product lines are:
Premier Protein : its flagship brand, offering ready-to-drink protein shakes, powder versions, and refreshing protein beverages. It is the largest contributor in their portfolio.
Dymatize : positioned more toward sports nutrition / performance protein powders and related products.
PowerBar : a legacy nutrition bar brand, serving more as an international / cross‑category extension.
4. Key countries for business
While BellRing’s primary market is the United States, the company is working to expand its international presence. Dymatize’s international growth is cited as a positive driver. The PowerBar brand, too, has reach in over 35 international markets, particularly in Europe. That said, BellRing is often characterized as a “pure-play U.S. nutrition company” with ambitions to globalize further. Given that most of its distribution and consumer footprint is U.S.-centric, domestic retail, e‑commerce, and convenience channels are especially critical.
5. Main competitors
BellRing competes in the broader food, beverage, and nutrition space. Key competitive and peer companies include:
Medifast, Inc. (nutrition / diet & wellness products).
Large consumer goods and beverage companies like Coca-Cola, Unilever, Keurig Dr Pepper, Hershey (via beverage / nutrition arms).
Specialty nutrition / supplement companies in protein, health / wellness space.
According to Craft, competitors include Amy’s Kitchen and others in adjacent nutrition / food segments.
In more aggregate industry comparisons, BellRing is grouped with food processing and consumer non‑cyclical peers.
6. External and internal factors contributing to profit growth
External factors
Macro trends toward health, wellness, and functional nutrition: As consumers increasingly seek products with protein, clean labeling, convenience, and functional benefits, BellRing is well positioned to capture demand.
Low penetration in key product segments: The company notes that shakes as a segment still have relatively low household penetration (e.g., 48% in some tracked channels), implying room for growth.
Distribution expansion and new channels (e‑commerce, convenience): Growth across untracked channels, international sales, and digital platforms can expand reach.
Commodity cycles and input cost declines: Favorable raw material or input cost trends (or hedges) may improve margins. In Q4 2024, the company cited net input cost deflation as contributing to higher margins.
Internal factors
Brand strength and household penetration growth: Premier Protein has seen strong gains in penetration, which supports recurring demand.
Supply and manufacturing scale-up: BellRing has built out co‑manufacturing networks and increased shake supply to remove constraints.
Operational efficiency and margin expansion: The company uses cost discipline, procurement, production fees (e.g. attainment fees), and hedging strategies.
Share repurchase programs: The company actively buys back shares to return capital and support per‑share earnings growth.
Product innovation and extensions: New product launches under the nutrition umbrella can drive incremental volume and revenue.
7. External and internal factors contributing to profit decline
External threats
Intense competition and market saturation: The nutrition / functional beverage space is crowded, with many well-capitalized incumbents. Loss of shelf space or promotional pressure could erode margins.
Retailer power and inventory cuts: In Q3 2025, BellRing disclosed that major retailers cut weeks of supply, expected to create a growth headwind.
Input cost inflation and commodity volatility: Rising costs or unfavorable mark-to-market hedging could compress margins.
Regulatory, labeling, or health claims risks: In food, beverage and nutrition sectors, regulatory changes around supplements, health claims, or labeling could impose costs.
Legal / litigation exposure: BellRing disclosed a $90 million class‑wide settlement related to past litigation (Joint Juice).
Internal weaknesses
Overdependence on core brands / product categories: If Premier Protein underperforms, the company’s revenue concentration could pose risk.
Operational execution risks: Scaling manufacturing, supply chain disruptions, quality control failures, or missteps in marketing could hurt growth.
Legal reserves / unexpected provisions: The provision for legal matters in Q3 2025 hit results, dragging operating profit.
8. Stability of management
Executive changes in the past 5 years
Darcy Horn Davenport serves as President & CEO and is on the board. She previously led Post’s Active Nutrition business before BellRing was spun off.
Paul Rode is CFO, with long experience in the nutrition business and prior roles at Post, including serving as CFO of Post’s Active Nutrition.
On July 30, 2025, BellRing announced that Elliot H. Stein, Jr. will resign from the Board effective September 30, 2026. Concurrently, Thomas P. Erickson was appointed lead independent director, Shawn W. Conway became Chair of the Compensation & Governance Committee, and Jennifer Kuperman joined the Executive Committee.
These changes are described as governance/committee reassignments rather than executive turnovers.
Impact on corporate strategy / culture
The management team appears relatively stable at the top, with no major CEO or CFO turnover recently. The board changes seem more about committee roles and succession planning rather than a radical shift. Under Davenport’s leadership, the company has executed aggressive growth, brand penetration, and supply expansion strategies, suggesting continuity and alignment between management and strategy. The board adjustments are intended to facilitate smooth continuity rather than disrupt direction, which may support investor confidence.
Why did I add this company to my model portfolio?
I took a look at the company's basics, and it seems like earnings per share aren't growing right now, but total revenue is growing steadily over time. This, combined with a low debt-to-revenue ratio and steady operating, investing, and financing cash flows, gives the balance sheet a good foundation. Some other things to note are that return on equity and gross margin are growing steadily, the current ratio is strong, and interest coverage is excellent. All of these things show that liquidity and solvency are solid. With a P/E of 20.36, I think the valuation is interesting given these fundamentals and consistent with a balanced growth profile.
I didn't find any major news that could threaten the company's stability or lead to insolvency. Considering a diversification coefficient of 20 and an observed deviation of the current stock price from its annual average by more than 16 EPS, I decided to allocate 15% of my capital to this company at the close price of the last daily bar.
Portfolio overview
Below are screenshots from TradingView's Portfolios tool. I used $100,000 as my initial capital for the model portfolio. I will update these screenshots as I add new trades.
