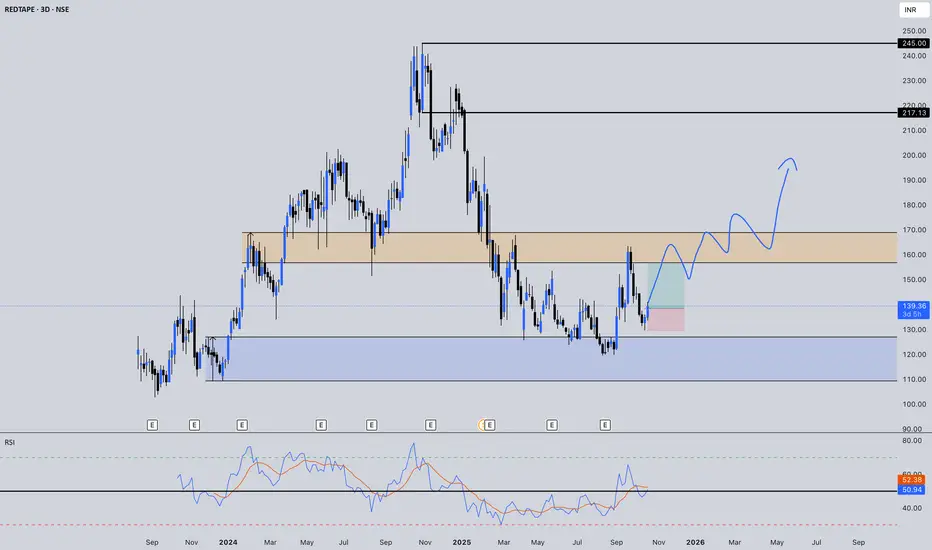
REDTAPE: Reversal or Continuation? | w/ AI Powered InsightsAfter a brutal 50% crash from ₹245 ATH to ₹120 panic lows, REDTAPE is attempting recovery. Now testing the make-or-break demand zone at ₹155-170.
🔍 Technical Snapshot:
🔺 Critical Resistance: ₹155-170 (demand zone reclaim needed)
🔺 Major Target: ₹220 (previous distribution area)
🔻 Support: ₹125-130 (recent lows - must hold)
📈 RSI: 52 (crossing above 50 - first momentum shift in months)
📉 Pattern: Potential double bottom forming at ₹125 vs ₹110 lows
🧠 AI-Powered Insights:
⚡️ COMPARATIVE INTELLIGENCE:
➡️ Momentum Rank: #12/50 in retail sector
➡️ Pattern Match: Similar to JUBLFOOD (6 months ago - rallied 40%)
➡️ Sector Divergence: Retail index +8%, REDTAPE +3% = Lagging
Institutional Flow: Top 3 retail stocks seeing 3x volume, REDTAPE only 1.2x
➡️ REDTAPE is underperforming sector leaders by 60% -
either massive catch-up ahead OR fundamental weakness confirmed.
⚡️ STATISTICAL PATTERNS RECOGNITION:
Double Bottom at ₹125 zone (like REDTAPE):
✅ 68% break above resistance within 4 weeks
✅ Average move after break: +42%
❌ 32% fail back to lows (avg loss -18%)
RSI crossing 50 after 6-month downtrend:
✅ 73% continue higher (next 2 weeks)
✅ Best outcome when volume >2x on breakout
🎲 Probability Score: 65/100 (Moderate-High setup)
💼 SMART MONEY VOLUME ANALYSIS:
- Oct 14-16: 5.2x volume at ₹125 = Accumulation pocket
- Oct 17-18: Volume dropped 40% at ₹139 = Weak hands buying
Microstructure Alert:
- 73% time spent ABOVE ₹135 = Acceptance building
- Upper rejection at ₹145 (78% failure rate) = Distribution zone
🔍 AI Verdict: Institutions accumulated at ₹125, now distributing
at ₹139-145. Retail buying the bounce, smart money selling into strength.
⚠️ Translation: You might be exit liquidity at current levels.
🌊 Capital Flow Map (NSE - Real-time):
Money LEAVING: IT (-₹2,400 Cr) | Pharma (-₹890 Cr)
Money ENTERING: Banking (+₹3,200 Cr) | Auto (+₹1,100 Cr)
Retail Sector: NEUTRAL (+₹45 Cr) - No major inflow
➡️ REDTAPE's Challenge:
Sector getting ignored while banking/auto sucks up liquidity.
Even if setup perfect, money flow isn't supporting retail plays.
🎯 Fighting against the tide. Technically good,
fundamentally challenging timing.
🕰️ AI Pattern Match: Historical Twins
REDTAPE's current setup matches 3 historical patterns:
1️⃣ JUBLFOOD (Mar 2024):
- Similar: Double bottom + RSI crossing 50
- Outcome: +42% in 6 weeks
- Difference: JUBLFOOD had 3x volume, REDTAPE only 1.2x
2️⃣ TATACONSUM (Nov 2024):
- Similar: Bounce from -48% crash
- Outcome: Failed at resistance, -15% back to lows
- Difference: TATACONSUM had sector weakness (like REDTAPE now)
3️⃣ ABFRL (Jun 2025):
- Similar: Retail sector, ₹125-170 range
- Outcome: Ranged for 12 weeks, then broke down -22%
- Difference: ABFRL had declining volume (like REDTAPE)
📊 Success Rate: 1/3 (33%) - Not great odds
⚠️ Failure Pattern: 2/3 matched current negative factors
🎯 AI Verdict: Setup similar to past FAILURES more than SUCCESS.
Probability favors ranging/downside unless volume surges.
😱 Contrarian Alert: What Retail Doesn't See
Twitter Sentiment (REDTAPE): 78% bullish posts
Institutional Flow: 3:1 selling vs buying (last 5 days)
Option Chain: Put/Call ratio 1.8 (bearish positioning)
🚨 DIVERGENCE DETECTED:
Retail buying, institutions selling, smart money hedging downside.
Classic Distribution Pattern:
- Price bounces (retail gets excited)
- Institutions offload positions
- Retail left holding when support breaks
⚡️ HEALTH SCORE & RANKING:
Technical Strength: ████████░░ 65/100
Volume Conviction: ███░░░░░░░ 28/100
Sector Momentum: █████░░░░░ 48/100
Risk/Reward Ratio: ████░░░░░░ 42/100
Pattern Success Rate: ████░░░░░░ 38/100
Institutional Interest: ██░░░░░░░░ 22/100
🎯 OVERALL SCORE: 40/100 (Below Average)
💡 Better Opportunities: 12 stocks scored 65+ today
What I'm Watching:
1️⃣ Tan demand zone (₹155-170) ahead - The battleground for bulls
2️⃣ Higher low structure: ₹125 vs previous ₹110 low = Improving
3️⃣ RSI breaking above 50 after months of weakness = Momentum reversing
4️⃣ Still trading below ALL major MAs - long-term structure remains bearish
5️⃣ Red MA declining sharply - needs reclaim for trend confirmation
6️⃣ Blue arrow projection: ₹125 base → ₹139 bounce → Target ₹200+ if ₹170 breaks
RRR is favourable at CMP.
Recovery plays from panic lows offer asymmetric setups - high risk, higher reward 🎯
Not advice - just what the chart shows.
Breakout Scenarios:
- Above ₹170 with volume → ₹190-220 targets (+36-58%)
- Below ₹125 breakdown → ₹110 panic zone (-21%)
The Setup: This isn't a consolidation - it's a recovery bounce testing critical resistance. Break above ₹155-170 confirms reversal. Rejection sends it back to test ₹125 lows.
Key Decision Levels:
→ ₹170 break = Recovery confirmed
→ ₹155-170 rejection = Range-bound torture continues
→ ₹125 break = Back to panic zone
Next 2-4 weeks critical. Volume surge above ₹170 will separate hope from reality. 🔥
⚠️ Disclaimer: This is NOT a buy/sell recommendation. This post is meant for learning purposes only. Views are personal. Please, do your due diligence before investing. (#DYOR)⚠️
💬 What's your take on this recovery attempt? Sustainable or dead cat bounce? Drop your views below! ✌️
➡️ Want the high-probability setups? Comment "YES"
🔥 Trade Safe! ✅ 🚀
Redtape
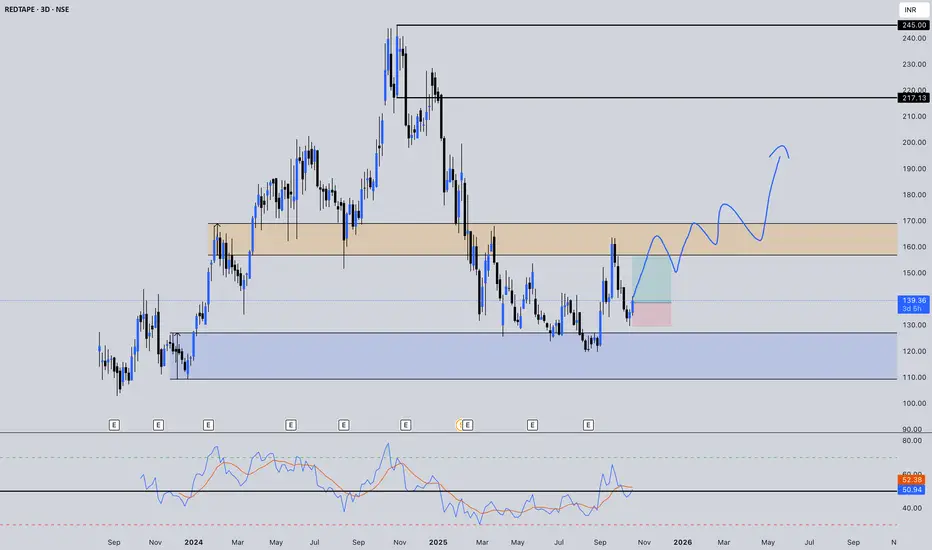
Bounce from the Depths - Testing Critical Demand ZoneAfter a brutal 50% crash from ₹245 ATH to ₹120 panic lows, REDTAPE is attempting recovery. Now testing the make-or-break demand zone at ₹155-170.
🔍 Technical Snapshot:
🔺 Critical Resistance: ₹155-170 (demand zone reclaim needed)
🔺 Major Target: ₹220 (previous distribution area)
🔻 Support: ₹125-130 (recent lows - must hold)
📈 RSI: 52 (crossing above 50 - first momentum shift in months)
📉 Pattern: Potential double bottom forming at ₹125 vs ₹110 lows
What I'm Watching:
1️⃣ Tan demand zone (₹155-170) ahead - The battleground for bulls
2️⃣ Higher low structure: ₹125 vs previous ₹110 low = Improving
3️⃣ RSI breaking above 50 after months of weakness = Momentum reversing
4️⃣ Still trading below ALL major MAs - long-term structure remains bearish
5️⃣ Red MA declining sharply - needs reclaim for trend confirmation
6️⃣ Blue arrow projection: ₹125 base → ₹139 bounce → Target ₹200+ if ₹170 breaks
RRR is favourable at CMP.
Recovery plays from panic lows offer asymmetric setups - high risk, higher reward 🎯
Not advice - just what the chart shows.
Breakout Scenarios:
- Above ₹170 with volume → ₹190-220 targets (+36-58%)
- Below ₹125 breakdown → ₹110 panic zone (-21%)
The Setup: This isn't a consolidation - it's a recovery bounce testing critical resistance. Break above ₹155-170 confirms reversal. Rejection sends it back to test ₹125 lows.
Key Decision Levels:
→ ₹170 break = Recovery confirmed
→ ₹155-170 rejection = Range-bound torture continues
→ ₹125 break = Back to panic zone
Next 2-4 weeks critical. Volume surge above ₹170 will separate hope from reality. 🔥
⚠️ Disclaimer: This is NOT a buy/sell recommendation. This post is meant for learning purposes only. Views are personal. Please, do your due diligence before investing. (#DYOR)⚠️
💬 What's your take on this recovery attempt? Sustainable or dead cat bounce? Drop your views below! ✌️
🔥 Trade Safe! ✅ 🚀
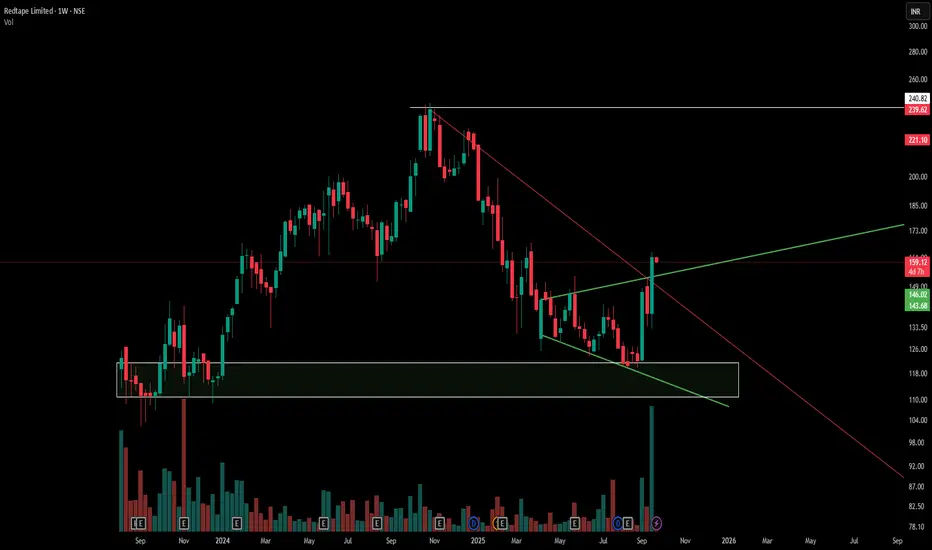
Charting Counter Trends with Broadening FormationsThis chart offers a deep dive into three vital technical pillars:
1) White Box -The demand box marks a price area where buying strength repeatedly emerges, acting as a support anchor.
2) White line - The supply line overhead identifies zones where selling pressure historically dominates, framing resistance.
3) The Red line -A red counter trendline (CT) tracks recent corrective moves against the broader swing, helping isolate short-term rotation.
4) The Green line -Overlaying these, the green broadening pattern signals consolidation through widening highs and lows—a structure often missed at first glance.
By stacking supply, demand, counter trendlines, and broadening consolidation, traders can recognize layered market behavior. Patterns rarely exist in isolation; understanding their interplay builds disciplined chart reading skills and deepens price action insight.
Disclaimer: This content is for educational purposes and not financial advice. Always do your own research before making trading decisions.
REDTAPEREDTAPE is breaking all previous resistance and showing very good strength with decent volume. It may get some momentum run from current level.

Short Term Trading Idea in Redtape Ltd. for 25% UpsideHi,
NSE:REDTAPE has given a Bullish Flag Breakout on Daily charts with very good volume.
MACD is also on the bullish side on Weekly time frame. RSI is also on the bullish side on daily and weekly time frames.
In the current market scenario, I am expecting that the bullish momentum will continue.
Complete price projection like entry, stop loss and targets mentioned on the charts for educational purpose.
Don't Forget to Follow me to get all the updates.
Please share your feedback or any queries on the study.
Disclaimer: Please consult your financial advisor before making any investment decision.

REDTAPE - Bullish Momentum with VolumesNSE: REDTAPE is closing with a bullish momentum candle supported with volumes.
Today's volumes and candlestick formation indicates strong demand and stock should move to previous swing highs in the coming days.
The stock has been moving along the horizontal support for the past few days which is indicating demand.
One can look for a 8% to 14% gain on deployed capital in this swing trade.
The view is to be discarded in the event of the stock breaking previous swing low.
#NSEindia #Trading #StockMarketindia #Tradingview #SwingTrade

MIRZA INTERNATIONALwe can see a good breakout in mirza international share, share is in consolidation phase from a very long time.
We can see a head and shoulder pattern in this share
we can make it long from here with Stop loss of 55 and the targets are 110.
Thanks
