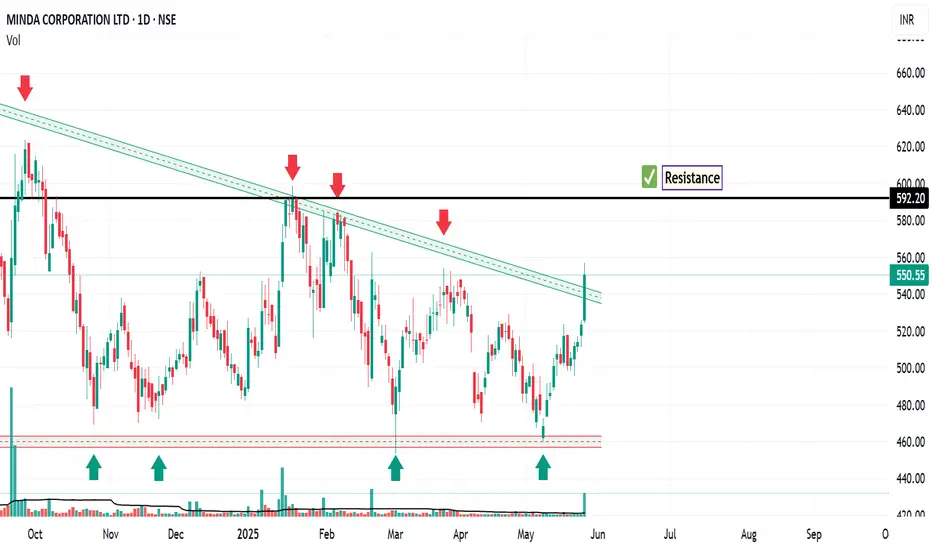
Minda Corp: Gearing Up for a BreakoutThe chart of Minda Corp provides delineates critical price thresholds that signify breakout points, along with specific support levels that serve as indicators of where buying interest may manifest.
Additionally, the chart highlights regions likely to act as ceiling points for future price ascensions, allowing for informed decisions on entry and exit strategies.
Disclaimer: The information contained in this technical analysis report is intended solely for informational and educational purposes. It should not be interpreted as financial advice or a recommendation to buy or sell any security. Investors are strongly encouraged to conduct their own research and consult with a qualified financial advisor before making any investment decisions.
Regression
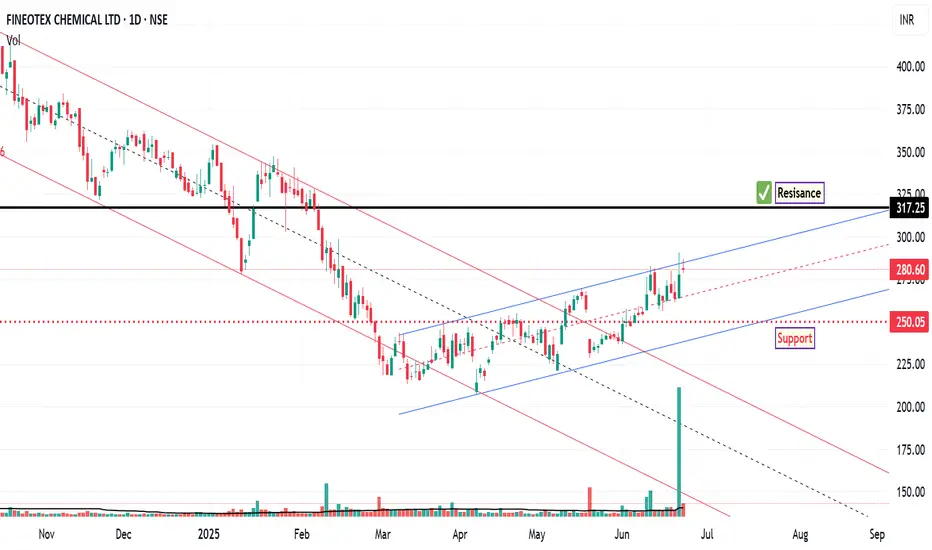
FCL: Technical Setup Signals 10% Upside Potential
The chart of FCL outlines key price levels that represent potential breakout zones, signaling shifts in market momentum. It also identifies critical support areas where buying interest may emerge, offering insight into potential entry points.
Additionally, resistance zones are clearly marked, indicating probable barriers to upward price movement. These levels are instrumental in formulating strategic entry and exit decisions based on anticipated market behaviour.
Disclaimer:
This technical analysis is provided for informational and educational purposes only. It does not constitute financial advice or a recommendation to buy or sell any security. Investors should perform their own due diligence and consult with a licensed financial advisor before making any investment decisions.
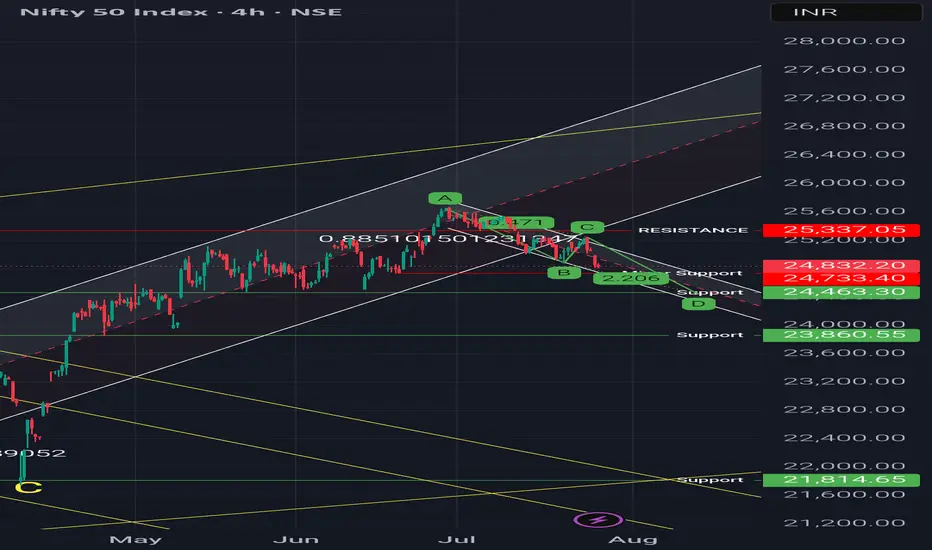
Regression channel & Harmonic pattern - Short term bearish trendObservations:
1. It is short term bearish trend as long as price holds above 24400
2. Price is below 50 DEMA
Possible Scenarios:
1. Price may attempt a mean reversion toward the median line of the channel
2. A break above could retest the 25,240–25,337 resistance zone, up move can only be considered when weekly candle will closed above that level because on weekly time frame there is 4 crows formation.
3. Harmonic patterns (1:1) suggests, the level of 24470 Support level in coming 10-15 trading days.
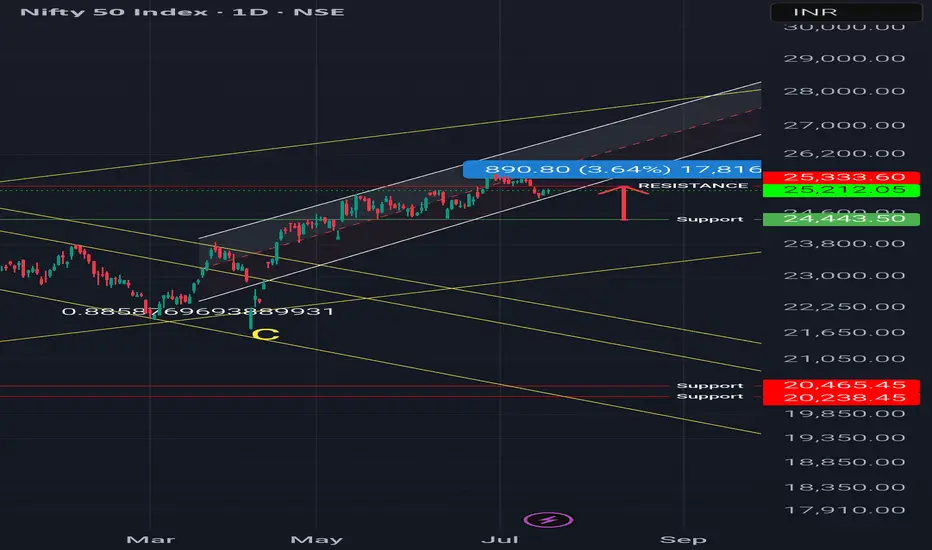
Nifty Outlook - Regression Channel 1. Confluence of regression channel + support/resistance = Trading Move expected in this week or next
2. Support at 24,443
3. Resistance is at 25300-350
If it crosses the resistance we will get to see the New High in Nifty.
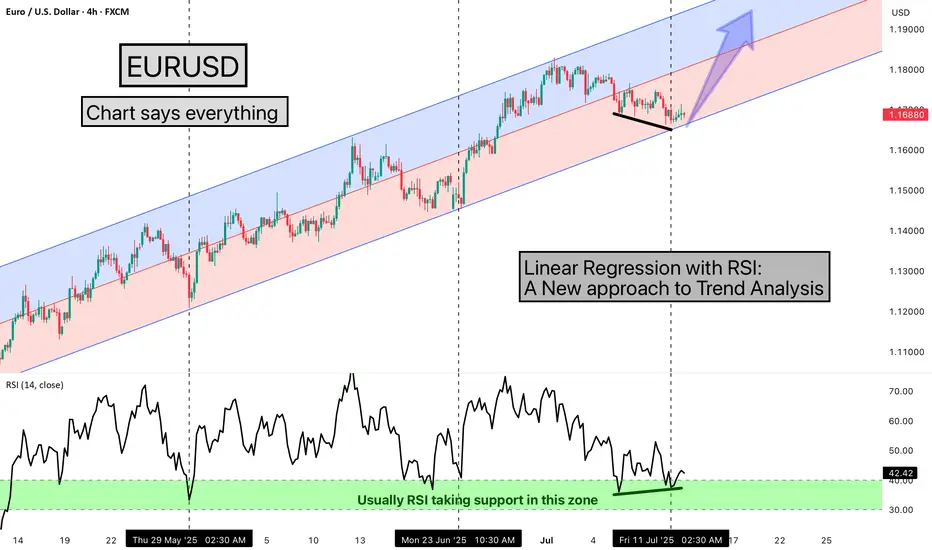
Linear Regression with RSI: A New approach to Trend AnalysisHello Friends,
Welcome to RK_Chaarts,
Today we are going to learn one Method of analysing the chart, here we are using EURUSD chart, and the method we're using is very simple & interesting, We are using the Linear Regression Trend Channel & Relative Strength Index (RSI), What happens in this method, is that we identify a particular zone where the price is making a one-sided move, like if the price is trending upwards, making higher highs and higher lows. We then apply a regression channel to it, and within that channel, we set internal deviation for the upper and lower sides, like 2 or 2.5 or 3 etc., whatever setting it takes.
In this chart, we can clearly see that the 2.5 setting is forming a complete channel, which we've applied for the last two months, from 12th May 2025, when the uptrend started. We've used the 4-hour time frame chart and the RSI. Every time the price hits the bottom of the channel, we can see that the RSI also enters the same zone, between 30-40, and from there, it bounces back.
Currently, the price has again hit the bottom of the regression channel, and the RSI has also gone below 40, between 30-40. And the good thing is that we're seeing a positive divergence in the RSI. So, there's a high possibility that the price might bounce back from here.
It's worth watching what happens next in the market. Nothing is guaranteed here; everything is a game of probabilities. This is one method that we often use, and its results have given us a very good experience. So, let's see what happens next in this chart. This observation is also a good learning experience, which we often encounter, 7-8 times out of 10, in favor of the market, but sometimes it doesn't work, maybe 2-3 times, when the trend changes. So, let's see what happens next.
This post is shared purely for educational purpose & it’s Not a trading advice.
I am not Sebi registered analyst.
My studies are for educational purpose only.
Please Consult your financial advisor before trading or investing.
I am not responsible for any kinds of your profits and your losses.
Most investors treat trading as a hobby because they have a full-time job doing something else.
However, If you treat trading like a business, it will pay you like a business.
If you treat like a hobby, hobbies don't pay, they cost you...!
Hope this post is helpful to community
Thanks
RK💕
Disclaimer and Risk Warning.
The analysis and discussion provided on in.tradingview.com is intended for educational purposes only and should not be relied upon for trading decisions. RK_Chaarts is not an investment adviser and the information provided here should not be taken as professional investment advice. Before buying or selling any investments, securities, or precious metals, it is recommended that you conduct your own due diligence. RK_Chaarts does not share in your profits and will not take responsibility for any losses you may incur. So Please Consult your financial advisor before trading or investing.
Confluence level - Nifty it can act as support or reversal 1. Downward regression channel bottom
2. Ascending Channel Bottom
3. Abc correct pattern 1:1
4. Previous Support level
What is confluence?
It's meeting point or multiple technical parameters coincides, like I mentioned above
What to expect?
1. Reversal if prices goes above 23400
2. If any short comming occurs next level could be 20200

EMMBI: Long Term SetupThe chart provides delineates critical price thresholds that signify breakout points, along with specific support levels that serve as indicators of where buying interest may manifest.
Additionally, the chart highlights regions likely to act as ceiling points for future price ascensions, allowing for informed decisions on entry and exit strategies.
Disclaimer: The information contained in this technical analysis report is intended solely for informational and educational purposes. It should not be interpreted as financial advice or a recommendation to buy or sell any security. Investors are strongly encouraged to conduct their own research and consult with a qualified financial advisor before making any investment decisions.

EID PARRY: Long Term SetupThe chart provides delineates critical price thresholds that signify breakout points, along with specific support levels that serve as indicators of where buying interest may manifest.
Additionally, the chart highlights regions likely to act as ceiling points for future price ascensions, allowing for informed decisions on entry and exit strategies.
Disclaimer: The information contained in this technical analysis report is intended solely for informational and educational purposes. It should not be interpreted as financial advice or a recommendation to buy or sell any security. Investors are strongly encouraged to conduct their own research and consult with a qualified financial advisor before making any investment decisions.

AGI on the RiseAGI has shown significant volatility in recent months, responding to broader market trends, investor sentiment, and various macroeconomic factors. As of the latest trading data, AGI is positioned to explore further upside potential while establishing key support levels that investors should monitor.
The long-term outlook for AGI appears predominantly bullish with a suggested price target of 1972 , underpinned by a strong support level at 888 . Investors, keep a close watch on significant price action around these levels.
Disclaimer: The information presented in this technical analysis report is intended solely for informational and educational purposes. It should not be interpreted as financial advice or a recommendation to buy or sell any securities. It is imperative for investors to conduct their own due diligence and research before making any investment choices.

Island Top - Reversal Pattern, Rsi DivergenceIsland Reversal,
A significant gap up, or sharply higher price at the open, follows an upward price trend, then reverses to a bearish price trend.
Rsi divergence implies a change in relative strength as compared to price movement.
The price has come out of the regression channel.
Probably we are in the 4th wave, which means we have completed the top of the 3rd impulse wave. This would be confirmed if it closed below 21550 in the coming weeks.

Bold move of gold is about to hold1. Price is out of regression,
Thats an outlier movement, which explained the intensity of the impulse, its a characteristic movement of 3rd wave
2. Internal wave structures & Primary wave analysis,
5 sub wave of 3 primary wave is am extension wave, price structure is quite stiff and resembles with Climax Top
3. Cup & Handle pattern target has achieved, have spotted 2 such a structures
4. Deviation from 200 ema
Considering these counts, price could come to 67600 Or 62500, this would be complex correction & expected to see flag formation.

42K-47K Resistance zonePrice is Out of regression channel & breakout is upward, that shows the strength of the trend But the now price has reached juncture where it could face a resistance

Bullish Kicker - Regression Channel BODaily time frame;
Regression Channel breakout Indicates Change in trend
Weekly time farmes;
Bullish Kicker candlestick signals reversal from the yellow support line, which was drawn from two prior tops (Oct'21 & Nov'22), which provided support as projected
Way forward,
1. Resistance, 19600
2. Support, 19200-19250

dxy analysis #DXY
1)The Index is trading above june 8 levels
2) yesterday, it broke and closed above 103.60 which was acting as a strong hurdle closing basis
3)The counter is trading with upward sloping trendline
4) 104.85-105 is nearest ideal testing level now

Rising channel pattern | PB Fintechrising channel pattern breakout and retested in stock
looking good for up side
for swing trade : Buy above 732 with sl 680 for target of 810

Regression channel breakout Nifty is heading towards the next resistance 18100-18200 range. It has given regression channel breakout with strong relative strength to the weekly time frame and it came with a strong gap-up opening.
Now the price is likely to settle at over 17600.
For the next 1 or 2 days small daily candles may get a form if there is any uncertainty related to price sustenance.

Bank NiftyEverything is mentioned in Video.
This regression line is plotted on daily charting. This is for swing traders. . This is not meant for intraday traders.

Kotak Mahindra BankThis video is only for education purpose. It shows that how any swing trader can make a position in combination of support and resistance level and regression channel.
We have analyze Kotak Mahindra Bank on daily chart. Bank is showing one way fall from INR 2000 to 1650. It is clearly shown with sliding regression channel.
After touching 1650, stock goes up to 1693. One can make long position if and only if stock breaks upper limit of regression channel on daily closing basis.
Note : - Please take your position after consulting SEBI registered investor advisor or analyst.

CYIENT: Bullish StructureNSE:CYIENT has a regression channel which can potentially be broken out as the momentum is pretty good.
Hopefully volume will pick up as well.
Trade: Buy above 936, SL: 920, T: 946/960/980

Nasdaq is below 200 Weekly EMAIt has been observed only once before this, it was seen last time in the 2008 crisis.
This could be an alert ⚠️
The regression channel is still intact, price is trending within the channel.
The previous low of 10440 could offer support, below that things could go worse

Short term bearish outlook on niftyThe price has come out of the regression channel and took a bearish path.
Considering the price pattern structure, it was expected the market to spend some time around important breakouts, this time it was about price sustainability over ATH, as we broke the previous high of 18600, it was expected the price behavior to become sideways, this is a usual phenomenon before important price action. It puts investors and traders in a conundrum that results in a lack of participation.
Then news of an interest rate hike of 0.35% changed the direction of the market.
Next support is at 18150-18250 range

Banknifty is Fallowing Regression Trend in Daily TimeframeElliott wave indicates that Banknifty should take correction but in my view it will Fallow Regression Trend in Daily Timeframe

us composite indexIndex in a downward regression channel
immediate support at 10900 while upward journey could go towards 13114
