Powergrid inside Perfect Descending Parallel Channel PatternPowergrid seen travelling perfectly inside the descending channel pattern, taking perfect resistance and support at the channel (from April 2025 till now)
Now seen at the perfect crucial point where it can either move bullish or bearish in the upcoming days
Bearish view gets cancelled on getting past the red dotted line...till that we can't be bullish on Powergrid!!!
Just add to the watchlist and let's watch how its going to move!!!!
will update once the decider move occurs!!!!
Just Sharing my view ...not a tip nor Advice!!!
Thank you!!!
RELIANCE

Reliance IndustriesReliance has broken an important level marked in Red dashed line, which will now act as a resistance, It is sustaining below this level which could be bearish sign,
So if it rejects from the yellow dashed line at 1466 and breaks the white dashed line at 1445 level then it could test below key support at 1380 marked on the chart or to the green dashed line .
Disclaimer :
It's a personal view not a financial advice and I assume no responsibility and liability whatever outcome arises.

RELIANCE : Analysis and Prediction
Timeframe: 1D
Structure: ABC corrective structure within a broader range
Current Price Zone: ~₹1,458
Market Phase: Post-distribution correction from extended retracement highs
🔍 Big Picture Market Structure (Educational View)
Reliance has completed a strong impulsive upmove, followed by profit booking from an extended Fibonacci retracement zone (113%–127%), which is clearly visible near the recent highs.
This behavior is textbook market psychology:
Smart money distributes positions near extended projections
Late buyers enter near highs
Price then corrects to value zones, where demand is reassessed
The chart now reflects a classic ABC correction:
Wave A: Sharp rejection from supply zone
Wave B: Temporary bounce (short covering + dip buying)
Wave C: Ongoing corrective leg testing demand
📐 Why These Levels Matter (Trading Psychology Explained)
🔴 Supply Zone: ₹1,580–1,610 (113%–127%)
This zone triggered strong selling because:
Long-term holders booked profits
Institutions reduced risk at stretched valuations
Breakout buyers were trapped
📌 Extended Fibonacci zones often act as exhaustion points.
🟡 Golden Support Zone: ₹1,398–1,476 (50%–78.6%)
This zone is critical because:
It represents fair value retracement of the prior rally
Dip buyers and positional traders look for re-entry here
Short sellers start covering partially
🧠 Markets frequently pause or bounce here due to a balance between fear (from longs) and greed (from value buyers).
🔵 Lower Extended Support: ₹1,267–1,305 (127%–113%)
If the golden zone fails:
Confidence of dip buyers weakens
Panic selling increases
Price seeks deeper liquidity
📉 This is where only high-conviction buyers step in.
🟢 Bullish Reaction Scenario (Base Case)
If price:
Holds above ₹1,398–1,420
Shows stabilization (small candles / higher lows)
Then:
First recovery toward ₹1,476 (50%)
Further bounce possible toward ₹1,580
Momentum buyers re-enter above broken VWAP zones
📈 This would be a corrective bounce, not a fresh trend yet.
🔴 Bearish Continuation Scenario (Risk Case)
If price:
Fails to sustain above ₹1,398
Closes decisively below this zone
Then:
Downside opens toward ₹1,305 → ₹1,267
Breakdown reflects loss of confidence by dip buyers
Sentiment shifts from “buy the dip” to “sell on bounce”
🎓 Educational Takeaways for Traders
Extended rallies end with distribution, not collapse
Fibonacci levels work because most traders watch them
Corrections test patience, not intelligence
Price reacts where emotions are highest, not where logic feels comfortable
🧠 Trading Psychology Behind This Chart
Zone Trader Behavior
Highs (1,580–1,610) Greed → Distribution
Pullback begins Hope → Dip buying
Golden zone Fear vs Opportunity
Breakdown Panic & Capitulation
📘 Markets move because people react — levels simply highlight where reactions cluster.
🔮 Price Outlook (Educational Projection)
Above ₹1,420: Range-bound recovery likely
Above ₹1,476: Momentum improves, bounce extension possible
Below ₹1,398: Deeper correction toward ₹1,305
Below ₹1,267: Structure turns weak on higher timeframe
🧾 Conclusion
Reliance is currently in a healthy corrective phase after profit booking from stretched levels.
The ₹1,398–1,476 zone is the most important area to watch — it will decide whether this correction ends as accumulation or turns into distribution continuation.
📌 Let price confirm intent; don’t predict emotions.
⚠️ Disclaimer
This analysis is for educational purposes only. I am not a SEBI registered analyst. Markets are uncertain, and I can be wrong. Please consult a financial advisor before trading or investing.

RELIANCE: Major Weekly Breakout & Long SetupTechnical Analysis
Structure Breakout: The stock has successfully broken out above a key multi-month resistance level at 1592.30 (marked by the green horizontal line). This level previously acted as a significant supply zone, forming the rim of a potential bullish consolidation pattern (resembling a Cup & Handle or Rounding Bottom).
Momentum: The recent weekly candles show strong bullish momentum, pushing through the resistance with conviction. The price is now sustaining above this breakout point, which validates the bullish thesis.
Trend Continuation: After a period of correction and consolidation, the primary uptrend seems to be resuming. The Higher High (HH) formation on the weekly chart confirms the strength of buyers.
Risk/Reward: The setup offers an excellent Risk-to-Reward ratio (approximately 1:3), making it a high-probability trade for positional traders.
Trade Setup (Long)
Entry Zone: 1592 - 1600 (On the retest or continuation above the breakout level)
Stop Loss: 1509.15 (Placed below the breakout candle and recent swing structure to invalidate the thesis)
Target: 1855.60 (Projected measured move based on the depth of the previous consolidation)
Potential R:R: ~ 1:3.1
⚠️ Disclaimer: This analysis is for educational purposes only and does not constitute financial advice. I am not a SEBI registered analyst. Trading involves risk; please consult your financial advisor and conduct your own analysis before executing any trades.

Nibe Ltd – Elliott Wave UpdateNibe Ltd – Elliott Wave Update
Nibe Ltd has reversed decisively from the 78.6% Fibonacci retracement, completing a textbook ABC corrective structure. The reversal was accompanied by clear bullish divergence on RSI and MACD, confirming exhaustion of the corrective phase.
Following the reversal:
Wave 1 of the new impulsive structure is complete
Wave 2 has unfolded as a shallow, time-wise correction
Price is now trading in Wave 3, supported by expanding momentum and rising volume
As long as price holds above the recent swing low (~₹1,030), the impulsive structure remains valid. Momentum indicators continue to support further upside, suggesting the trend is in an acceleration phase rather than exhaustion.
Trend Bias: Bullish
Structure: Impulsive (Wave 3 in progress)
Minimum Target: ₹1,700
Invalidation Level: Below the Wave-2 low

Reliance Industries Ltd – 1D Chart Update || Pattern-DrivenTimeframe: Daily (1D) || Pattern: Cup & Handle (Bullish)
LTP: ₹1,592
Reliance Industries is showing a classic Cup & Handle formation on the daily chart, indicating strong accumulation and a potential continuation of the prevailing uptrend. Price action remains constructive, supported by rising volumes and positive momentum indicators.
Key Technical Levels:
Support: ₹1,433 | ₹1,335
Resistance: ₹1,709 | ₹1,863
A sustained move above the handle breakout zone can open the door for further upside toward the mentioned resistance levels, while the supports act as crucial demand zones on any corrective pullback.
Company & Sector Updates:
Reliance continues to benefit from strength across its diversified businesses. The Oil-to-Chemicals segment is supported by favorable refining economics, while Jio and Retail remain long-term growth drivers. Strategic focus on technology, digital expansion, and new-age businesses like AI and FMCG strengthens the company’s future outlook. Market participants are also closely watching developments around value unlocking and upcoming strategic initiatives.
View:
Overall structure and fundamentals indicate a positive bias, with trend continuation likely as long as the stock holds above key support levels.
For analysis of any stock, feel free to comment the stock name below.
This analysis is for educational and informational purposes only. It does not constitute investment advice or a recommendation to buy or sell any security. Market investments are subject to risk, and past performance does not guarantee future results. Please consult a SEBI-registered financial advisor before making any investment decisions. The author is not responsible for any losses arising from the use of this information.

Market View: Strong Uptrend Confirmation for Indian MarketMarket View: Strong Uptrend Confirmation for Indian Market
Key Condition for a Sustainable Rally
For a high-confidence and low-failure bullish phase in the Indian stock market, both of the following must hold:
NIFTY 50 sustains above its All-Time High
RELIANCE sustains above its All-Time High
> These two act as the backbone of the Indian indices. When they move together, the probability of a broad-based rally increases significantly.
Why NIFTY + RELIANCE Together Matter
NIFTY represents overall market sentiment and institutional positioning
RELIANCE carries heavy index weight and reflects FII + DII conviction
When both are above ATH:
Distribution risk reduces
Pullbacks turn into buying opportunities
Trend failures become rare
Impact on Small-Cap & Mid-Cap Stocks
Once NIFTY and RELIANCE confirm strength:
Liquidity flows down the market cap ladder
Small-caps and mid-caps outperform
Sector rotation accelerates
Stocks start moving toward their own All-Time Highs
Breakout + momentum strategies work exceptionally well
> Historically, real wealth-creating phases begin only after large-cap leadership confirms.
Trading Strategy (Action Plan)
Prefer buy on dips, not shorting
Focus on:
Stocks near 52-week high / ATH
Strong relative strength vs NIFTY
Volume expansion on breakouts
Avoid counter-trend shorts in mid & small caps
Risk Note
If either NIFTY or RELIANCE fails to sustain above ATH, market may:
Turn sideways
Enter selective stock-specific moves
See false breakouts in small caps
> NIFTY + RELIANCE above All-Time High = Green signal for Indian Market.
This combination unlocks powerful momentum in small-cap and mid-cap stocks, pushing the broader market toward new highs.

Reliance Industries Limited Bullish Momentum BrewingTechnical Summary:
Trend: The market is currently in a short-term uptrend, with price respecting the ascending trendline drawn from recent lows.
Support Levels:
Immediate Support: ₹1,558–₹1,559 (recent consolidation area)
Stronger Support: ₹1,548–₹1,547 (key equilibrium/demand zone, highlighted in blue)
Resistance Levels:
First Resistance: ₹1,572–₹1,573 (recent highs, marked in red)
Next Major Resistance: ₹1,581 (historical supply zone)
Trade Idea:
Bias: Bullish – supported by trendline and rejection from lower support zones.
Chart Observations:
Trendline Support: Price continues to respect the ascending trendline, indicating potential for further upward momentum.
Supply & Demand Zones:
Red zones denote supply areas where price previously reversed.
Blue zone represents a strong demand/equilibrium area, providing solid support.
Candlestick Structure: Recent green candles signal buying pressure near support, suggesting that buyers are defending this level.

Reliance: Channel Breakdown Below 1535Details:
Asset: Reliance Industries Ltd (RELIANCE)
Breakdown Level: 1535
Potential Targets: 1470, lower levels if selling pressure continues
Stop Loss: 1570
Timeframe: Short-term
Rationale:
Reliance has broken below the key channel support at 1535, indicating a shift toward bearish momentum. If the price continues to sustain below this level, further downside toward 1470 or even lower levels is likely.
Market Analysis:
Technical Setup: Clean channel breakdown with strong bearish candles forming.
Momentum: Weakness observed across multiple timeframes, confirming selling pressure.
Risk Management:
Stop loss at 1570 to avoid getting trapped in any pullback.
Risk-Reward Ratio:
Favorable for short positions with clear breakdown and defined targets.
Monitor for continued weakness and volume confirmation to validate the bearish move.

Reliance Industries Ltd. - Stock AnalysisDate : 30-Nov-2025
LTP : Rs. 1,567.50
Technical View:
• NSE:RELIANCE is in primary uptrend since Apr 2025 and currently trading through it's secondary uptrend since 16-Oct-2025.
• After touching the high of 1,551 on 9-Jul-2025, it has retraced 14% to 1,340.60 level.
• NSE:RELIANCE has formed a Rounding Bottom Pattern and has breakout from it's neckline with higher than average volume on 26-Nov-2025. The Rounding Bottom Neckline is marked as 1st Resistance (R1) in chart and is placed at 1,551.
• NSE:RELIANCE is trading above 20 DEMA and 50 DEMA since last few weeks.
• MACD is trading at 30.91 and RSI is trading at 72.71.
• NSE:RELIANCE is looking bullish from here onwards.
• Resistance Levels: (R2) Rs. 1,608 --> (R3) Rs. 1,680 --> (R4) Rs. 1760
• Support Level: Rs. 1,461
If you have liked this analysis, please Like/Boost this idea and follow me for more ideas.
Disclaimer : I am not a SEBI registered analyst/consultant and not recommending anyone to take any BUY or SELL position in stock market. Investing in stock market is risky and one should do a self analysis and validation before investing in stock market. My ideas are published for learning purpose only and are available to everyone at no cost/charge.

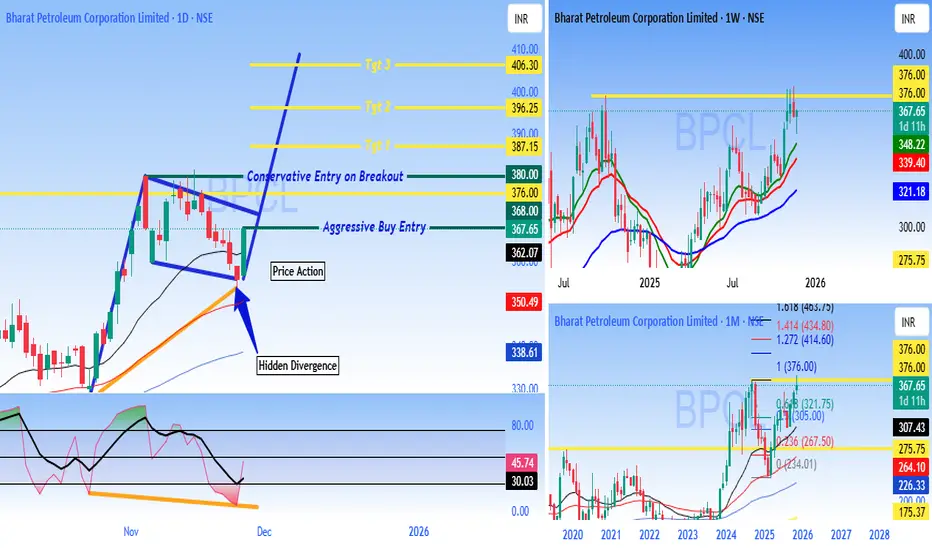
BPCL - Buy - ATH breakout - Technical Analysis#Bharat Petroleum Corporation Limited (BPCL) - #Technical Analysis Report
Current Price: 356.80 (Daily)
Multi-Timeframe Technical Analysis:
BPCL is displaying strong bullish momentum across multiple timeframes with a compelling technical setup featuring **Hidden Divergence** and a clear breakout structure on the daily chart.
Daily Chart Analysis - Key Technical Patterns:
1. Hidden Divergence Confirmed
- Classic Trend continuation signal indicating the uptrend is likely to resume with strength
2. Breakout Structure
- Stock has broken out from a consolidation zone around ₹362
- Currently trading above key resistance turned support
3. Trade Entry:
Aggressive Buy Entry:
As #Priceaction has formed already for traders who want immediate entry Buy will be active above 367.65
Conservative Entry on Breakout:
Initiate trades on candle close above 380
Price Targets
Target 1: 387.15
Target 2: 396.25
Target 3: 406.30
These targets are based on Fibonacci extensions and resistance zones from the pattern structure.
Weekly & Monthly Chart Context
Weekly Chart Shows:
- Strong uptrend since 2024 lows
- Stock trading near multi-year highs around 367-370 zone
- Higher highs and higher lows pattern intact
- Moving averages well-aligned in bullish configuration
Monthly Chart Indicates:
- Long-term recovery from 2020-2023 correction phase
- Breaking out from multi-year resistance zone
- Potential for extended rally toward ₹376-400 zone
Momentum Indicators
- Hidden divergence on daily timeframe = Bullish continuation
- Price action showing strength above key moving averages
- Volume expansion on breakout candles (positive sign)
- RSI/Momentum indicators supporting the upward move
The combination of bullish patterns and momentum indicators suggests potential for continuation toward higher targets. Traders should maintain strict risk management and adjust positions based on price action at key levels.
DISCLAIMER
This analysis is for educational and informational purposes only and should NOT be considered as investment advice or a recommendation to buy, sell, or hold any securities - I am NOT a SEBI registered analyst or investment advisor - This is purely a technical analysis based on chart patterns, indicators, and price action - Past performance and technical patterns do not guarantee future results - Trading and investing in stocks involves substantial risk of loss and may not be suitable for all investors - Always conduct your own research, due diligence, and analysis before making any investment decisions - Consult with a qualified financial advisor before taking any investment positions - The author/analyst holds no responsibility for any profits or losses incurred based on this analysis - Risk management is crucial - never invest more than you can afford to lose - Stop losses are mandatory for capital protection - Markets can remain irrational longer than you can remain solvent
Trade/Invest at your own risk. DYOR (Do Your Own Research).
#BPCL #TechnicalAnalysis #StockMarket #NSE #IndianStocks #Trading #HiddenDivergence #Breakout #OilAndGas #PSU #ChartAnalysis #TradingView #SwingTrading #DayTrading #PriceAction #StockTrading #MarketAnalysis #OMC #EnergyStocks #BullishSetup
Cup & Handle Breakout Opportunity in Reliance IndustriesReliance Industries, currently trading near ₹1518 on the weekly charts, is showing signs of a cup & handle breakout at the top of a consolidation zone. This pattern, combined with strong Relative Strength Index (RSI) readings across multiple timeframes, highlights a potential bullish opportunity.
🔍 What is a Cup & Handle Pattern?
Cup Formation:
Price declines, then gradually recovers, forming a rounded bottom resembling a “cup.”
Handle Formation:
A short consolidation or pullback after the cup, forming the “handle.”
Breakout Point:
When price breaks above the handle’s resistance, it signals continuation of the uptrend.
Reliance Industries Case:
Cup & handle is forming/completing at the top of consolidation.
Price is now ready to break out of the handle’s endpoint, suggesting bullish momentum.
📊 RSI Confirmation
The Relative Strength Index (RSI) is a momentum indicator that measures strength of price movements.
Key Levels:
Above 50 → Indicates bullish momentum.
Moving toward 70 → Signals strong upside strength.
Reliance Industries RSI:
Daily RSI trending above 50 and preparing to cross 70.
Monthly, weekly, and daily RSI all above 50, showing broad-based momentum.
This alignment across timeframes adds conviction to the breakout.
🎯 Learning Points for Traders
Pattern Recognition:
Cup & handle is a continuation pattern often seen before strong rallies.
Breakout above the handle confirms bullish intent.
Multi-Timeframe Analysis:
RSI above 50 across monthly, weekly, and daily charts strengthens the setup.
Multiple timeframe confirmation reduces false signals.
Momentum + Pattern Combination:
Chart patterns show structure, RSI confirms strength.
Together, they create a high-probability trading opportunity.
Risk Management:
Stop-loss can be placed below the handle’s low.
Avoid entering before breakout confirmation.
📝 Conclusion
Reliance Industries’ cup & handle breakout, supported by RSI strength across all timeframes, is a textbook example of how price patterns and momentum indicators work together. For learners, this case highlights the importance of combining technical structures with RSI confirmation to identify reliable breakout opportunities.

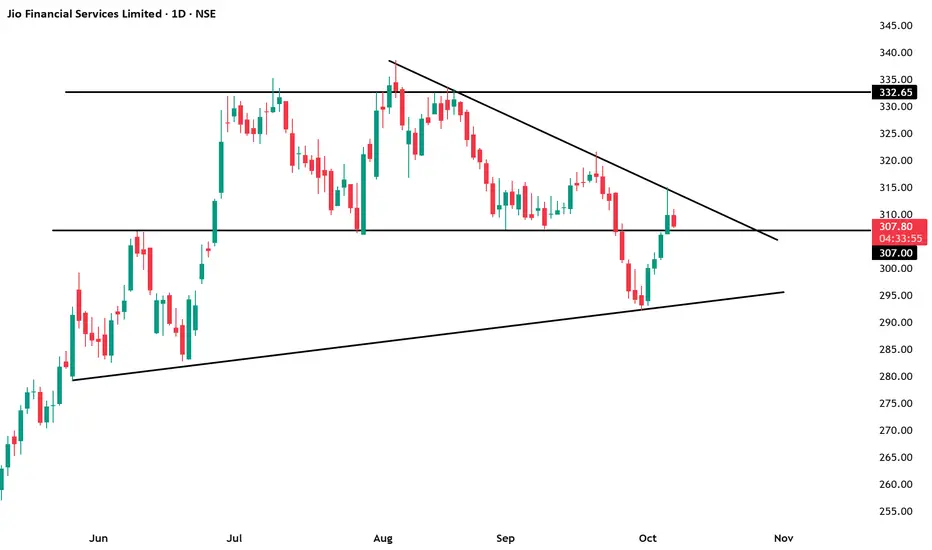
JIOFin Good to keep on RadarNSE:JIOFIN
JioFin has been Consolidating for long time; it's good to keep on radar as we are expecting BO soon
⚠️ Disclaimer:
This analysis is for educational and informational purposes only.
We are not SEBI-registered analysts or advisors.
This is our personal view based on available data and market trends.
Please consult your SEBI-registered investment advisor before making any investment or trading decisions.
You are solely responsible for any financial decisions you make based on this content.
========================
Trade Secrets By Pratik
========================
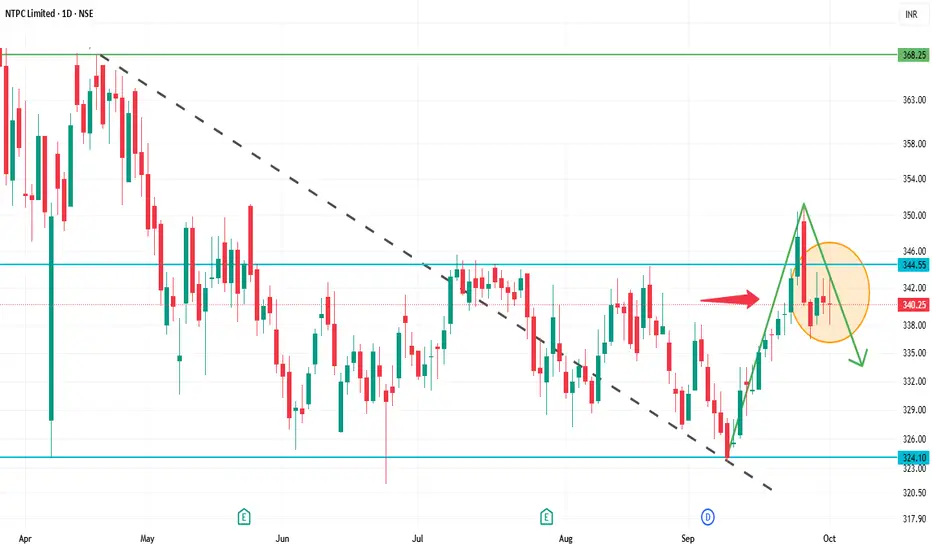
NTPC 1D Time frameCurrent Snapshot
Current Price: ₹340.25
52-Week High: ₹447.75
52-Week Low: ₹292.80
Strategy & Outlook
Bearish Bias: The stock is in a short-term downtrend with negative momentum indicators.
Selling Opportunity: Consider selling near resistance zones (₹343–₹345) with a target towards ₹335–₹340.
Risk Management: Place stop-loss orders above the resistance levels to manage potential upside risks.
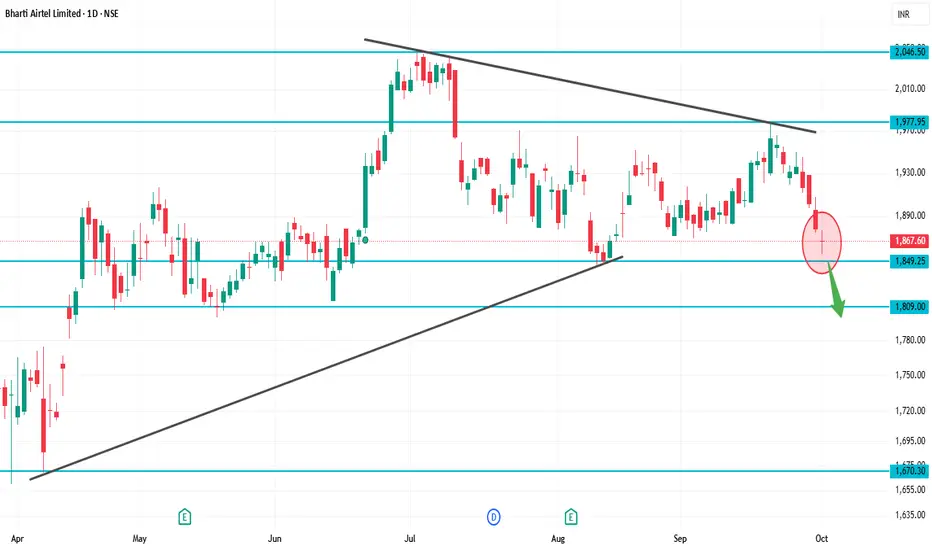
BHARTIARTL 1D Time frameCurrent Price: ~₹1,867
52-Week High: ~₹2,045
52-Week Low: ~₹1,511
Explanation
At ₹1,867, Airtel is just above immediate support (₹1,840–1,850).
If buyers hold this support, stock may bounce back toward ₹1,900+.
But if ₹1,840 breaks, then downside may open toward ₹1,800–1,750.
For bulls, a clean breakout above ₹1,920–2,000 is needed for fresh rally.
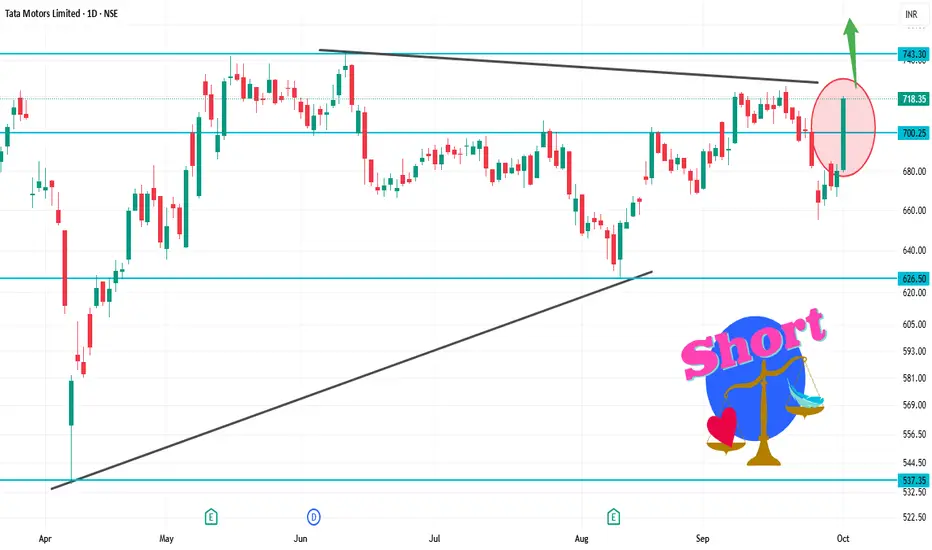
TATAMOTORS 1D Time frameCurrent Price: ₹718
Day Range (today): Around ₹705 – ₹725
52-Week Range: ₹535 – ~₹1,000
📏 Key Levels with ₹718 in focus
Immediate Resistance: ₹750 – ₹800 (needs breakout above this zone)
Current Level: ₹718 → price is right between support and resistance
Immediate Support: ₹700 – ₹705 (if broken, could fall further)
Next Support: ₹650 – ₹660 (major zone to watch)
🧠 What this means
Since price is just above support (₹705) and below resistance (₹750), it’s at a decision point.
If Tata Motors holds above ₹705–₹710, buyers may try to push toward ₹740–₹750.
If it fails and breaks below ₹705, price may revisit ₹660 levels.
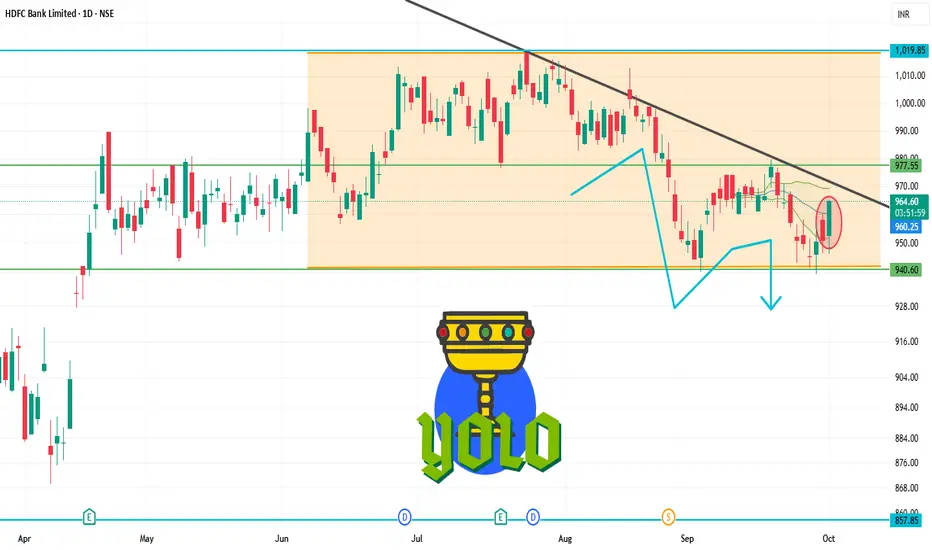
HDFCBANK 1D Time frameOpening Price: ₹950.30
Closing Price: ₹960.45
Day Range: ₹946.00 – ₹961.40
Previous Close: ₹950.30
🧠 Price Action Insights
The stock is trading below key moving averages, confirming the bearish trend.
No significant reversal pattern has formed, suggesting the downtrend may continue.
Watch for a breakout above ₹970.00 for a potential trend reversal.
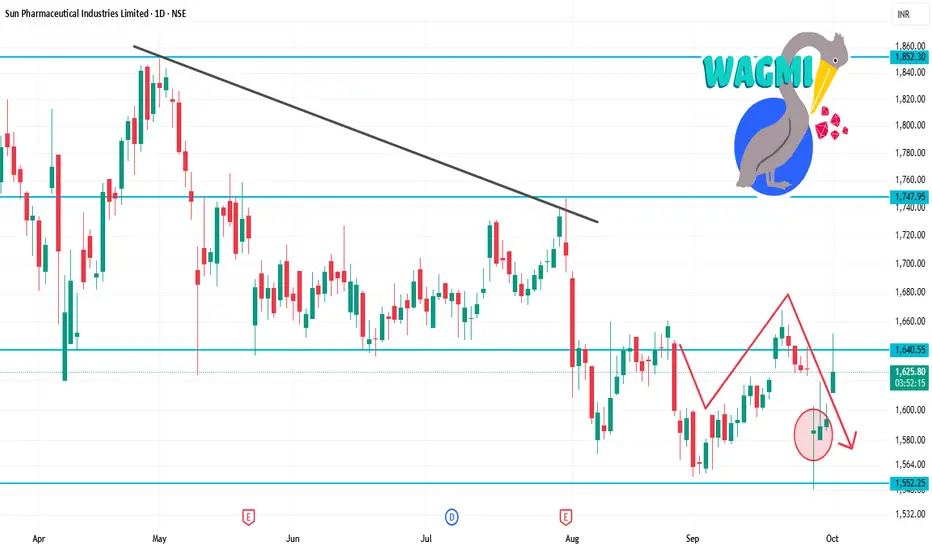
SUNPHARMA 1D Time frameOpening Price: ₹1,611.90
Closing Price: ₹1,628.20
Day Range: ₹1,611.90 – ₹1,651.50
Previous Close: ₹1,594.30
📉 Trend Analysis
Short-Term Trend: Bearish — The stock is trading below key moving averages, confirming the bearish trend.
Medium-Term Trend: Neutral — The stock is in a consolidation phase, characterized by lower highs and lower lows.
Long-Term Trend: Neutral — No significant trend identified; the stock is trading within a range.
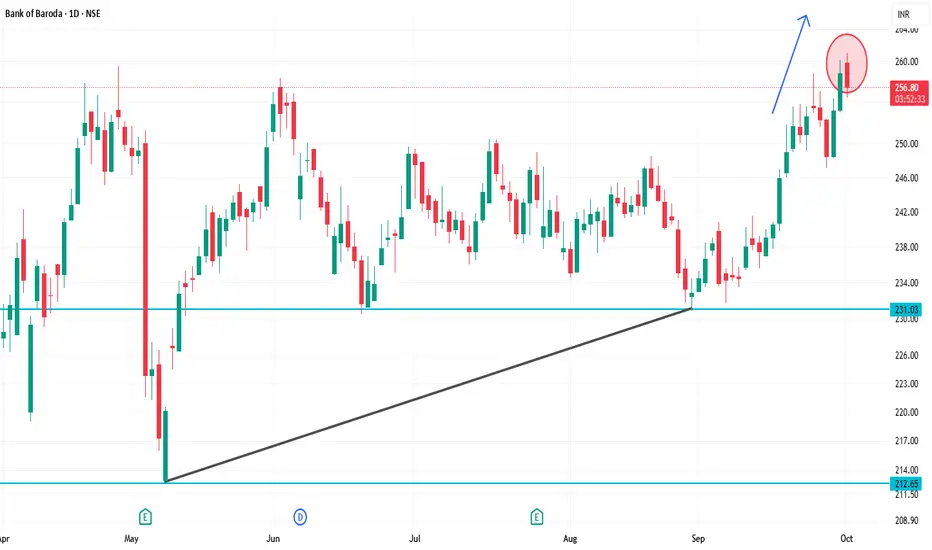
BANKBARODA 1D Time frameClosing Price: ₹257.60
Day Range: ₹253.70 – ₹260.00
Previous Close: ₹258.54
📉 Trend Analysis
Short-Term Trend: Bearish — The stock is trading below key moving averages, confirming the bearish trend.
Medium-Term Trend: Neutral — The stock is in a consolidation phase, characterized by lower highs and lower lows.
Long-Term Trend: Neutral — No significant trend identified; the stock is trading within a range.
🔮 Conclusion
Bank of Baroda is in a bearish trend with weak momentum.
Break below ₹250.00 could lead to further decline toward ₹245.00.
Break above ₹265.00 would indicate a potential trend reversal.
HEROMOTOCO 1D Time frame📌 Current Status
Closing Price: ₹5,410
Day Change: –35 points (–0.64%)
Day’s High: ₹5,470
Day’s Low: ₹5,380
52-Week Range: ₹4,800 – ₹6,050
🔍 Chart & Price Action Insights
Price is moving sideways, bouncing between support and resistance.
Bulls are defending ₹5,380
Sellers resist above ₹5,470
Watch for a break above ₹5,470 for potential upward momentum
Break below ₹5,380 may trigger a short-term decline toward ₹5,330

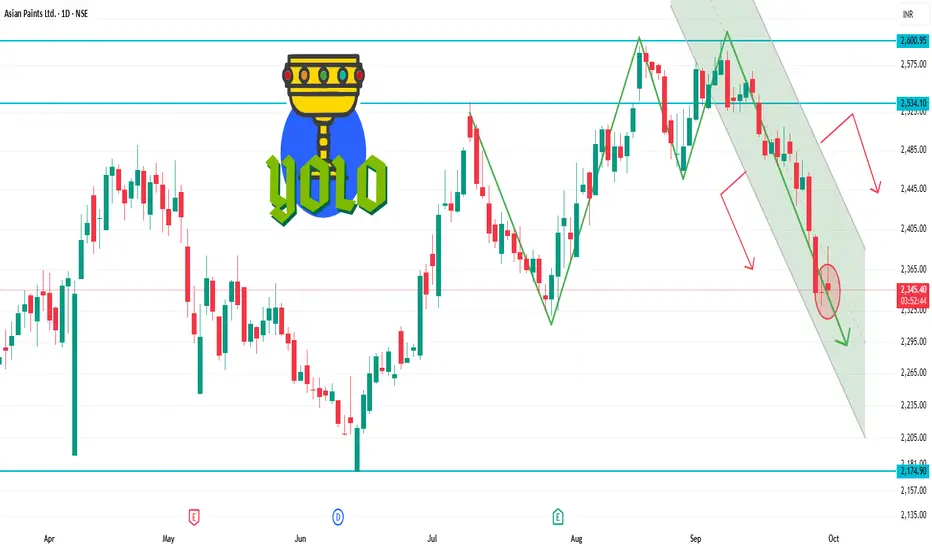
ASIANPAINT 1D Time frameCurrent Price Snapshot
Current Price: ₹2,345.50
Day’s Range: ₹2,342.00 – ₹2,388.80
52-Week Range: ₹2,124.75 – ₹3,358.00
Technical Indicators
RSI (14-day): 44.19 — indicates a neutral to slightly bearish momentum.
MACD: -4.010 — suggests bearish momentum.
Moving Averages:
5-day: ₹2,396.00 — indicates a Sell signal.
50-day: ₹2,389.00 — indicates a Sell signal.
200-day: ₹2,350.00 — indicates a Neutral signal.
Technical Summary: Predominantly Sell signals across various indicators.
Summary
Above ₹2,388.80: Potential rise toward ₹2,400 – ₹2,420.
Below ₹2,342.00: Potential fall toward ₹2,320 – ₹2,300.
Between ₹2,300 – ₹2,380: Likely range-bound movement.
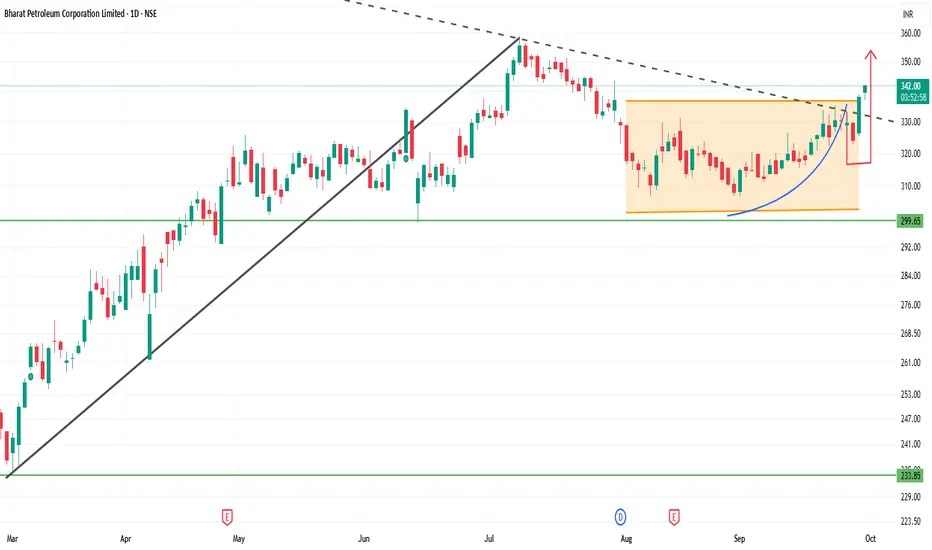
BPCL 1D Time frameCurrent Price Snapshot
Last Traded Price: ₹340.20
Day’s Range: ₹337.15 – ₹340.85
52-Week Range: ₹234.01 – ₹373.35
Technical Indicators
RSI (14-day): 53.27 — indicates a neutral momentum.
MACD: 2.49 — suggests a bullish trend.
Moving Averages:
5-day: ₹327.97 — indicates a Sell signal.
50-day: ₹322.14 — indicates a Buy signal.
200-day: ₹296.14 — indicates a Buy signal.
Pivot Points:
Support: ₹327.13
Resistance: ₹337.93
Summary
Above ₹340.85: Potential rise toward ₹345 – ₹350.
Below ₹337.15: Potential fall toward ₹330 – ₹325.
Between ₹330 – ₹340: Likely range-bound movement.
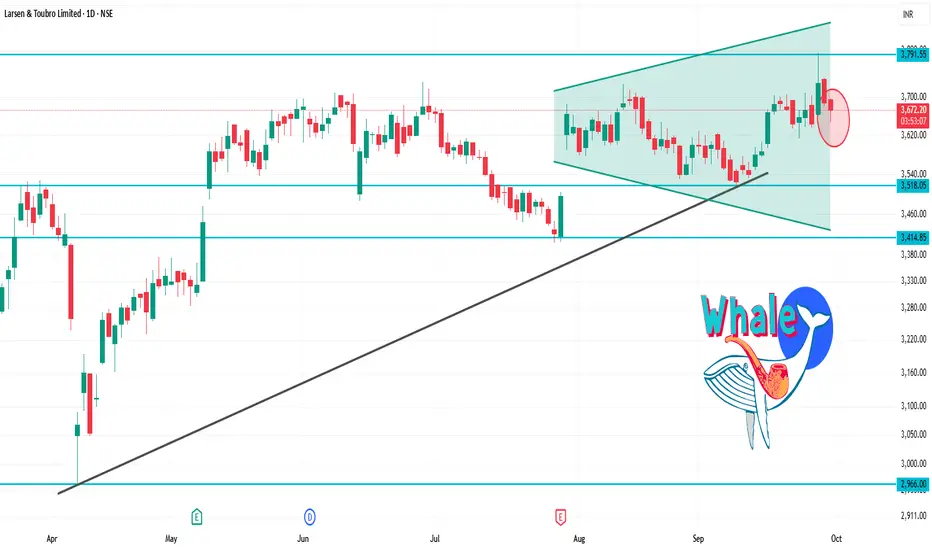
LT 1D Time frameCurrent Price: ₹3,655.30
Day’s Range: ₹3,648.00 – ₹3,696.60
52-Week Range: ₹2,965.30 – ₹3,963.50
Technical Indicators
RSI (14-day): 41.19 — indicates a neutral to slightly bearish momentum.
MACD: -1.47 — suggests bearish momentum.
Moving Averages: Mixed signals — short-term averages are bearish, while long-term averages are bullish.
Technical Summary: Predominantly Sell signals across various indicators.