RELIANCE – Positive Outlook Post Q1 Results with Bullish OI________________________________________________________________________________📈 RELIANCE – Positive Outlook Post Q1 Results with Bullish OI Confirmation
📅 Setup Date: 17.07.2025 | ⏱ Timeframe: Daily
📍 Strategy: Post-Earnings Momentum Setup with Defined Risk
________________________________________________________________________________
🔍 Overall View
Spot Price: ₹1476
Q1 Result Update: Profit ↑12% YoY, beat estimates — strong earnings trigger
Trend: Bullish Reversal – Price holding above 1470 with fresh long build-up in CEs
Volatility: IV ~23–27%, stable to slightly rising → good for directional plays
Ideal Strategy Mix: Bullish directional spreads or high delta long CE
________________________________________________________________________________
1️⃣ Bullish Trade
Best CE: Buy 1480 CE @ ₹25.15
Why:
• Long Build-Up (+60.38% OI) with price ↑3.5% — strong institutional buying
• At-the-money with delta 0.50 → responsive to price movement
• High OI (27.5 lakh) with active volumes confirms smart money activity
• Matches post-result momentum — ideal CE for breakout strategy
________________________________________________________________________________
2️⃣ Bearish Trade (Contrarian)
Best PE: Sell 1450 PE @ ₹10.75
Why:
• Short Covering seen (-5.57% OI) → downside hedge positions getting closed
• Price ↑3.3% and IV stable (22.36%) → premium erosion favorable
• Spot is comfortably above ₹1450, providing buffer
• Rests below key support zone post-result → limited downside expectation
________________________________________________________________________________
3️⃣ Strategy Trade (As per trend + OI data)
Strategy: Bull Call Spread → Buy 1480 CE / Sell 1520 CE
→ ₹25.15 / ₹8.85
Net Debit: ₹16.30
Max Profit: ₹40 – ₹16.30 = ₹23.70
Max Loss: ₹16.30
Risk:Reward: ≈ 1 : 1.45 ✅
Lot Size: 500
Total Risk: ₹8,150
Max Profit: ₹11,850
📊 Breakeven Point: ₹1496.30
📉 Exit If: Spot closes below ₹1465 (invalidates CE strength and post-result optimism)
________________________________________________________________________________
Why:
• Strong Q1 numbers + fresh long build-up on 1480 CE and 1470 CE
• 1520 CE also active but minor short covering = good candidate to sell
• IVs are moderate, giving clean pricing for spreads
• Defined risk, R:R > 1:1, and positive delta makes this strategy safer
________________________________________________________________________________
📘 My Trading Setup Rules
Avoid Gap Plays
→ Check pre-open price action to avoid trades influenced by gap-ups/gap-downs.
Breakout Entry Only
→ Enter trades only if price breaks previous day’s High (for bullish trades) or Low (for bearish trades).
Watch Volume for Confirmation
→ Monitor volume closely. No volume = No trade.
Enter on Strong Candle + Volume
→ Execute the trade only if a strong candle appears with increasing volume in the direction of the trade.
Defined Risk:Reward Only
→ Take trades only if R:R is favourable (ideally ≥ 1:2).
Premium Disclaimer
→ Option premiums shown are based on EOD prices — real-time premiums may vary during execution.
Time Frame Preference
→ Trade with your preferred time frame — this strategy works across intraday or positional setups.
________________________________________________________________________________
⚠ Disclaimer (Please Read):
• These Trades are shared for educational purposes only and is not investment advice.
• I am not a SEBI-registered advisor.
• The information provided here is based on personal market observation.
• No buy/sell recommendations are being made.
• Please do your own research or consult a registered financial advisor before making any trading decisions.
• Trading involves risk. Always use proper risk management.
I am not responsible for trading decisions based on this post.
________________________________________________________________________________
Relianceanalysis
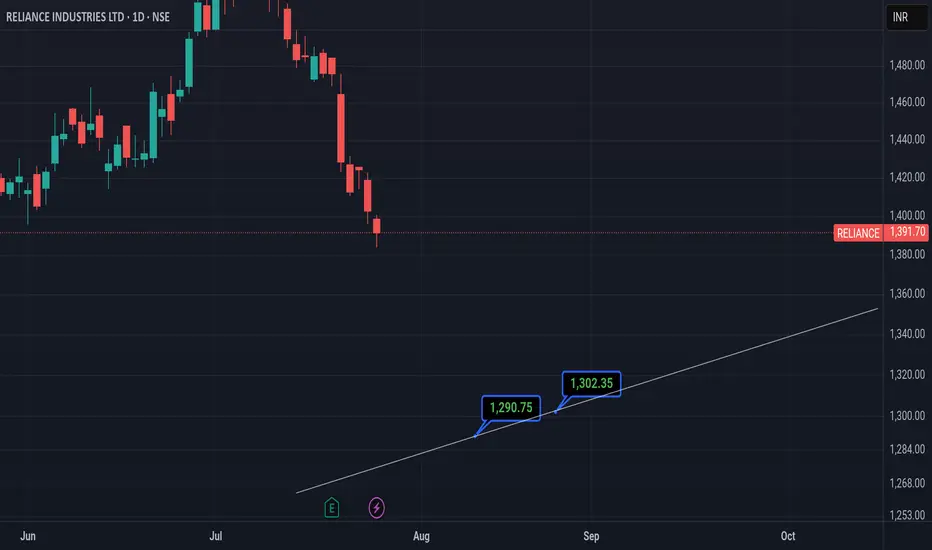
RELIANCE INDUSTRIES Reliance could fall 📉 to 1290 or to the white line within 11th August or if there's some deviation then it could fall within 25th August 2025
Disclaimer:
It's a personal view not a financial advice and I assume no responsibility and liability whatever outcome arises.
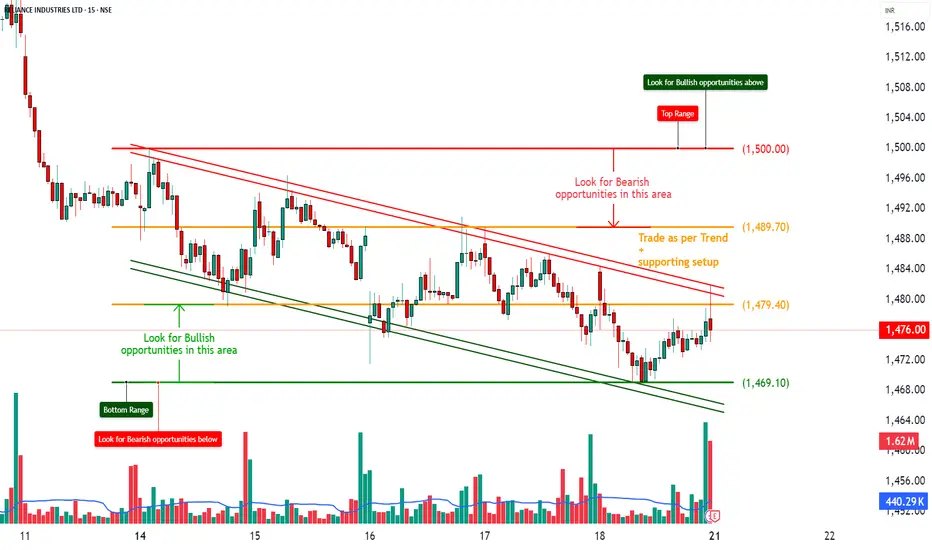
RELIANCE – Trapped Between Strikes📈 RELIANCE – Trapped Between Strikes | Option Chain + Price Action Insights
🕒 Chart Type: 15-Minute
📆 Date: July 3, 2025
________________________________________
🔍 What’s Catching Our Eye:
RELIANCE is hovering just above ₹1,517.8 and facing resistance from rising short positions on Calls across 1540–1580 levels. Despite minor short covering at the 1500 and 1520 CEs, fresh Short Build-Up is visible across most strikes, suggesting upward moves are being capped. On the flip side, Puts between 1500–1530 are also witnessing Short Build-Up, indicating traders aren't expecting a major breakdown either.
________________________________________
📌 What We’re Watching For:
RELIANCE appears range-bound, and clear directional strength is missing. Price needs to decisively break above ₹1,540 for bullish strength to materialize. On the downside, support exists around ₹1,500, but if that breaks, expect pressure to mount quickly.
________________________________________
📊 Volume Footprint:
Heavy volume on both sides:
• 13k+ contracts at 1520 CE
• 11k+ contracts at 1600 CE
• Over 9k contracts traded at 1500–1530 PE
→ Traders are actively betting on both sides, suggesting volatility ahead.
________________________________________
📈 Option Chain Highlights:
• Call Side:
o 1530 CE → Long Build-Up (+2.45% OI)
o 1540 CE → Long Build-Up (+2.45%)
o 1550–1580 CE → Short Build-Up, signaling resistance buildup
o 1520 CE → Short Covering
• Put Side:
o 1500–1530 PE → Short Build-Up, hinting at base support around 1500
Inference: The tug-of-war is real. Calls are being written at higher strikes while Puts are being sold at lower strikes. That creates a tight range of ₹1,500–1,540, with traders unsure of breakout direction.
________________________________________
🔁 Trend Bias:
🟡 Neutral to Slightly Bullish – Only if ₹1,540 is reclaimed with volume
________________________________________
🧠 Trade Logic / Reasoning:
Price is squeezed between the ₹1,500 Put writers and ₹1,540+ Call writers. This is a textbook “compression zone” where a breakout or breakdown may soon follow. If bulls want control, they must push above ₹1,540 with volume and follow-through. Else, expect the sideways to weak bias to continue.
________________________________________
📍 Important Levels to Mark:
🔺 Top Range (Resistance): ₹1,540 – Break & sustain needed for upside
🔻 Bottom Range (Support): ₹1,500 – Breakdown will shift sentiment bearish
________________________________________
🎯 Trade Plan (Educational Purpose Only):
✅ Best Buy (Equity): Only above ₹1,540 with confirmation
✅ Best Sell (Equity): If price breaks below ₹1,500
✅ Best CE to Long: 1530 CE – Strong long build-up with good delta
✅ Best PE to Long: Avoid – PE sellers still active; no breakdown confirmed
🟢 Demand Zone: NA
🔴 Supply Zone: NA
⚠️ Invalidation Below:
Bullish view invalid if price fails at ₹1,540 or slips below ₹1,500 with volume
________________________________________
⚠️ Disclaimer:
This analysis is for educational purposes only.
STWP is not a SEBI-registered advisor.
No buy/sell recommendations are made.
Please consult your financial advisor before trading.
STWP is not responsible for any trading decisions based on this content.
________________________________________
💬 Found this helpful?
Drop your feedback in the comments ⬇️
🔁 Share with traders who track RELIANCE
✅ Follow STWP for consistent zone + option chain insights
🚀 Let’s trade smart, with patience and clarity!

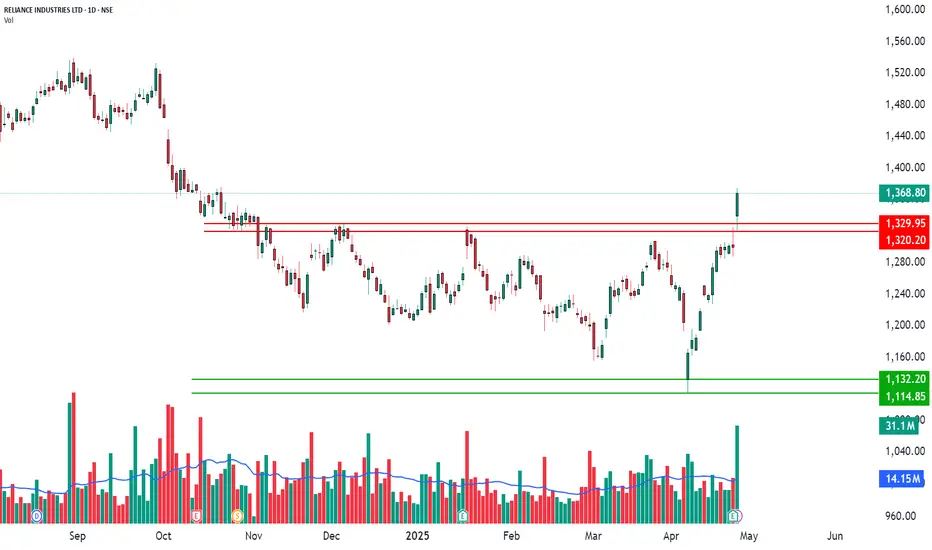
Strong Bullish Breakout! | Daily Time Frame📈 RELIANCE INDUSTRIES LTD – Strong Bullish Breakout!
📅 Date: April 28, 2025
📈 Timeframe: Daily Chart
🔍 Stock: Reliance Industries Ltd (NSE)
📌 Technical Overview:
Reliance Industries has shown strong bullish momentum after breaking out above the important level of ₹1300.90.
Several indicators are supporting this breakout:
✅ RSI Breakout – Showing strong strength.
✅ Bollinger Bands Breakout – Price is breaking outside the bands, showing heavy momentum.
✅ Bullish VWAP Trend – Price is trading well above the VWAP line.
✅ TTM Squeeze Breakout – Major squeeze breakout confirms buyers' control.
🧩 Key Levels:
Major Resistance Broken: ₹1300.90 ✅
Immediate Support Now: ₹1329.95 and ₹1320.20 (red lines)
Next Possible Support: ₹1132.20 and ₹1114.85 (green lines, if reversal happens later)
📊 Volume Analysis:
Heavy spike in volume confirming strong buying activity.
🧠 Observational Bias:
As long as the price stays above ₹1300.90, the momentum remains bullish.
Small dips toward support can be seen as healthy pullbacks.
RELIANCE INDUSTRIES – Buying Zone Test with Reversal PotentialRight now, the stock is respecting a long-standing falling channel, and it has just bounced off the lower boundary of the pattern near the marked Buying Zone.
The stock has been consolidating for the past 9 months inside a downward-sloping channel, and this retest could serve as the ignition point for a trend reversal.
All important levels have been marked on the chart.
Looking at the price action and structure, there's a high probability that RELIANCE can move towards ₹1,325 in the coming weeks if the reversal holds.
Volume surged near the bottom, hinting at smart money accumulation. Entering near ₹1,110–₹1,120 zone gives a solid
Risk: Reward :: 1 : 3.3
Support Levels:
🔹 ₹1,165 – Minor demand zone
🔹 ₹1,110 – Major support and channel lower trendline
🔹 ₹1,085 – Last swing low, demand base
Resistance Levels:
🔹 ₹1,204 – First level of resistance
🔹 ₹1,280 – Mid-channel upper zone
🔹 ₹1,325 – Short-term breakout target
Reasons:
✅ 9-month falling channel
✅ Strong bounce off major support (Buying Zone)
✅ RSI rebounding from oversold territory
✅ Volume spike at support = potential smart money entry
✅ Favorable R:R for positional entry
✅ Potential early reversal before breakout
News & Sentiment:
No major negative news post-recent drop. The correction seems technical, and long-term sentiment remains optimistic especially around expected earnings and energy sector momentum.
Verdict:
Bullish
Plan of Action:
Enter on strength above ₹1,175 or on dip near ₹1,120 zone with volume confirmation.
BUY: ₹1,120–₹1,175
Stoploss: ₹1,085
Target: ₹1,325
Trailing SL: ₹25–₹30

Reliance | Upcoming Possible MovementsCurrently stock trading at support area (multiple time frames) of 1280
A small upside possible from here
But as we can see it has broken a trend line / channel, so any pullback on upside may trigger a fresh selling for the downside strong support area of 1260 (as it also happens to be a flip zone)
1260 can be considered as a strong support area
Any sideways accumulation on that area will possible trigger a strong upside movement
Lower time frame confirmation must be taken before entering at any levels

"Reliance on the Move: Is This the Start of a Major Reversal?"📢 Market Sentiment Poll: Where Do You See Reliance Industries Heading?
🔘 Bullish – Potential upside towards ₹1,400+ 🚀
🔘 Neutral – Likely to consolidate 📊
🔘 Bearish – Could dip below ₹1,200 📉
💬 Share your market insights in the comments! This poll is for educational purposes only and does not constitute financial advice. Always conduct your own research before making investment decisions.

Reliance Inds cmp 1252.50 by Daily Chart viewReliance Inds cmp 1252.50 by Daily Chart view
- Price Band 1165 to 1185 Support Zone
- Resistance Zone 1250 to 1280 Price Band

Reliance Chart Spark Fire in the Upcoming Trading Season! Buy Reliance If Break 50-Day's Moving Average -1272 And Hold Closing Basis. Buy With Stop - 1240, For Target - 1350.

Reliance - Stuck in the ZoneWith downside support at 1270 & 1235
and upside resistance at 1300 & 13301
Reliance currently is stuck in the zone
Though trend has been broken with a force
it still needs to fill the gap created before moving ahead
Expecting it to remain sideways for a brief period of time til it breaks strong resistance or strong support

Reliance Inds cmp 1267.60 by Weekly Chart viewReliance Inds cmp 1267.60 by Weekly Chart view
- Stock has formed Bearish Rounding Bottom
- Support Zone seen at 1050 to 1100 Price Band
- Support Zone 1250 to 1300 Price Band turning into Resistance Zone
- Stock might probably show more downside by the Technical Chart setup
- Weekly Basis : Support at 1195 > 1100 > 995 with Resistance at 1360 > 1445 >1535 > ATH 1608.80
- Stock Price gone well below the crossover of both the Falling Resistance Trendline and also the Rising Support Trendline been broken down

Reliance - Strong support areaStock standing at strong support area
2710-2750 support zone
2900-2925 resistance zone
Stock may go sideways first then may start the journey towards upside again
wait for at least 1 HH HL of a good buying candle in this time frame recommended

Reliance Trend line breakout##Reliance at Trend line resistance in Daily Time Frame if give breakout then it can lead to upper levels & also help Nifty too.
Target will be 3044, 3111, 3155 & 3211 with Stoploss of 2955.
Thank you & Trade with proper Risk Management. Happy Trading#

Reliance Industries ViewOn Daily Chart Reliance Industries is in range since Aug'21. Expected to breakout in coming days. Tgt & SL for the same is mentioned on chart.

Reliance Industries Ltd - Breakout OpportunityDate : 20-Aug-2024
LTP : Rs. 2,991.90
Targets: (1) Rs. 3,217 --> (2) Rs. 3,434
SL : Rs. 2,768 on daily close basis
Technical View:
• NSE:RELIANCE is in it's primary uptrend and was recently going through it's secondary downtrend.
• After touching the high of 3,217.60 on 8-Jul-2024, it has retraced 11% to 2,866.50 level.
• On 19-Aug-2024, NSE:RELIANCE has broke out from its secondary down trend with higher than average volume and closed above 20 DMA.
• On 20-Aug-2024, RSI has entered the buy zone and trading at 50.78.
• On 20-Aug-2024, MACD has crossed over it's signal line.
• Looking good to start a new swing from here.
Like the analysis? Boost/Like the idea and follow my ID.
Disclaimer : I am not a SEBI registered analyst/consultant and not recommending anyone to take any BUY or SELL position in stock market. Investing in stock market is risky and one should do a self analysis and validation before investing in stock market. My ideas are published for learning purpose only and are available to everyone at no cost/charge.

RELIANCE INTRADAY TRADE 19TH AUG | BUY ABOVE 2970Buy Reliance tomorrow if sustains above 2970 for the targets of 3000 and 3030 until 2934 is intact on the downside.
To motivate us, Please like the idea If you agree with the analysis.
Happy Trading!
InvestPro India

Reliance Industries Approaching Key Demand ZoneReliance Industries ( NSE:RELIANCE ) is approaching a significant daily demand zone. This demand zone is noteworthy due to its historical impact: following its formation, Reliance has broken through previous resistance levels and reached an all-time high.
Key Observations:
Strong Demand Zone: The current demand zone has demonstrated substantial strength in the past. Its formation preceded a major breakout to new all-time highs, highlighting its robustness.
Breakout Confirmation: After this demand zone formed, Reliance surpassed its previous resistance levels, underscoring the demand zone’s significance in driving the upward momentum.
Opportunity: Given the strength of this demand zone, the current price level presents a potential high-reward trading opportunity. Entering trades at this demand zone could offer an advantageous risk-reward ratio.
Disclaimer: This analysis is for informational purposes only and does not constitute trading advice. Always conduct your own research and consult with a financial advisor before making investment decisions.

#RELIANCE BREAKDOWN 15/07/2024RELIANCE as we expected. still intact on the upside view of a continuous bullish uptrend rally. there are vari some break even point target levels at 3210,3250 or 3300 may be touching the highest level before The Union Budget on 22 July 2024. Be aware of the market crash, And trade with risk 1:2,1:3,1:4,5,6........ profit always be on your side.

Short Term Trading Opportunity in Reliance Ind or >7% upsideHi,
NSE:RELIANCE has given a Bullish Flag Breakout on Daily charts with very good volume.
MACD is also on the bullish side on Daily and Monthly time frames. RSI is also on the bullish side on daily, weekly and monthly time frames.
In the current market scenario, I am expecting that the bullish momentum will continue.
Complete price projection like entry, stop loss and targets mentioned on the charts for educational purpose.
Don't Forget to Follow me to get all the updates.
Please share your feedback or any queries on the study.
Disclaimer: Please consult your financial advisor before making any investment decision.

Head and shoulder in Reliance Industries.Major support levels :- 2575, 2550, 2531
Resistance:- 2600, 2620
If it takes out the upper level of 2620 and closes above it on weekly chart, it can give nice up move. Positional stock or stock future trades can be initiated.
Intraday trades can be taken on both the side. Bearish trade for an intraday trade can be initiated on the breakdown of the H&S pattern on the hourly candle close.
Wait for the price action near the levels before trading.

RELIANCE LOOKING GOOD FOR 2940 AND ABOVEBuy Reliance above 2860 for the targets of 2940, 2965 and 3000 until 2765 is intact on the downside.
To motivate us, Please like the idea If you agree with the analysis.
Happy Trading!
InvestPro India

RELIANCE In Reliance stock we can see a RSI divergence and its trading in a triangle pattern, if the tringle pattern break bellow 2900 level then we can see a decent profit booking in Reliance which is approximately 100 points. Given are the entry and exit point.
Note : All the given ideas are educational purpose only do invest wisely.
@Nifty_50_ #nifty #banknifty #stockmarket #nifty50

FALL EXPECTED IN RELIANCEReliance industries in trading in a channel and taking a short trend near upper channel with SL above the resistance zone has potential of giving good profits.
Sell - 2750 - 2740
SL - 2800
Targets - 2635, 2585
Please like the idea If you agree with the analysis, your like will motivate us to share more ideas on Tradingview.
Happy Trading!
InvestPro India
