Reliance IndustriesReliance has broken an important level marked in Red dashed line, which will now act as a resistance, It is sustaining below this level which could be bearish sign,
So if it rejects from the yellow dashed line at 1466 and breaks the white dashed line at 1445 level then it could test below key support at 1380 marked on the chart or to the green dashed line .
Disclaimer :
It's a personal view not a financial advice and I assume no responsibility and liability whatever outcome arises.
Relianceforecast

Reliance: Channel Breakdown Below 1535Details:
Asset: Reliance Industries Ltd (RELIANCE)
Breakdown Level: 1535
Potential Targets: 1470, lower levels if selling pressure continues
Stop Loss: 1570
Timeframe: Short-term
Rationale:
Reliance has broken below the key channel support at 1535, indicating a shift toward bearish momentum. If the price continues to sustain below this level, further downside toward 1470 or even lower levels is likely.
Market Analysis:
Technical Setup: Clean channel breakdown with strong bearish candles forming.
Momentum: Weakness observed across multiple timeframes, confirming selling pressure.
Risk Management:
Stop loss at 1570 to avoid getting trapped in any pullback.
Risk-Reward Ratio:
Favorable for short positions with clear breakdown and defined targets.
Monitor for continued weakness and volume confirmation to validate the bearish move.

Reliance Industries: Short pattern 1409_1418 stop 1445Reliance Industries: Short pattern 1409_1418 stop 1445 near support is 1326..
It's just a learning basis the trend and technical analysis.
Keep watching out here👍

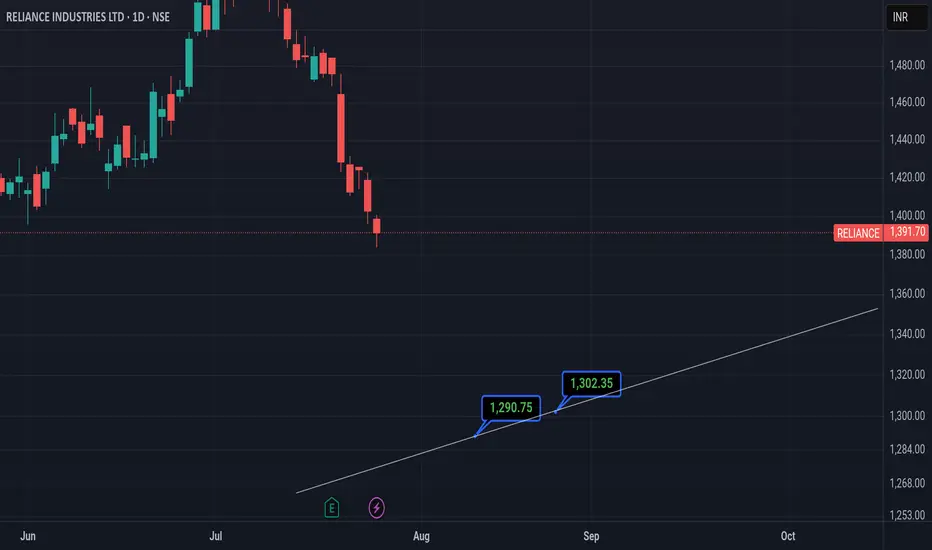
RELIANCE INDUSTRIES Reliance could fall 📉 to 1290 or to the white line within 11th August or if there's some deviation then it could fall within 25th August 2025
Disclaimer:
It's a personal view not a financial advice and I assume no responsibility and liability whatever outcome arises.
Reliance industries Ltd bullish up +4%....According to weekly analysis it will reach 1500 area within this week.
At the same time nifty is also in bullish view.
I am going to position myself in reliance bullish trend.
1490 to 1500 is going to a major resistance area .

RELIANCE INDUSTRIES – Buying Zone Test with Reversal PotentialRight now, the stock is respecting a long-standing falling channel, and it has just bounced off the lower boundary of the pattern near the marked Buying Zone.
The stock has been consolidating for the past 9 months inside a downward-sloping channel, and this retest could serve as the ignition point for a trend reversal.
All important levels have been marked on the chart.
Looking at the price action and structure, there's a high probability that RELIANCE can move towards ₹1,325 in the coming weeks if the reversal holds.
Volume surged near the bottom, hinting at smart money accumulation. Entering near ₹1,110–₹1,120 zone gives a solid
Risk: Reward :: 1 : 3.3
Support Levels:
🔹 ₹1,165 – Minor demand zone
🔹 ₹1,110 – Major support and channel lower trendline
🔹 ₹1,085 – Last swing low, demand base
Resistance Levels:
🔹 ₹1,204 – First level of resistance
🔹 ₹1,280 – Mid-channel upper zone
🔹 ₹1,325 – Short-term breakout target
Reasons:
✅ 9-month falling channel
✅ Strong bounce off major support (Buying Zone)
✅ RSI rebounding from oversold territory
✅ Volume spike at support = potential smart money entry
✅ Favorable R:R for positional entry
✅ Potential early reversal before breakout
News & Sentiment:
No major negative news post-recent drop. The correction seems technical, and long-term sentiment remains optimistic especially around expected earnings and energy sector momentum.
Verdict:
Bullish
Plan of Action:
Enter on strength above ₹1,175 or on dip near ₹1,120 zone with volume confirmation.
BUY: ₹1,120–₹1,175
Stoploss: ₹1,085
Target: ₹1,325
Trailing SL: ₹25–₹30

Reliance | Upcoming Possible MovementsCurrently stock trading at support area (multiple time frames) of 1280
A small upside possible from here
But as we can see it has broken a trend line / channel, so any pullback on upside may trigger a fresh selling for the downside strong support area of 1260 (as it also happens to be a flip zone)
1260 can be considered as a strong support area
Any sideways accumulation on that area will possible trigger a strong upside movement
Lower time frame confirmation must be taken before entering at any levels

"Reliance on the Move: Is This the Start of a Major Reversal?"📢 Market Sentiment Poll: Where Do You See Reliance Industries Heading?
🔘 Bullish – Potential upside towards ₹1,400+ 🚀
🔘 Neutral – Likely to consolidate 📊
🔘 Bearish – Could dip below ₹1,200 📉
💬 Share your market insights in the comments! This poll is for educational purposes only and does not constitute financial advice. Always conduct your own research before making investment decisions.

Reliance Chart Spark Fire in the Upcoming Trading Season! Buy Reliance If Break 50-Day's Moving Average -1272 And Hold Closing Basis. Buy With Stop - 1240, For Target - 1350.

Reliance - Is at attractive level to Buy & Invest nowRIL now around 1200-1250 levels is very good opportunity to buy and get invested for medium to long term profits. Price is at swing support and this low level was due to Elon entry into India and groupism by MF Manager to accumulate at lower levels. RIL recent land purchase at throwaway price and its business with NVDIA & Disney are few reasons to fetch more income to RIL. RBI mood to devalue to INR is +ve for RIL. Reliance is No - 1 company for 2 decades now. Stay Invested in this counter for good Profits. use this for educational purpose and consult your Advisor or take your own decision before Investing

Reliance Inds cmp 1205.30 Weekly Chart view by Negative Phase*Reliance Inds cmp 1205.30 by Weekly Chart view - Indicatively trailing thru negative phase*
- Stock has formed Bearish Rounding Top
- Resistance Zone 1250 to 1280 Price Band
- Interim Support Zone seen at 1165 to 1185 Price Band
- Next Good Support Zone is seen at 1045 to 1075 Price Band
- Volumes are steady but seen more on the selling side over past few weeks
- Stock Price broke down below Rising Support Trendline & well under Falling Resistance Trendline
- Weekly basis Support at 1145 > 1075 > 990 with the Resistance at 1298 > 1380 > 1490 > ATH 1608.80

RELIANCE ViewRELIANCE Chart Analysis
Monthly Chart shows it price is near trendline(TL) support. Need to watch what happens here.
Either Reverses from TL or falls upto 1000 monthly support.
RELIANCE at reversal Point + HDFCBANK at ATH BO retesting ---> Hope Nifty also moves higher.
Lets watch and see. Can trade in daily after reversal confirmation.
Note: No idea about Reliance fundamentals, anyway it is Bluechip stock.

Reliance - Stuck in the ZoneWith downside support at 1270 & 1235
and upside resistance at 1300 & 13301
Reliance currently is stuck in the zone
Though trend has been broken with a force
it still needs to fill the gap created before moving ahead
Expecting it to remain sideways for a brief period of time til it breaks strong resistance or strong support

Reliance Inds cmp 1267.60 by Weekly Chart viewReliance Inds cmp 1267.60 by Weekly Chart view
- Stock has formed Bearish Rounding Bottom
- Support Zone seen at 1050 to 1100 Price Band
- Support Zone 1250 to 1300 Price Band turning into Resistance Zone
- Stock might probably show more downside by the Technical Chart setup
- Weekly Basis : Support at 1195 > 1100 > 995 with Resistance at 1360 > 1445 >1535 > ATH 1608.80
- Stock Price gone well below the crossover of both the Falling Resistance Trendline and also the Rising Support Trendline been broken down

RELIANCE #RELIANCE
Daily Chart
Stock is trading near good accumulation zone
• Strong support zone technically and fibonaccically Bookmark it

Bearish trend starts in RelianceThe bullish crab pattern failed due to the poor Q2 results. Now, neckline breakout seen in weekly timeframe. Let's wait for the three more trading session to confirm the breakout. This is for educational purposes only.

Reliance - Intraday TradeSpecifically for Intraday only: 15-MTF
Bullish Trade
Trade the Strong Bullish Candle closing above Breakout Level
RSI should be 70 or more
Stop Loss to be below Breakout Candle
Look to book profit before target level
Bearish Trade
Trade the Strong Bearish Candle closing below Breakdown Level
RSI should be 30 or less
Stop Loss to be above Breakdown Candle
Look to book profit before target level
Trade with proper risk management

Reliance - Strong support areaStock standing at strong support area
2710-2750 support zone
2900-2925 resistance zone
Stock may go sideways first then may start the journey towards upside again
wait for at least 1 HH HL of a good buying candle in this time frame recommended

#RELIANCE: Big Investment Opportunity In Making±Dear Traders,
We are seeing some major correction on Reliance since last few weeks, in our technical view price is yet to drop further towards our designated buying zone. Expect a swift buy from our identified key level, even possible to see a continuous bull run taking price above 3500 region. If you agree to our view please like and comment for more.

Reliance Trend line breakout##Reliance at Trend line resistance in Daily Time Frame if give breakout then it can lead to upper levels & also help Nifty too.
Target will be 3044, 3111, 3155 & 3211 with Stoploss of 2955.
Thank you & Trade with proper Risk Management. Happy Trading#

RELIANCE INTRADAY TRADE 19TH AUG | BUY ABOVE 2970Buy Reliance tomorrow if sustains above 2970 for the targets of 3000 and 3030 until 2934 is intact on the downside.
To motivate us, Please like the idea If you agree with the analysis.
Happy Trading!
InvestPro India

Short Term Trading Opportunity in Reliance Ind or >7% upsideHi,
NSE:RELIANCE has given a Bullish Flag Breakout on Daily charts with very good volume.
MACD is also on the bullish side on Daily and Monthly time frames. RSI is also on the bullish side on daily, weekly and monthly time frames.
In the current market scenario, I am expecting that the bullish momentum will continue.
Complete price projection like entry, stop loss and targets mentioned on the charts for educational purpose.
Don't Forget to Follow me to get all the updates.
Please share your feedback or any queries on the study.
Disclaimer: Please consult your financial advisor before making any investment decision.

RELIANCE KI KACHUE KI CHAALReliance is in a Strong Bullish zone ,
As we can see after the friday breakout the Range & size of the Candle is getting smaller & momentum is decreasing by Time.
Possibly a Correction could appear & divergence move on RSI compared to Previous high.
Not Planning to Trade Aggressively Just wait & watch.
Closses around interesting level. 3200 is the major Resistance area according to Option chain.
JUST WAIT & WATCH
HAPPY TRADING
PRINCE
