Reliance Ind (W): Strongly Bullish - Post-Breakout ConsolidationTimeframe: Weekly | Scale: Logarithmic
The stock has staged a "V-shaped" recovery from the April 2025 lows and has successfully reclaimed key resistance levels. It is currently consolidating above the breakout zone, which is a sign of strength (time correction instead of price correction).
📈 1. The Structural Context (Bonus Adjusted)
> The Cycle:
- ATH (July 2024): ₹1,608.80 (Adjusted for 1:1 Bonus).
- The Trap (April 2025): The fall to ₹1,114 breached the long-term support (₹1,185), likely trapping bears, before reversing sharply.
> The Breakout: The stock recently cleared the ₹1,518 – ₹1,540 resistance zone.
> Current Action: For the past few weeks, it has been moving sideways above this zone. This "hovering" behavior indicates that buyers are defending the breakout level, turning previous resistance into support.
🚀 2. The Fundamental Context (The "Why")
The recovery is supported by strong fundamentals:
- 1:1 Bonus Issue: The recent bonus issue (Oct 2024) has improved liquidity and sentiment, keeping the stock buoyant.
- Earnings Growth: Recent quarters have shown robust growth in the Retail and Jio segments, which is fueling the recovery toward the ATH.
📊 3. Volume & Indicators
> Volume: Volume has been reducing during this recent sideways phase.
- Interpretation: This is a bullish sign . Low volume during a pullback/consolidation means there is no heavy selling pressure (supply is drying up). The market is waiting for the next "ignition" spark.
> EMAs: The PCO (Positive Crossover) state across Monthly, Weekly, and Daily timeframes confirms a synchronized uptrend.
> RSI: Rising in all timeframes, supporting the momentum.
🎯 4. Future Scenarios & Key Levels
The stock is primed for a continuation move.
> 🐂 Bullish Targets:
- Trigger: A decisive break above the recent consolidation high (approx ₹1,580 ).
- Target 1: ₹1,608 (The ATH). This is the immediate magnet.
- Target 2: ₹1,725 . If the stock enters "blue sky" discovery, this 7-10% extension is highly achievable.
> 🛡️ Support (The Safety Net):
- Immediate Support: ₹1,518 – ₹1,540 . The breakout zone must hold.
- Stop Loss: The level of ₹1,495 is a perfect structural stop. A close below this would mean the stock has fallen back into the old range (a "failed breakout").
Conclusion
This is a Grade A Setup . The "sideways movement above resistance" with low volume is exactly what you want to see before a major leg up. The trend is your friend here. Watch for a high-volume move above ₹1,580 .
Relianceindustries

Bank Nifty – Head & Shoulders Breakdown AnalysisPattern: Head & Shoulders
Status: Neckline breakdown confirmed
Elliott Wave Position: End of Wave 5, beginning corrective wave.
Indicators: Bearish RSI + MACD divergence
Indicators Supporting the Breakdown
🟣 RSI Divergence
Clear bearish divergence between price (higher highs) and RSI (lower highs).
RSI now breaking mid-level (50), confirming shift from bullish → neutral → bearish momentum.
🔵 MACD Structure
MACD shows multiple negative divergences during right shoulder formation.
Bearish crossover already done.
Histogram contracting further indicates strengthening downside momentum.
Expected corrective move → ABC decline to at least Wave 4 price territory.
Wave 4 region sits around 57,500 – 58,000, matching H&S target
Trend Bias: Short-term bearish until retest of neckline or completion of A-wave drop.

Reliance: Channel Breakdown Below 1535Details:
Asset: Reliance Industries Ltd (RELIANCE)
Breakdown Level: 1535
Potential Targets: 1470, lower levels if selling pressure continues
Stop Loss: 1570
Timeframe: Short-term
Rationale:
Reliance has broken below the key channel support at 1535, indicating a shift toward bearish momentum. If the price continues to sustain below this level, further downside toward 1470 or even lower levels is likely.
Market Analysis:
Technical Setup: Clean channel breakdown with strong bearish candles forming.
Momentum: Weakness observed across multiple timeframes, confirming selling pressure.
Risk Management:
Stop loss at 1570 to avoid getting trapped in any pullback.
Risk-Reward Ratio:
Favorable for short positions with clear breakdown and defined targets.
Monitor for continued weakness and volume confirmation to validate the bearish move.

Reliance Industries Ltd. - Stock AnalysisDate : 30-Nov-2025
LTP : Rs. 1,567.50
Technical View:
• NSE:RELIANCE is in primary uptrend since Apr 2025 and currently trading through it's secondary uptrend since 16-Oct-2025.
• After touching the high of 1,551 on 9-Jul-2025, it has retraced 14% to 1,340.60 level.
• NSE:RELIANCE has formed a Rounding Bottom Pattern and has breakout from it's neckline with higher than average volume on 26-Nov-2025. The Rounding Bottom Neckline is marked as 1st Resistance (R1) in chart and is placed at 1,551.
• NSE:RELIANCE is trading above 20 DEMA and 50 DEMA since last few weeks.
• MACD is trading at 30.91 and RSI is trading at 72.71.
• NSE:RELIANCE is looking bullish from here onwards.
• Resistance Levels: (R2) Rs. 1,608 --> (R3) Rs. 1,680 --> (R4) Rs. 1760
• Support Level: Rs. 1,461
If you have liked this analysis, please Like/Boost this idea and follow me for more ideas.
Disclaimer : I am not a SEBI registered analyst/consultant and not recommending anyone to take any BUY or SELL position in stock market. Investing in stock market is risky and one should do a self analysis and validation before investing in stock market. My ideas are published for learning purpose only and are available to everyone at no cost/charge.

RELIANCE LONG TRADETRADE SETUP: Reliance long trade on weekly time frame
Logic: Reliance is in continous uptrend, a dip to the marked weekly level around 1500 can be seen as opportunity to buy.
If taken in futures during entry consider entering in far month expiry.
Maintain stoploss as marked and position sizing.

Trading With AI Is Easy1. AI Simplifies Market Analysis
One of the biggest challenges in trading is understanding the market. Human traders spend hours studying charts, indicators, and historical data. AI solves this challenge by processing vast amounts of information within seconds. Machine learning algorithms can analyze:
Price trends
Volume patterns
Global news
Social media sentiment
Economic indicators
Historical correlations
This allows AI systems to provide a deeper and more accurate view of market conditions. Instead of manually reading dozens of charts, traders simply rely on AI-generated insights that highlight trends, warn of risks, and predict probable outcomes. This drastically reduces the time and effort required to make decisions.
2. AI-Powered Predictions Improve Accuracy
AI excels at recognizing patterns that humans often overlook. Advanced models such as neural networks observe millions of data points simultaneously and forecast price movements based on probability. Although AI cannot guarantee 100% accuracy, it significantly improves the reliability of predictions compared to traditional manual analysis.
For example:
AI can identify early signs of trend reversals before they appear clearly on charts.
Predictive algorithms can estimate the strength of momentum, volatility, and breakout potential.
Sentiment analysis tools can detect market mood shifts in real time.
These capabilities help traders make more informed decisions and avoid emotional pitfalls like fear, greed, and panic.
3. Automation Makes Trading Easier
AI's greatest advantage lies in automation. Automated trading—often called algorithmic trading—uses AI systems to execute trades without human intervention. Traders simply set the rules, and the AI executes them flawlessly. This leads to:
Faster order execution
Reduced slippage
Removal of emotional bias
Consistent performance
24/7 trading even when the trader is offline
Automated systems handle multiple indicators, timeframes, and markets simultaneously, something humans cannot manage manually. This makes trading easier and more efficient for both beginners and professionals.
4. AI Helps Eliminate Emotional Trading
Humans are naturally influenced by emotions such as fear, hope, and excitement. These emotions often lead to bad decisions—entering trades too early, exiting too late, or over-trading.
AI, on the other hand, is emotionless.
It operates purely on data and logic, ensuring:
Discipline
Consistency
Accuracy
Strict adherence to strategy
This helps traders avoid common psychological traps and maintain a stable, long-term approach.
5. AI Reduces the Learning Curve
For beginners, trading can feel overwhelming. Understanding technical indicators, chart patterns, and market fundamentals usually requires months of learning. AI tools simplify this process by offering:
Ready-made strategies
Automated signals
Visual dashboards
Clear buy/sell suggestions
Real-time risk assessment
Instead of learning everything manually, traders can rely on AI tools to guide them. This shortens the learning curve and makes trading accessible even to those without deep financial knowledge.
6. AI Enhances Risk Management
Risk management is the foundation of successful trading. Many traders fail not because their strategy is wrong, but because their risk management is weak. AI enhances risk control by:
Automatically adjusting position sizes
Setting optimal stop-loss and take-profit levels
Predicting potential drawdowns
Detecting high-risk market conditions
Avoiding trades during unpredictable volatility
AI’s ability to quantify and manage risk makes trading far safer and more predictable.
7. Real-Time Market Monitoring
Markets change quickly. A sudden news event can cause massive price movements. No human can monitor markets every second, but AI can. It constantly scans:
Charts
Data feeds
News
Economic calendars
Sentiment trends
AI then instantly alerts traders or automatically executes strategies. This ensures traders never miss opportunities or fail to react during major events.
8. AI Provides Personalized Trading Experience
Modern AI tools learn from each trader’s behavior. They adjust based on:
Trading style
Risk tolerance
Preferred markets
Timeframe selection
Past performance
This personalization creates a trading system that evolves over time and becomes smarter every day. Beginners get guidance, while experienced traders get advanced insights tailored to their strategies.
9. AI Supports All Markets
AI is not limited to one market. It works across:
Stocks
Forex
Cryptocurrencies
Commodities
Indices
Derivatives (options & futures)
The same AI engine can track global markets simultaneously, giving traders a diversified edge.
10. Backtesting and Strategy Optimization Become Easy
Before using a trading strategy, it must be tested. AI makes this easy by running backtests using years of historical data. It can simulate thousands of trades within minutes. Traders can instantly see:
Profit and loss potential
Drawdowns
Win rate
Strategy performance in different market conditions
AI can also fine-tune strategies by optimizing parameters automatically, producing better results over time.
11. Time-Saving and Efficient
Trading used to require hours of chart analysis daily. With AI:
Daily analysis takes seconds
Signals are instant
Trades can run automatically
Risk is calculated in real time
This allows traders to maintain their career, studies, or business while trading part-time or passively.
12. AI Levels the Playing Field
Earlier, only big institutions had access to advanced tools. Now AI technology is widely available through:
Trading platforms
Mobile apps
Cloud-based systems
Retail AI bots
Online broker tools
This gives small traders the same processing power previously available only to hedge funds.
Conclusion: Trading With AI Is Easier, Smarter, and More Accessible
AI does not eliminate all risks, and it does not guarantee profits. But it dramatically simplifies the entire process of trading by providing:
Deep market insights
Advanced predictions
Automated decision-making
Personalized strategies
Emotion-free execution
24/7 monitoring
Optimized performance
Trading will always involve uncertainty, but with AI, traders can navigate markets with far more confidence, clarity, and efficiency. AI has changed trading forever—making it easier, smarter, and more accessible for everyone.

RELIANCE: At Crucial Levels! Expecting to bounce back!⚡ Price Analysis:
1️⃣ Price structure is still not bullish need confirmation.
2️⃣ Strong candle formation near the demand zone.
3️⃣ Price needs to HOLD above 1,310 for a strong bull rally to kick in!
⭐ Key Observations:
➡️ Major support area so expecting the price is start bounce back
➡️ Aggressive entry can be planned since confirmation is still pending
➡️ PERFECT Risk-Reward Ratio (RRR) with a very small risk – golden chance!
⚠️ Disclaimer: This is NOT a buy/sell recommendation. For learning ONLY. Views are personal. Please, do your due diligence before investing.⚠️
🍀Cheers! 🔥

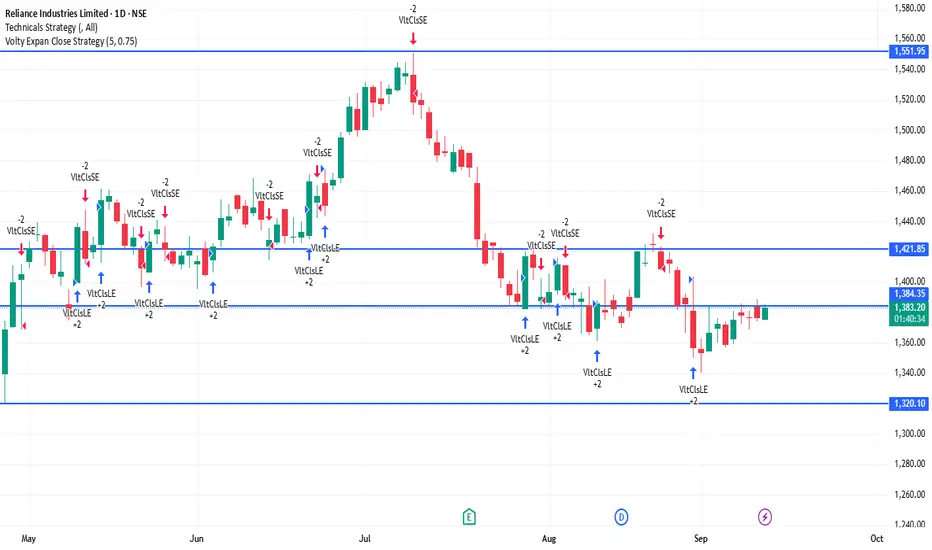
RELIANCE 1D Time frameCurrent Price Action
Reliance is trading around ₹1,384.
Day’s low is near ₹1,375 and high is near ₹1,385.
Price is consolidating in a narrow band after recent gains.
⚖️ Key Levels
Immediate Resistance: ₹1,385 – ₹1,390
Next Resistance: ₹1,400 – ₹1,410
Immediate Support: ₹1,375
Strong Support: ₹1,360 – ₹1,350
📊 Indicators
Moving Averages: Short- and medium-term averages remain bullish, confirming uptrend strength.
RSI (14-day): Around 58–60 → showing bullish momentum, still not overbought.
MACD: Positive crossover → indicates bullish bias.
📈 Outlook
As long as Reliance holds above ₹1,375, the bias stays bullish.
A breakout above ₹1,390 – ₹1,400 can push the stock toward ₹1,410 – ₹1,420.
If it falls below ₹1,375, it could slip toward ₹1,360 – ₹1,350.
GIFT Nifty & Global Market LinkageIntroduction
The Indian stock market has undergone a remarkable transformation in the past two decades. From being a largely domestic-focused equity market, India has steadily moved into the global financial arena. A very important step in this journey was the creation of GIFT City (Gujarat International Finance Tec-City) and the launch of GIFT Nifty, which has become India’s bridge to global markets.
GIFT Nifty is not just a derivative product; it is a symbolic step that integrates India’s financial markets more closely with global capital flows. At the same time, it creates a transparent and efficient platform for international investors to participate in India’s growth story.
But to fully understand its importance, one needs to see how GIFT Nifty is linked to global markets. Markets today are interconnected like never before—movements in Wall Street, European bourses, or Asian markets ripple across Indian indices. GIFT Nifty acts as a mirror and predictor of India’s domestic market sentiment while being shaped by international factors such as U.S. Fed policy, global interest rates, oil prices, and geopolitical risks.
This detailed explanation will cover:
What is GIFT Nifty?
The journey from SGX Nifty to GIFT Nifty.
The significance of GIFT City as India’s international financial hub.
GIFT Nifty’s role in India’s global financial integration.
Global market linkages – how global events influence GIFT Nifty.
Correlations with U.S., Europe, and Asia-Pacific markets.
Opportunities and challenges ahead.
The future of GIFT Nifty in shaping India’s financial markets.
1. What is GIFT Nifty?
GIFT Nifty is a derivative contract (futures and options) based on the Nifty 50 index, but traded on the NSE International Exchange (NSE IX) located in GIFT City, Gujarat.
It allows foreign investors to participate in India’s benchmark index without going through complex registration processes like FPI (Foreign Portfolio Investor) rules in the domestic market.
The contracts are USD-denominated, meaning global traders can easily buy and sell without worrying about INR conversion.
GIFT Nifty runs for almost 21 hours a day, covering Asian, European, and U.S. trading hours—making it one of the most globally accessible contracts linked to India.
In short, GIFT Nifty provides a real-time pulse of how global investors view India, almost around the clock.
2. From SGX Nifty to GIFT Nifty
Earlier, India’s Nifty futures were traded heavily on the Singapore Exchange (SGX), called SGX Nifty.
For nearly two decades, SGX Nifty was the main offshore gateway for international investors to take exposure to Indian equities.
Traders around the world would look at SGX Nifty quotes to predict the opening direction of the Indian stock market.
In fact, SGX Nifty became so popular that even Indian retail traders tracked it overnight to guess how the domestic Nifty would open.
However, in 2018, NSE and SGX had a legal tussle over licensing rights. Finally, in 2022, both parties agreed to shift all SGX Nifty contracts to GIFT City under a “Connect” model.
Now, SGX Nifty is history, and GIFT Nifty is the only official offshore Nifty derivative product. This transition brought trading volumes back under Indian jurisdiction, strengthening India’s position as a global financial hub.
3. GIFT City: India’s International Financial Hub
GIFT City is a special economic zone (SEZ) located in Gandhinagar, Gujarat. Its vision is to create a global financial and IT services hub on par with Singapore, Dubai, and London.
GIFT City offers tax incentives, world-class infrastructure, and a favorable regulatory environment.
The NSE International Exchange (NSE IX) operates here, hosting products like GIFT Nifty.
Banks, insurers, brokers, and global funds are setting up units in GIFT City to tap both Indian and global opportunities.
For India, GIFT City represents a strategic move: instead of foreign investors trading Indian products overseas, they now trade in India itself. This not only boosts financial flows but also gives regulators more oversight.
4. GIFT Nifty’s Role in Global Financial Integration
GIFT Nifty is more than just a futures contract—it symbolizes India’s growing integration with global markets.
Here’s how:
International Accessibility: Investors in New York, London, Hong Kong, or Dubai can trade GIFT Nifty almost anytime, making India’s equity market more globally visible.
Price Discovery: Since trading happens across time zones, GIFT Nifty reflects both global and domestic investor sentiment in near real time.
Hedging Tool: Foreign portfolio investors (FPIs) can hedge their India equity exposure more efficiently.
Liquidity & Volumes: Global participation in GIFT Nifty brings higher liquidity, tighter spreads, and deeper markets.
5. Global Market Linkages – How World Events Affect GIFT Nifty
The beauty (and complexity) of GIFT Nifty lies in its sensitivity to global developments. Because it trades almost continuously, it reacts instantly to global news.
Some of the most important global factors influencing GIFT Nifty are:
U.S. Federal Reserve Policy
Interest rate hikes or cuts in the U.S. directly impact global equity flows.
A hawkish Fed (raising rates) usually hurts risk assets like Indian equities.
GIFT Nifty futures often fall sharply after Fed announcements.
Global Economic Data
U.S. inflation, jobs data, GDP growth, and corporate earnings set the tone for global risk appetite.
Similarly, China’s growth numbers and Europe’s economic indicators affect global sentiment.
Oil Prices
India imports more than 80% of its crude oil needs. A rise in global oil prices usually weakens Indian equities.
GIFT Nifty reacts immediately to Brent crude movements.
Currency Fluctuations
A strong U.S. dollar and weak rupee reduce foreign investor returns.
GIFT Nifty often mirrors INR-USD volatility.
Geopolitical Risks
Wars, conflicts, sanctions, or supply-chain disruptions cause risk-off sentiment globally.
GIFT Nifty, like other emerging market indices, tends to fall under such conditions.
Global Equity Trends
If Wall Street has a strong rally, GIFT Nifty usually trades higher in the U.S. session.
If Asian markets crash early morning, GIFT Nifty shows weakness in the Asian session.
6. Correlation with Global Markets
Let us break down the interconnectedness between GIFT Nifty and major global markets.
a. Link with U.S. Markets (Wall Street)
The U.S. markets (Dow Jones, S&P 500, Nasdaq) are the most influential for GIFT Nifty.
After U.S. closing, GIFT Nifty in the U.S. time zone reacts sharply to tech earnings, Fed speeches, or macro data.
Example: If Nasdaq falls 2% overnight, GIFT Nifty usually opens lower in the Asian session.
b. Link with European Markets
During European hours, GIFT Nifty trades alongside FTSE (UK), DAX (Germany), and CAC (France).
Eurozone recession fears or ECB rate moves affect GIFT Nifty sentiment.
c. Link with Asian Markets
In the morning, GIFT Nifty trades in sync with Nikkei (Japan), Hang Seng (Hong Kong), and Shanghai Composite (China).
A sell-off in China often triggers weakness in GIFT Nifty.
Conversely, optimism in Asian markets boosts Indian sentiment.
7. Opportunities Created by GIFT Nifty
Better Price Discovery for India’s Market
Instead of relying on SGX Nifty, Indian markets now have their own offshore derivative hub.
Boost to GIFT City Ecosystem
Trading volumes, jobs, and financial services activity in GIFT City have surged.
Global Participation in India’s Growth
India is one of the fastest-growing economies. GIFT Nifty allows global funds to participate directly.
Hedging Benefits for FPIs
Foreign investors can protect themselves against Indian market volatility.
Strengthening Rupee’s Global Role
Even though contracts are in USD, India gains visibility as a financial center.
8. Challenges Ahead
Despite its success, GIFT Nifty faces challenges:
Liquidity Migration: Ensuring that volumes remain strong compared to global exchanges.
Awareness: Many global traders still see SGX Nifty as their reference, though it no longer exists.
Competition: Other financial hubs like Singapore and Dubai remain strong competitors.
Volatility Risk: High global interconnectedness means sudden shocks (like COVID-19 or geopolitical events) affect GIFT Nifty instantly.
9. The Future of GIFT Nifty
Looking forward, GIFT Nifty is set to become a cornerstone of India’s financial globalization.
Volumes are rising every month as more global institutions migrate to GIFT City.
New products (like GIFT Bank Nifty, sectoral derivatives, ETFs) may be introduced.
India’s inclusion in global bond and equity indices will further increase offshore demand.
Over the next decade, GIFT City could evolve into a mini-Singapore for Asia.
Conclusion
GIFT Nifty is more than just a trading contract—it is a symbol of India’s financial maturity. By shifting from SGX to GIFT City, India ensured that its financial products are traded on its own soil, strengthening sovereignty and transparency.
At the same time, GIFT Nifty remains deeply connected with global markets. Whether it’s the U.S. Fed, crude oil prices, China’s slowdown, or geopolitical tensions, GIFT Nifty reflects the pulse of global investor sentiment toward India in real time.
In a world where capital moves at the speed of light, GIFT Nifty serves as India’s window to the world and the world’s window to India. Its success will not only strengthen India’s equity markets but also position GIFT City as a major international financial hub in the decades to come.

Hammer In RelianceEntry- 1380-1378
Support- 1360
Targets- 1395, 1400
Reason- In 1hr timeframe a perfect hammer candle has been made in Reliance Industries which is an indication of a reversal in the stock. One can look for an entry here with 1360 as a SL.
Disclaimer- This is just for educational purpose.
Jai Shree Ram.

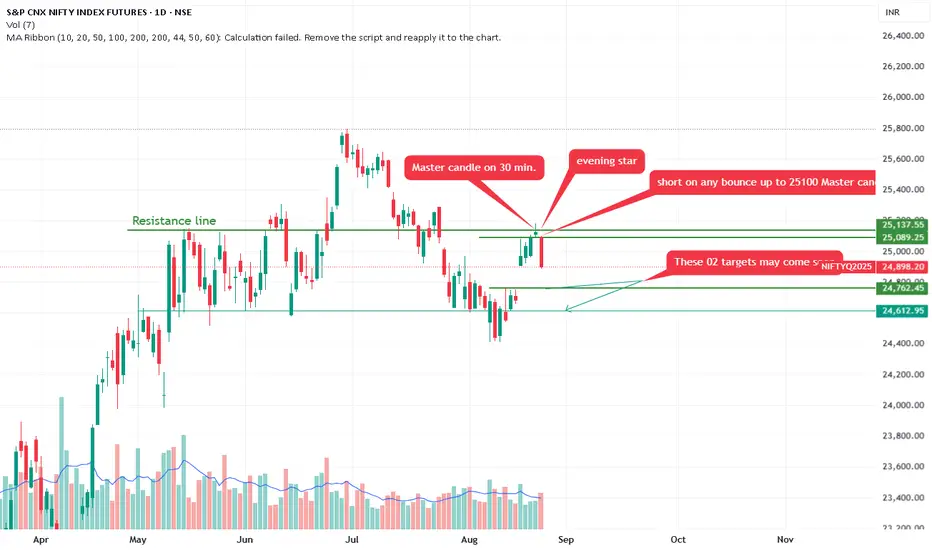
Nifty form Bearish Evening star. Correction expected.Annotations Patterns:
Master Candle on 30 min. Evening Star: Points to the recent high. A "master candle" refers to a large-range candle (here, likely on a 30-minute timeframe) that encompasses subsequent smaller candles, Combined with an "evening star" pattern—a three-candle bearish reversal (large green candle, small-bodied doji/star, followed by a large red candle closing below the first's midpoint)—this suggests a topping formation and potential for further downside.
Short on Any Bounce Up to 25,000-25,100 Master Candle Low.
Recommends selling (shorting) if price rebounds to 25,000-25,100 (labeled as the master candle's low, acting as resistance on pullback).
These 02 Targets May Come Soon: Arrows to lower levels (~24,793 and possibly 24,613), implying quick downside targets.
A downward-sloping green trendline projects further decline.
Overall Trend: The chart depicts a bull market correction or potential reversal. After months of gains, momentum has shifted bearish, with price breaking below key supports (e.g., the green line at 25,137). Higher volume on declines reinforces this.
The chart's creator appears to have a bearish bias, focusing on reversal patterns and downside projections.
A dip will be buying opportunity in Nifty So on Thursday I was expecting a sharp move, but NSE:NIFTY just gave a small bounce and stopped. Still, it managed an upmove which was good to see.
Because of this, Nifty’s pivot shifted slightly higher to 24634 and the pivot percentile has tightened a lot – now at just 0.1%.
In such a setup, the market can open with a strong gap up, or if it opens above the pivot point, then a sharp move can be expected.
But there is a concern – on Thursday sellers were heavy with 22 million volume against buyers. This can reflect tomorrow and we might see a shakeout.
Support is placed at 24533 and resistance at 24700.
My view – bullish. If there’s any dip within this support-resistance range, I’ll consider it as a buying opportunity.
NSE:BANKNIFTY also looks ready with support at 55011.
Talking about sectors, #Financial stocks should be on the radar.
I'm holding NSE:UNOMINDA , NSE:CAPLIPOINT NSE:ATHERENERG , AND NSE:RELIANCE
That’s all for today. Take care. Have a profitable week ahead.

Reliance Industries: Short pattern 1409_1418 stop 1445Reliance Industries: Short pattern 1409_1418 stop 1445 near support is 1326..
It's just a learning basis the trend and technical analysis.
Keep watching out here👍

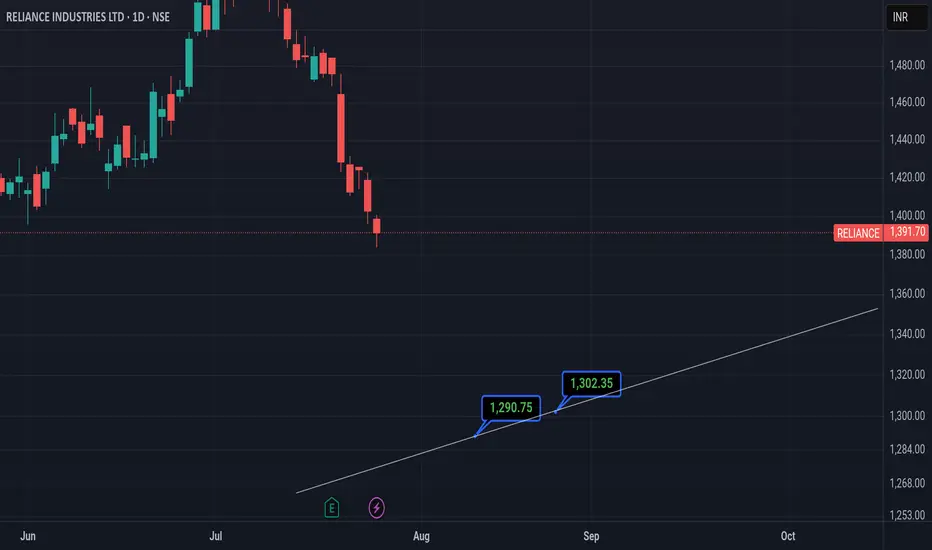
RELIANCE INDUSTRIES Reliance could fall 📉 to 1290 or to the white line within 11th August or if there's some deviation then it could fall within 25th August 2025
Disclaimer:
It's a personal view not a financial advice and I assume no responsibility and liability whatever outcome arises.
Jio Financial Services (JIOFIN) at ₹316.45**Jio Financial Services (JIOFIN) at ₹316.45: Premium Play or Future Powerhouse?**
Jio Financial Services (JIOFIN) trades at ₹316.45, a massive entity with over ₹2.01 lakh Cr market cap, backed by the Reliance ecosystem. The question for traders and investors: Is its significant premium justified?
**Key Insights:**
* **Strong Backing & Shareholding:** Promoters hold 47.12%, with healthy institutional presence (DIIs 14.78%, FIIs 12.30%). This indicates significant confidence from core stakeholders.
* **Financials: Growth & Investment-Centric:** Sales saw a decent 10% growth (Mar'25 vs Mar'24), with Operating Profit jumping 27% to ₹1,977 Cr. OPM remains high at 76%. However, 2024 cash flow from operations was negative, heavily reliant on investing activities, suggesting its current model is more investment/holding company-like.
* **Staggering Valuation:** JIOFIN's P/E of 124.80 dwarfs peers like Bajaj Finance (P/E 36.10) and SBI Cards (P/E 44.50). This isn't about current earnings; it's a massive bet on future disruption.
* **Price Action & Volatility:** Despite its pedigree, JIOFIN's 1-year return is -5.45%, and it shows significant monthly volatility. This reflects the market's ongoing price discovery for a stock valued heavily on future potential.
**The Black Belt Take:**
JIOFIN is a high-conviction, high-valuation play. It's a bet on Reliance's ability to revolutionize India's financial sector.
* **For Traders:** Expect continued volatility. Short-term opportunities exist, but precise risk management is non-negotiable given the valuation sensitivity.
* **For Investors:** This is a long-term "future growth" story. Consider accumulating on significant dips if you believe in its disruptive potential. For the conservative, waiting for more established operational cash flows and a more reasonable valuation might be prudent.
Is the "Jio Factor" enough to justify this premium, or should investors wait for the fundamentals to catch up?
---
**Disclaimer:** This article is for educational purposes only. Please consult a SEBI-registered financial advisor before making investment decisions.

Institution Option Trading🏢 Who Are These Institutions?
Institutions involved in option trading include:
🏦 Hedge Funds
🏢 Proprietary (Prop) Trading Firms
💼 Investment Banks
🌍 FIIs/DIIs
🧠 Pension Funds & Insurance Companies
They trade options across equities, indices (like Nifty/Bank Nifty), commodities, and currencies, often managing portfolios worth hundreds of crores.
🔍 Institutional Option Trading Strategies
1. Delta Neutral Strategy (Market-Neutral)
Example: Sell ATM straddle and hedge with futures.
Objective: Profit from time decay (theta) while keeping position neutral to price movement.
2. Volatility Arbitrage
Institutions bet on difference between implied and actual volatility.
Buy options when IV is low, sell when IV is high.
3. Calendar Spreads
Sell near expiry option, buy longer expiry of the same strike.
Used when institutions expect IV to rise but minimal short-term price movement.
4. Iron Condors and Butterflies
Multi-leg strategies for range-bound markets.
Used with large capital to generate steady income with limited risk.
5. Protective Puts / Covered Calls
Portfolio hedging: buy puts to protect against downturns, sell calls to earn extra income.
Very common among mutual funds and long-term portfolios.
📈 Option Chain Reading – Institutional Footprint
When institutions enter or adjust option positions, they leave footprints in the option chain. You can spot them by watching:
Sudden spike in OI (Open Interest) at specific strikes
Sharp rise in IV without much price movement
Heavy Put or Call writing near resistance/support zones
Unusual option activity (UOA) before key events
⚠️ How Retail Traders Can Learn From Institutional Option Trading
Track Option Chain + OI Changes Daily
Learn to Read Greeks Before Taking a Trade
Watch How IV Shifts Before & After Events
Backtest Simple Institutional Strategies (e.g. ATM Straddles)
Focus on Consistency and Capital Protection
🛑 Common Retail Mistakes in Options (Avoided by Institutions)
Buying deep OTM options blindly
Overtrading in low-volume strikes
Selling naked options without hedge
Ignoring IV or theta decay
Trading without stop-loss or adjustment plans
🧘 Conclusion: Why Mastering Institutional Option Trading Matters
Understanding how institutions trade options allows you to:
✅ Avoid emotional traps
✅ Trade with the flow of smart money
✅ Use real risk management
✅ Build income and protection strategies
✅ Improve win-rate and longevity in trading

New Hedging Opportunity: Gold Futures at IIBX1. What Is IIBX—and Why Are Gold Futures a Game Changer?
India International Bullion Exchange (IIBX), based in GIFT City, Gujarat, launched gold futures trading in July 2025.
This marks the first-ever opportunity for Indian entities to hedge gold price risk onshore but in US dollars with global pricing—bridging domestic participants and international benchmarks.
Unlike traditional futures on MCX, which are rupee-denominated and influenced heavily by Indian domestic factors, IIBX futures track international market dynamics, aligning with real-time global valuations.
Why is this significant?
India is the world’s second-largest consumer of gold—by introducing a dollar-denominated, globally priced futures contract, IIBX allows traders and jewellers to hedge currency and commodity risk simultaneously.
This initiative reduces dependence on foreign exchanges like COMEX or Singapore and supports RBI/IFSCA's goal to develop a robust, transparent bullion trading ecosystem domestically.
2. Who Can Use These Futures—and How Do They Hedge?
Eligible Participants:
Qualified jewellers
Bullion dealers
Refineries
TRQ (Tariff Rate Quota) holders (currently 441+, with more in the pipeline)
Any business entity with gold-related risk exposure
Hedging Scenarios:
Jewellers: Protect import cost from rising gold prices. If they expect gold to cost $2,000/oz in three months, they can lock in prices via futures.
Refiners and Dealers: Manage margin volatility and ensure stable profit spreads regardless of gold price shifts.
TRQ operators: Offset exposure to tariff-based import risks.
Hedging Mechanics:
Buy futures if expecting price increases, offsetting rising import cost.
Sell futures (short positions) to hedge inventory or production, locking in current prices.
Since trades occur in US dollars and settle physically or in cash, participants hedge both commodity and currency risk.
3. Contract Features: What IIBX Has Built-In
📃 Specifications:
Contract unit: 1 kg gold (approx 32.15 oz)
Denomination: U.S. dollars per Troy ounce
Tick size: $0.01 per oz
Minimum trading size: 1 kg; maximum 10 kg per order
Contracts listed: Three consecutive months plus all even-months in a 13-month window (total 8 concurrent maturities)
Trading hours: 09:00–23:30 IST—keeping sync with global gold trading sessions
Risk & Margin Management:
Initial margin: At least 6% of contract value or calculated via Value‑at‑Risk (VaR)
Extreme Loss Margin (ELM): 1% buffer
Daily Mark-to-Market (MTM) settlement
Collateral controls: Members cannot fully exhaust collateral—risk-reduction thresholds are triggered at 85–90%
Concentration & spread margins: Encourage diversification by offering margin benefits for calendar spreads
Settlement:
Daily MTM in USD
Final settlement: Cash or physical delivery, based on pre-declared intent
These features ensure transparency, member protection, and global alignment—while maintaining strong oversight by IIBX and IFSCA.
4. What Makes This Hedging Opportunity Unique Now
💱 Hedge Gold and Currency Simultaneously
Standard MCX contracts hedge gold price risk but not USD/INR fluctuations.
With IIBX’s Dollar-based futures, businesses effectively lock both gold and currency exposures in one contract—critical for imports and exports.
🌍 Real-Time Global Price Alignment
IIBX uses Bloomberg’s XAU–USD spot pricing, so domestic hedges match international market moves.
This synchronisation is ideal for global trading, arbitrage, and better risk pricing.
🏛 Onshore Containerization of Hedging
Previously, Indian entities hedged overseas or bypassed through subsidiaries abroad.
Now, they can do it in GIFT City via Indian AD banks—streamlining compliance, saving on setup costs, and avoiding legal complexities.
🚀 Liquidity Boost via LES
IIBX launched a Liquidity Enhancement Scheme to incentivize market makers through rebates and reduced fees.
This seeds the market with tight spreads, better execution, and deeper order books over time.
5. Practical Use Cases for Gold Futures Hedging
✅ A. Jeweller Importer's Playbook
Estimate gold import date/volume
Sell equivalent IIBX futures at current prices
On expiry or near import — either physically take delivery or unwind position
Lock in gold cost, simplifying pricing and margin management
✅ B. Bullion Dealer/Retailer
Holds inventory — buys futures to guard against price drop
Over time, MTM fluctuations offset spot inventory gains/losses
Enables accurate working capital forecasting
✅ C. Refinery Example
Producing gold bars from scraps or raw gold
Sells refined gold in INR, but raw gold bought internationally in INR/USD
Hedging reduces mismatch, stabilizes profit margins
✅ D. Speculative/Arbitrage Traders
Play price differentials between MCX and IIBX
Exploit basis arbitrage or global/regional price plays
(Though speculative traders must be cautious of margin and regulatory requirements
7. Broader Impacts & Market Implications
🌐 Strengthening GIFT City Ecosystem
Diversifies offerings beyond forex and securities to bullion
Supports India’s vision of GIFT City as a global commodity hub
💰 Incentivizing Domestic Financial Institutions
AD banks can provide clients with hedging capabilities
Banks earn commissions and fees while helping reduce gold dependence on cash markets
🔄 Reducing Reliance on Overseas Exchanges
By offering global pricing and technology in India, overseas trading reductions save costs and complexity
🧰 Integration with Spot & Physical Markets
IIBX also operates spot segments for gold and silver
Interlinked spot-futures structure enables improved cash management and delivery coordination
8. Outlook: What Traders and Businesses Should Do Now
Assessment: Evaluate gold/currency exposures in your business (imports, inventory, exports)
Registration: Engage with AD banks for required approval and collateral setup
Education: Use IIBX’s website tutorials and circulars to understand margining and settlement norms
Start Small: Begin with a 1–2 contract hedge; monitor margin and execution
Expand Strategy: From spot hedges to calendar spreads and global arbitrage
For traders, domestic traders and arbitragers, a new tool has entered their toolbox—one that can level the playing field vs global participants.
9. Final Thoughts
The launch of Gold Futures on IIBX is a major evolution in India’s financial markets. It brings a sophisticated hedge mechanism—previously only available via overseas platforms—into the regulatory fold of GIFT City, in US dollars, tied to international prices. For jewellers, dealers, refiners, importers, and treasury teams, this is a powerful new instrument.
If adopted well, over time, it may reduce India’s dependence on international exchanges, bring more trading depth, and reduce gold price volatility for domestic stakeholders—all while supporting GIFT City’s vision as a world-class financial hub.
Ooooo! What do we have here? #Reliance If we look at Reliance, we can see how beautiful and synced the counting may look and feel. Can it become the reason for some good news in Nifty? Fingers Crossed!!

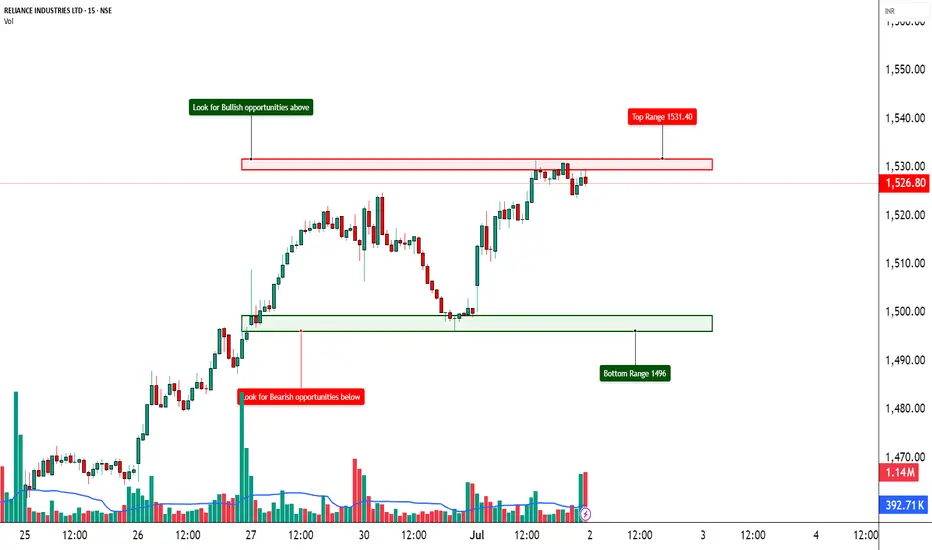
RELIANCE – Trapped Between Strikes📈 RELIANCE – Trapped Between Strikes | Option Chain + Price Action Insights
🕒 Chart Type: 15-Minute
📆 Date: July 3, 2025
________________________________________
🔍 What’s Catching Our Eye:
RELIANCE is hovering just above ₹1,517.8 and facing resistance from rising short positions on Calls across 1540–1580 levels. Despite minor short covering at the 1500 and 1520 CEs, fresh Short Build-Up is visible across most strikes, suggesting upward moves are being capped. On the flip side, Puts between 1500–1530 are also witnessing Short Build-Up, indicating traders aren't expecting a major breakdown either.
________________________________________
📌 What We’re Watching For:
RELIANCE appears range-bound, and clear directional strength is missing. Price needs to decisively break above ₹1,540 for bullish strength to materialize. On the downside, support exists around ₹1,500, but if that breaks, expect pressure to mount quickly.
________________________________________
📊 Volume Footprint:
Heavy volume on both sides:
• 13k+ contracts at 1520 CE
• 11k+ contracts at 1600 CE
• Over 9k contracts traded at 1500–1530 PE
→ Traders are actively betting on both sides, suggesting volatility ahead.
________________________________________
📈 Option Chain Highlights:
• Call Side:
o 1530 CE → Long Build-Up (+2.45% OI)
o 1540 CE → Long Build-Up (+2.45%)
o 1550–1580 CE → Short Build-Up, signaling resistance buildup
o 1520 CE → Short Covering
• Put Side:
o 1500–1530 PE → Short Build-Up, hinting at base support around 1500
Inference: The tug-of-war is real. Calls are being written at higher strikes while Puts are being sold at lower strikes. That creates a tight range of ₹1,500–1,540, with traders unsure of breakout direction.
________________________________________
🔁 Trend Bias:
🟡 Neutral to Slightly Bullish – Only if ₹1,540 is reclaimed with volume
________________________________________
🧠 Trade Logic / Reasoning:
Price is squeezed between the ₹1,500 Put writers and ₹1,540+ Call writers. This is a textbook “compression zone” where a breakout or breakdown may soon follow. If bulls want control, they must push above ₹1,540 with volume and follow-through. Else, expect the sideways to weak bias to continue.
________________________________________
📍 Important Levels to Mark:
🔺 Top Range (Resistance): ₹1,540 – Break & sustain needed for upside
🔻 Bottom Range (Support): ₹1,500 – Breakdown will shift sentiment bearish
________________________________________
🎯 Trade Plan (Educational Purpose Only):
✅ Best Buy (Equity): Only above ₹1,540 with confirmation
✅ Best Sell (Equity): If price breaks below ₹1,500
✅ Best CE to Long: 1530 CE – Strong long build-up with good delta
✅ Best PE to Long: Avoid – PE sellers still active; no breakdown confirmed
🟢 Demand Zone: NA
🔴 Supply Zone: NA
⚠️ Invalidation Below:
Bullish view invalid if price fails at ₹1,540 or slips below ₹1,500 with volume
________________________________________
⚠️ Disclaimer:
This analysis is for educational purposes only.
STWP is not a SEBI-registered advisor.
No buy/sell recommendations are made.
Please consult your financial advisor before trading.
STWP is not responsible for any trading decisions based on this content.
________________________________________
💬 Found this helpful?
Drop your feedback in the comments ⬇️
🔁 Share with traders who track RELIANCE
✅ Follow STWP for consistent zone + option chain insights
🚀 Let’s trade smart, with patience and clarity!

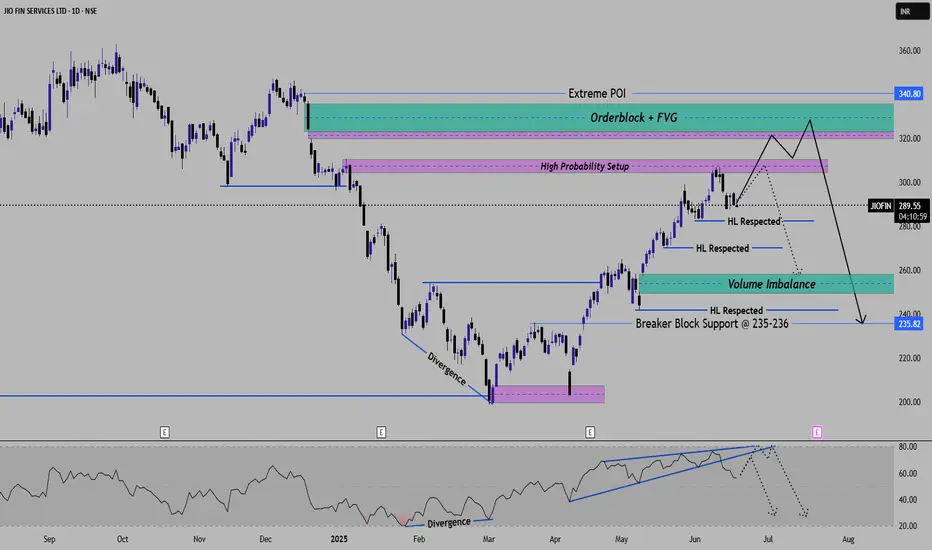
Jio Financial ---- Deep AnalysisJIOFIN -- High Probability Reversal Setup Based on ICT & SMC Concepts
Timeframe - Daily
Projection -- High Probability Reversal Setup expected.
Price Action Overview --
Stock is currently Respecting an internal bullish structure without breaking higher lows.
And stock is currently moving towards High probability POI zone along with --
Order block + FVG is 330-340 levels
Liquidity zone just below the Order block
Liquidity & POI Zone ----
Immediate Liquidity is resting above the levels of 290-300
Imbalance ---
Downside VOlume imbalance between 250-260 levels
below that there is breaker block support zone
RSI ----
Rsi divergence observed at bottom, which shows a bullish move
Rsi showing potential exhaustion or say confluence for reversal after POI is tapped.
Final projection for next 2-3-4 months view -----
Main Target (High Probability) -- Price likely to sweep buy-side liquidity above 300-310
tapping into orderblock + FVG zone 330-340 levels
Expecting strong rejection and sell-off towards Volume imbalance(255) and Breaker block(235)
If main Target Does not go well --- If rejection occures earlier around 300-310 then a partial distribution may trigger
earlier dump into volume imbalance without reaching to Orderblock.
This setup is just reflecting classic Buy-side liquidity grab >>>>> Sell off into imbalance.
Your views or comments are really welcomed. Also just give comments for any confusion or clarification.
#Nifty #Sensex #Jio #Reliance
RELIANCE – Short Covering Fueling a Reversal?📈 RELIANCE – Short Covering Fueling a Reversal?
🔍 Heavy Action Across 1500–1570 CEs | Bullish Reversal on the Cards?
Chart Type: 15-min / 1H / Daily
Indicators: STWP Zones, Option Chain Activity, Volume Clusters, Demand-Supply
🔹 What’s Catching Our Eye?
✅ Aggressive Long Build-Up across multiple CEs (1550–1580)
✅ Massive Short Covering on 1500–1530 Calls – Bears exiting fast
✅ Huge OI Additions at 1550, 1560, 1570 CEs – Smart money positioning ahead?
✅ Put Writers Building Base at 1500–1520 PE → Strong support developing
✅ Spot Price at ₹1528.4 – Right at the heart of breakout zone
✅ IVs remain in control (~15.9–16.3%) = room for expansion
📊 What We’re Watching for:
📍 Breakout Zone: 1530–1540
📍 Targets: 1560 → 1580 → 1600
📍 Invalidation Below: 1490
📍 Momentum Confirmation: Price closing above 1540 with volume & OI spike
📍 Option Chain Support: 1500 PE (OI: 29.3L) + short build-up in multiple puts
📌 Trade Plan (Educational Purpose Only):
🔹 Bullish Idea: Buy above 1530–1540 with SL below 1490
🔹 Options Play: 1550 or 1560 CE suitable for short-term directional trades
🔹 Positional Angle: Momentum may sustain toward 1600 if 1540 holds
⚠️ Disclaimer:
This post is for educational and learning purposes only.
It does not constitute buy/sell advice or investment recommendation.
Always consult your financial advisor before taking any positions.
STWP is not liable for any financial decisions based on this content.
📚 “When bears cover in panic, bulls prepare their charge.”
💬 What’s your take on Reliance? Is 1600 on the radar, or is this just a squeeze?
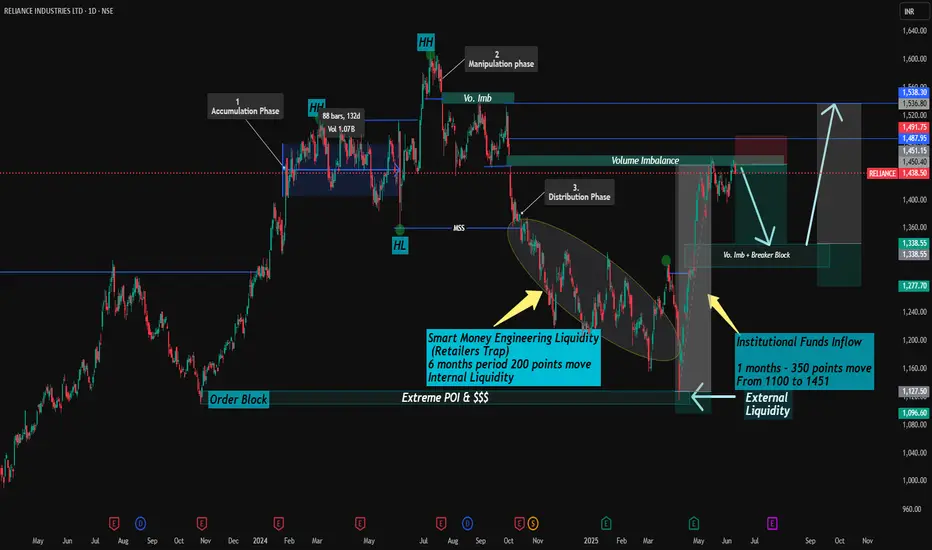
Reliance industries ltd. Deep AnalysisSharing my Analysis on Reliance (RIL). (Only for Education Purpose)
This analysis is based on Higher Time Frame (Daily)
Past Move scenario ----
1. If we see on chart, after 3rd oct. 2024, Price has completed major liquidity sweep below internal lows followed by Market Structure Shift (Marked as MSS) and for that it took 6 months.
2. After that External liquidity sweep been performed near to 1100 levels which is also marked as Extreme POI which triggered an impulse move of 350 points with funds inflow which pushed price to 1451 levels. (Here it just took 1 months only)
Current Move Scenario ----
===upside there we saw volume imbalance + Breaker block where price is making resistance or rejecting upside move.
(Potential Short Term Supply Zone 1450-1488 levels)
Expected Short Term Bias ---
Downside levels --- 1335 (Breaker Block + Discount Zone)
Upside Resistance ---- Cross of Order block range 1496
Expected Long Term Bullish Bias -- Likely after Retracement to downside Vo. Imbalance and + Breaker block
Re-Entry Long Zone - 1335-1350
Upmove expected to 1500 Imbalance levels
above that Final External Liquidity zone to 1560
Steps --- Accumulation ---Expansion ---Re accumulation, targeting External Liquidity.
Everything mentioned on chart itself.
{Above Views are only for Education purpose and do not consider it as any Advisory. Consult your Financial Advisor before investments in any securities.}
YOur Views or Comments are Welcomed.
Reliance industries Ltd bullish up +4%....According to weekly analysis it will reach 1500 area within this week.
At the same time nifty is also in bullish view.
I am going to position myself in reliance bullish trend.
1490 to 1500 is going to a major resistance area .
