RELIANCE : Analysis and Prediction
Timeframe: 1D
Structure: ABC corrective structure within a broader range
Current Price Zone: ~₹1,458
Market Phase: Post-distribution correction from extended retracement highs
🔍 Big Picture Market Structure (Educational View)
Reliance has completed a strong impulsive upmove, followed by profit booking from an extended Fibonacci retracement zone (113%–127%), which is clearly visible near the recent highs.
This behavior is textbook market psychology:
Smart money distributes positions near extended projections
Late buyers enter near highs
Price then corrects to value zones, where demand is reassessed
The chart now reflects a classic ABC correction:
Wave A: Sharp rejection from supply zone
Wave B: Temporary bounce (short covering + dip buying)
Wave C: Ongoing corrective leg testing demand
📐 Why These Levels Matter (Trading Psychology Explained)
🔴 Supply Zone: ₹1,580–1,610 (113%–127%)
This zone triggered strong selling because:
Long-term holders booked profits
Institutions reduced risk at stretched valuations
Breakout buyers were trapped
📌 Extended Fibonacci zones often act as exhaustion points.
🟡 Golden Support Zone: ₹1,398–1,476 (50%–78.6%)
This zone is critical because:
It represents fair value retracement of the prior rally
Dip buyers and positional traders look for re-entry here
Short sellers start covering partially
🧠 Markets frequently pause or bounce here due to a balance between fear (from longs) and greed (from value buyers).
🔵 Lower Extended Support: ₹1,267–1,305 (127%–113%)
If the golden zone fails:
Confidence of dip buyers weakens
Panic selling increases
Price seeks deeper liquidity
📉 This is where only high-conviction buyers step in.
🟢 Bullish Reaction Scenario (Base Case)
If price:
Holds above ₹1,398–1,420
Shows stabilization (small candles / higher lows)
Then:
First recovery toward ₹1,476 (50%)
Further bounce possible toward ₹1,580
Momentum buyers re-enter above broken VWAP zones
📈 This would be a corrective bounce, not a fresh trend yet.
🔴 Bearish Continuation Scenario (Risk Case)
If price:
Fails to sustain above ₹1,398
Closes decisively below this zone
Then:
Downside opens toward ₹1,305 → ₹1,267
Breakdown reflects loss of confidence by dip buyers
Sentiment shifts from “buy the dip” to “sell on bounce”
🎓 Educational Takeaways for Traders
Extended rallies end with distribution, not collapse
Fibonacci levels work because most traders watch them
Corrections test patience, not intelligence
Price reacts where emotions are highest, not where logic feels comfortable
🧠 Trading Psychology Behind This Chart
Zone Trader Behavior
Highs (1,580–1,610) Greed → Distribution
Pullback begins Hope → Dip buying
Golden zone Fear vs Opportunity
Breakdown Panic & Capitulation
📘 Markets move because people react — levels simply highlight where reactions cluster.
🔮 Price Outlook (Educational Projection)
Above ₹1,420: Range-bound recovery likely
Above ₹1,476: Momentum improves, bounce extension possible
Below ₹1,398: Deeper correction toward ₹1,305
Below ₹1,267: Structure turns weak on higher timeframe
🧾 Conclusion
Reliance is currently in a healthy corrective phase after profit booking from stretched levels.
The ₹1,398–1,476 zone is the most important area to watch — it will decide whether this correction ends as accumulation or turns into distribution continuation.
📌 Let price confirm intent; don’t predict emotions.
⚠️ Disclaimer
This analysis is for educational purposes only. I am not a SEBI registered analyst. Markets are uncertain, and I can be wrong. Please consult a financial advisor before trading or investing.
Reliancelong

Reliance industries Ltd bullish up +4%....According to weekly analysis it will reach 1500 area within this week.
At the same time nifty is also in bullish view.
I am going to position myself in reliance bullish trend.
1490 to 1500 is going to a major resistance area .

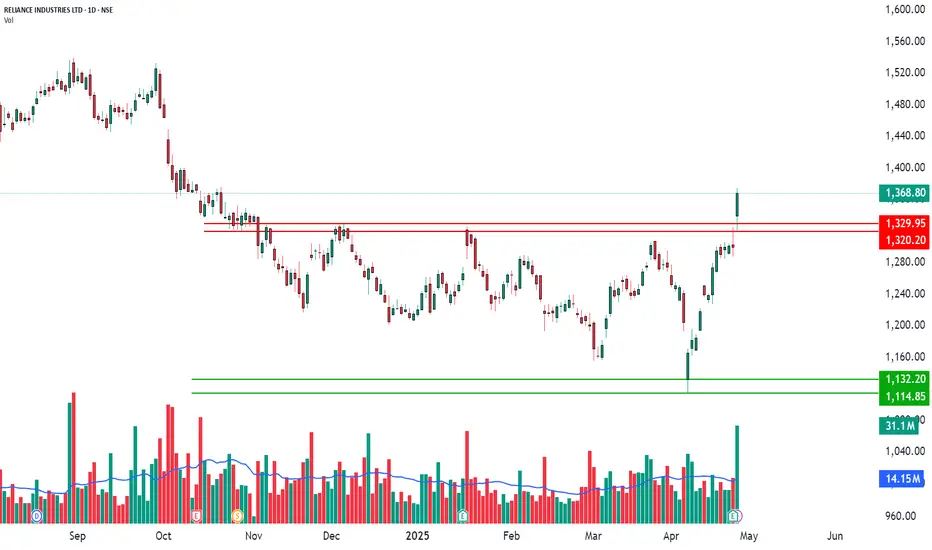
Strong Bullish Breakout! | Daily Time Frame📈 RELIANCE INDUSTRIES LTD – Strong Bullish Breakout!
📅 Date: April 28, 2025
📈 Timeframe: Daily Chart
🔍 Stock: Reliance Industries Ltd (NSE)
📌 Technical Overview:
Reliance Industries has shown strong bullish momentum after breaking out above the important level of ₹1300.90.
Several indicators are supporting this breakout:
✅ RSI Breakout – Showing strong strength.
✅ Bollinger Bands Breakout – Price is breaking outside the bands, showing heavy momentum.
✅ Bullish VWAP Trend – Price is trading well above the VWAP line.
✅ TTM Squeeze Breakout – Major squeeze breakout confirms buyers' control.
🧩 Key Levels:
Major Resistance Broken: ₹1300.90 ✅
Immediate Support Now: ₹1329.95 and ₹1320.20 (red lines)
Next Possible Support: ₹1132.20 and ₹1114.85 (green lines, if reversal happens later)
📊 Volume Analysis:
Heavy spike in volume confirming strong buying activity.
🧠 Observational Bias:
As long as the price stays above ₹1300.90, the momentum remains bullish.
Small dips toward support can be seen as healthy pullbacks.
RELIANCE INDUSTRIES – Buying Zone Test with Reversal PotentialRight now, the stock is respecting a long-standing falling channel, and it has just bounced off the lower boundary of the pattern near the marked Buying Zone.
The stock has been consolidating for the past 9 months inside a downward-sloping channel, and this retest could serve as the ignition point for a trend reversal.
All important levels have been marked on the chart.
Looking at the price action and structure, there's a high probability that RELIANCE can move towards ₹1,325 in the coming weeks if the reversal holds.
Volume surged near the bottom, hinting at smart money accumulation. Entering near ₹1,110–₹1,120 zone gives a solid
Risk: Reward :: 1 : 3.3
Support Levels:
🔹 ₹1,165 – Minor demand zone
🔹 ₹1,110 – Major support and channel lower trendline
🔹 ₹1,085 – Last swing low, demand base
Resistance Levels:
🔹 ₹1,204 – First level of resistance
🔹 ₹1,280 – Mid-channel upper zone
🔹 ₹1,325 – Short-term breakout target
Reasons:
✅ 9-month falling channel
✅ Strong bounce off major support (Buying Zone)
✅ RSI rebounding from oversold territory
✅ Volume spike at support = potential smart money entry
✅ Favorable R:R for positional entry
✅ Potential early reversal before breakout
News & Sentiment:
No major negative news post-recent drop. The correction seems technical, and long-term sentiment remains optimistic especially around expected earnings and energy sector momentum.
Verdict:
Bullish
Plan of Action:
Enter on strength above ₹1,175 or on dip near ₹1,120 zone with volume confirmation.
BUY: ₹1,120–₹1,175
Stoploss: ₹1,085
Target: ₹1,325
Trailing SL: ₹25–₹30

Reliance Chart Spark Fire in the Upcoming Trading Season! Buy Reliance If Break 50-Day's Moving Average -1272 And Hold Closing Basis. Buy With Stop - 1240, For Target - 1350.

Reliance Industries Hourly Time frame divergenceStock took support from weekly support level of 1213 now showing reversals,
We may see 1320 levels soon as stock is also forming rsi divergence in hourly time frame.
consult your financial advisor before trading.

RELIANCE IND - BLUE CHIP STOCK FOR LONG TERMCan Enter at 1260
Target - 1600,2000
Disclaimer - All information on this page is for educational purposes only,
we are not SEBI Registered, Please consult a SEBI registered financial advisor for your financial matters before investing And taking any decision. We are not responsible for any profit/loss you made.
Request your support and engagement by liking and commenting & follow to provide encouragement
HAPPY TRADING 👍

Reliance Inds cmp 1267.60 by Weekly Chart viewReliance Inds cmp 1267.60 by Weekly Chart view
- Stock has formed Bearish Rounding Bottom
- Support Zone seen at 1050 to 1100 Price Band
- Support Zone 1250 to 1300 Price Band turning into Resistance Zone
- Stock might probably show more downside by the Technical Chart setup
- Weekly Basis : Support at 1195 > 1100 > 995 with Resistance at 1360 > 1445 >1535 > ATH 1608.80
- Stock Price gone well below the crossover of both the Falling Resistance Trendline and also the Rising Support Trendline been broken down

RELIANCE #RELIANCE
Daily Chart
Stock is trading near good accumulation zone
• Strong support zone technically and fibonaccically Bookmark it

RELIANCE BUY SETUP This is the buy setup for Reliance....I can see a big divergence in the Rsi and sitting on a big demanding zone so multiple confluences to support this buy setup.

Reliance - Intraday TradeSpecifically for Intraday only: 15-MTF
Bullish Trade
Trade the Strong Bullish Candle closing above Breakout Level
RSI should be 70 or more
Stop Loss to be below Breakout Candle
Look to book profit before target level
Bearish Trade
Trade the Strong Bearish Candle closing below Breakdown Level
RSI should be 30 or less
Stop Loss to be above Breakdown Candle
Look to book profit before target level
Trade with proper risk management

Crab pattern in relianceThis stock turns bullish now as per harmonic crab pattern. This is for educational purposes only.

Reliance - Strong support areaStock standing at strong support area
2710-2750 support zone
2900-2925 resistance zone
Stock may go sideways first then may start the journey towards upside again
wait for at least 1 HH HL of a good buying candle in this time frame recommended

Reliance Industries ViewOn Daily Chart Reliance Industries is in range since Aug'21. Expected to breakout in coming days. Tgt & SL for the same is mentioned on chart.

RELIANCE INTRADAY TRADE 19TH AUG | BUY ABOVE 2970Buy Reliance tomorrow if sustains above 2970 for the targets of 3000 and 3030 until 2934 is intact on the downside.
To motivate us, Please like the idea If you agree with the analysis.
Happy Trading!
InvestPro India

Reliance Industries Approaching Key Demand ZoneReliance Industries ( NSE:RELIANCE ) is approaching a significant daily demand zone. This demand zone is noteworthy due to its historical impact: following its formation, Reliance has broken through previous resistance levels and reached an all-time high.
Key Observations:
Strong Demand Zone: The current demand zone has demonstrated substantial strength in the past. Its formation preceded a major breakout to new all-time highs, highlighting its robustness.
Breakout Confirmation: After this demand zone formed, Reliance surpassed its previous resistance levels, underscoring the demand zone’s significance in driving the upward momentum.
Opportunity: Given the strength of this demand zone, the current price level presents a potential high-reward trading opportunity. Entering trades at this demand zone could offer an advantageous risk-reward ratio.
Disclaimer: This analysis is for informational purposes only and does not constitute trading advice. Always conduct your own research and consult with a financial advisor before making investment decisions.

#RELIANCE BREAKDOWN 15/07/2024RELIANCE as we expected. still intact on the upside view of a continuous bullish uptrend rally. there are vari some break even point target levels at 3210,3250 or 3300 may be touching the highest level before The Union Budget on 22 July 2024. Be aware of the market crash, And trade with risk 1:2,1:3,1:4,5,6........ profit always be on your side.

Short Term Trading Opportunity in Reliance Ind or >7% upsideHi,
NSE:RELIANCE has given a Bullish Flag Breakout on Daily charts with very good volume.
MACD is also on the bullish side on Daily and Monthly time frames. RSI is also on the bullish side on daily, weekly and monthly time frames.
In the current market scenario, I am expecting that the bullish momentum will continue.
Complete price projection like entry, stop loss and targets mentioned on the charts for educational purpose.
Don't Forget to Follow me to get all the updates.
Please share your feedback or any queries on the study.
Disclaimer: Please consult your financial advisor before making any investment decision.

RELIANCE Weekly Update 15/JUN/24Hello Traders.
Is it that Reliance indicating a One sided move with trendline shifted up higher.
The Patience guy is About to lose the patience & cares about no one.
The big move is on the way once the Range has been Breaked & one of the major role player in NIFTY volatility in Future.
Let it break out of 3000 rs levels & planned the entries on daily chart.
HAPPY TRADING

RELIANCE LOOKING GOOD FOR 2940 AND ABOVEBuy Reliance above 2860 for the targets of 2940, 2965 and 3000 until 2765 is intact on the downside.
To motivate us, Please like the idea If you agree with the analysis.
Happy Trading!
InvestPro India

Ahead of Q4 Result - RelianceReliance Is going to Announce it's Q4 Result today after market on 22 April 2024 but ahead of it when we look at the chart of Reliance we can see there is positivity and it may open or touch 3000 levels and very soon we can see level of 3100.
Disclaimer - Investment and Trading is Subject to Market Risk

Reliance Long opportunity We can observe Stoploss hunt behavior and pattern fake breakout, potential long opportunity above 2650 lvels.
We can look for longs in Reliance if 1hr candle closes above 2650 with good volume,
short term targets should be 2750/2800 levels with recent swing low as stoploss.
--Educational purpose only.

FALL EXPECTED IN RELIANCEReliance industries in trading in a channel and taking a short trend near upper channel with SL above the resistance zone has potential of giving good profits.
Sell - 2750 - 2740
SL - 2800
Targets - 2635, 2585
Please like the idea If you agree with the analysis, your like will motivate us to share more ideas on Tradingview.
Happy Trading!
InvestPro India
