Renko
Analysis of Nifty Energy Weekly Chart by Heikin Ashi and Renko The energy index looks bullish on weekly charts as there are no signs of weakness.
As the Heikin Ashi chart has been making green candles also the structure of the chart is good.
The overall feel of the chart is good.
On daily charts the price is on the bottom of parallel channel and on the same pivots.
Renko is also making a green brick.
The stock may face high volatility on lower time frames. But from these levels the downside is less.
Banknifty Daily ChartTrade Setup
Short October Futures from the pullback level or current level.
High Volatility
Candlestick Chart
25% move from 32290 (17 Jun 2022) to 39759 (19 Aug 2022)
If we draw Fibonacci retracement for the same level then the 38.20% level comes at 36906.40.
Macd - Bearish Crossover
Renko Chart
Fake breakout of resistance at the level of 39011 and starts traded below the level.
Red bricks start appearing.
Heikin Ashi Chart
A long red candle is formed.
All recent lows are broken by this candle.
Conclustion
If the price starts its downward move, then it will test the levels of 36906.
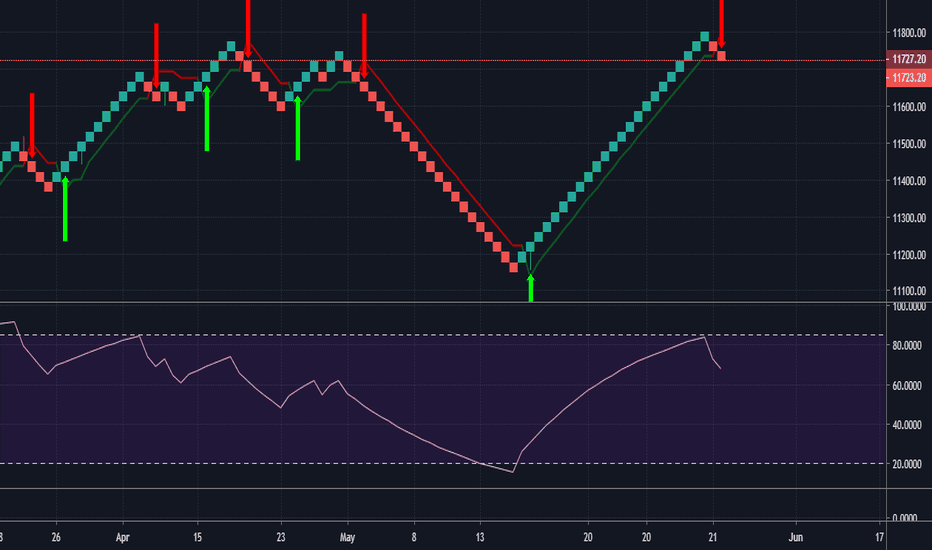
Don't Short Nifty tomorrow! Renko charts says so!Pre & Post Budget movements are most rewarding if captured correctly. Since the last two budgets, we are seeing a sharp fall post budget. This time it seems, this may not repeat. Renko charts says so! The market may either continue its upward journey or may trade in a narrow range. So I will either suggest going long on NSE:NIFTY or just SELL PUT options of Nifty with a strike price of 11900 of 11th, 18th or 25th expiry!
Sell Nifty (High Risk - High reward call) for F&O expiry.NSE:NIFTY can fall for next two days (till F & O expiry) . Best bet for shorting is above 11750 (if its a gap up opening) when it will surely reach an overbought region.
This call is based on tentative Renko Supertrend sell signal (Not yet appeared, but a good chance of appearing tomorrow) as well as a tentative 'Overbought RSI' signal (Again not yet appeared, but very likely to happen tomorrow).
Its a very risky call & meant only for intraday or btst trader.
Bank Nifty mildly bearishIt seems profit booking may drag NIFTY B to 27500 in 3-4 sessions. Three indicators are confirming these:
1. Renko Daily chart (Brick size = 38)
2. RSI (14) hitting the upper threshold.
3. Aroon Down (Red) crossing Aroon Up (Green).
Once can take a position to gain 600-650 bank nifty points.
Arvind breaking out. Buy Signal on Renko Supertrend ComboDaily Renko Charts (Brick size: 1.97) & Supertrend Combination are giving a buying position for NSE:ARVIND for next week. One can enter a bullish position in Future/Options for August Expiry.
As its a Renko charts, I will not give any stop loss or Target profit. However, I will update about the SELL signal to exit from such position.
Bank Nifty reaching 27250 level?Next bullish wave is forming for NSE:BANKNIFTY on Renko charts. Supertrend & Aroon crossover indicates a perfect time to enter in position on Monday. Although, Renko-Supertrend will give exit signal on their own. But, extrapolation of previous Renko Chart resistance indicates a rally till 27250 level which should be a good exit level.
Renko Daily & 4hr Added an up BrickBiocon earnings are on tomorrow. Renko Daily & 4hr Added an up Brick (green). this could indicate that the big players are set to send the price up.
Renko going up on before news (earnings) and an event (expiry) despite the sight increase in ATR 14 is often an indication that the big guys know something positive about Biocon.
Observe but trade only if convinced. Set a tight SL if you go for it at opening.


