Sagility cmp 50.07 by Weekly Chart view since listedSagility cmp 50.07 by Weekly Chart view since listed
- Support Zone 43.50 to 47.50 Price Band
- Resistance Zone 53.75 to ATH 57.89 Price Band
- Darvas Box Chart Setup : Price traversing between 47 to ATH 53.25 range since Nov 2025
- Volumes facing selling pressure at each uptrend at Resistance Zone lower side price level
- Bullish Rounding Bottoms have been made between the Support Zone and Resistance Zone
- Resistance Zone Breakout trigger may happen but is subject to Volumes increase exponentially
Resistancerejection

Medplus Health Services cmp 814.85 by Weekly Chart view since liMedplus Health Services cmp 814.85 by Weekly Chart view since listed
- Support Zone 720 to 780 Price Band
- Resistance Zone 865 to 915 Price Band
- Next Resistance Zone 975 to 1045 Price Band
- Stock Price unable to Break 2nd Resistance Zone
- Support Zone well tested retested on Daily Chart view
- Volumes need improvement been below the avg traded qty
- Bullish Rounding Bottoms retraced at 2nd Resistance Zone neckline

RACL Geartech cmp 1185.10 by Weekly Chart viewRACL Geartech cmp 1185.10 by Weekly Chart view
- Support Zone 1005 to 1115 Price Band
- Resistance Zone 1265 to 1350 Price Band
- Rising Support Trendline seems taking positive trend
- Volumes more by selling post Resistance Zone rejection
- Bullish Cup & Handle inside probable Cup & Handle (hopefully)
- Support Zone Breakout attempts are seen in the making process

Belrise Inds cmp 157.70 by Daily Chart view since listedBelrise Inds cmp 157.70 by Daily Chart view since listed
- Support Zone 150 to 157 Price Band
- Resistance Zone 166.50 to ATH 172.68 Price Band
- Price traversing within Rising Price Channel since listed
- Volumes need to increase for sustained upside movement
- Support Zone been tested retested since mid of November 2025
- Bullish Rounding Bottoms retracing at Resistance Zone inclusive of ATH 172.68

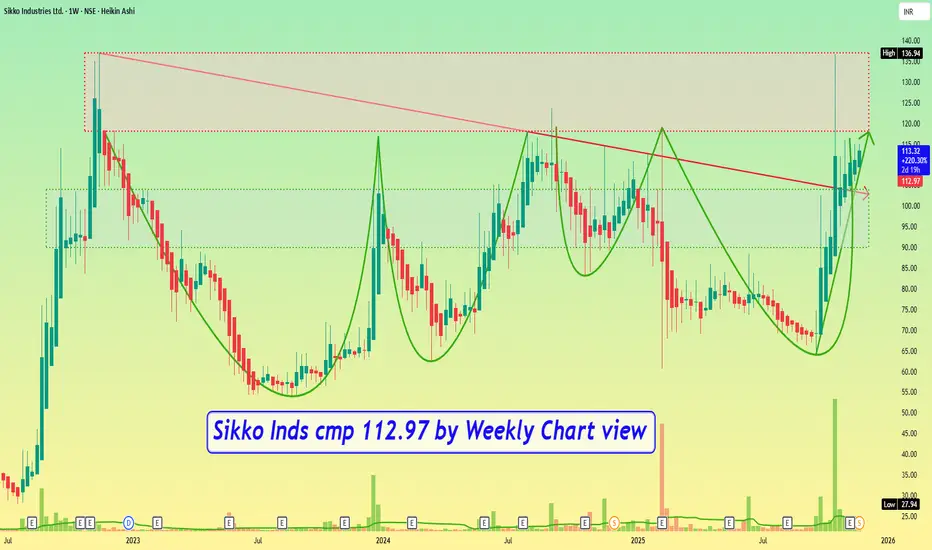
Sikko Inds cmp 112.97 by Weekly Chart viewSikko Inds cmp 112.97 by Weekly Chart view
- Support Zone 90 to 104 Price Band
- Resistance Zone 118 to ATH 136.94 Price Band
- Volumes in good sync with average traded quantity
- Bullish Rounding Bottoms by Resistance Zone neckline
- Resistance Zone holding strongly at each breakout attempts
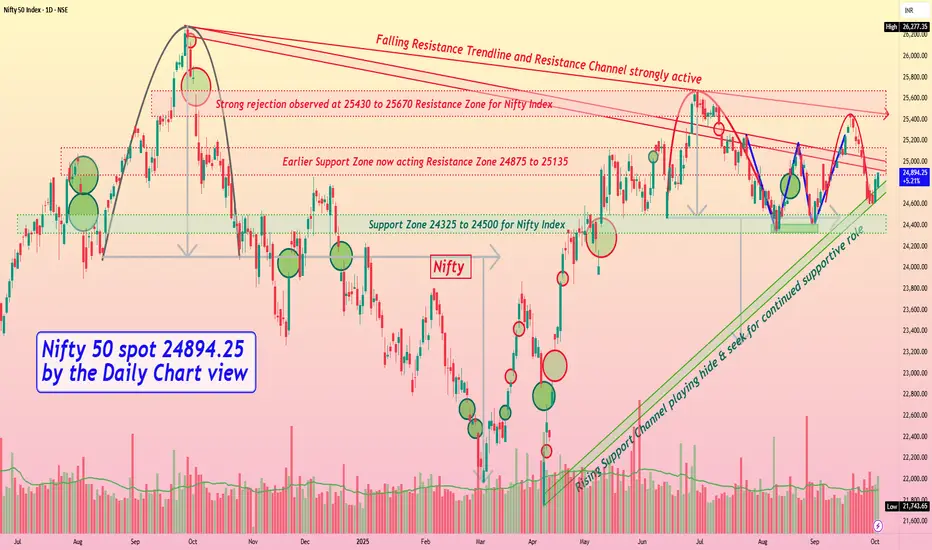
Nifty 50 spot 24894.25 by Daily Chart view - Weekly updateNifty 50 spot 24894.25 by Daily Chart view - Weekly update
- Support Zone 24325 to 24500 for Nifty Index remains active
- Rising Support Channel playing hide and seek for continued supportive role
- Strong rejection observed at 25430 to 25670 Resistance Zone for Nifty Index
- Current Resistance Zone 24875 to 25135 of Nifty Index remains an active hurdle
- Falling Resistance Trendline and Resistance Channel are still playing out pretty strongly
- Bearish Rounding Top scenario effect seems been negated by upswing over the past 2 days
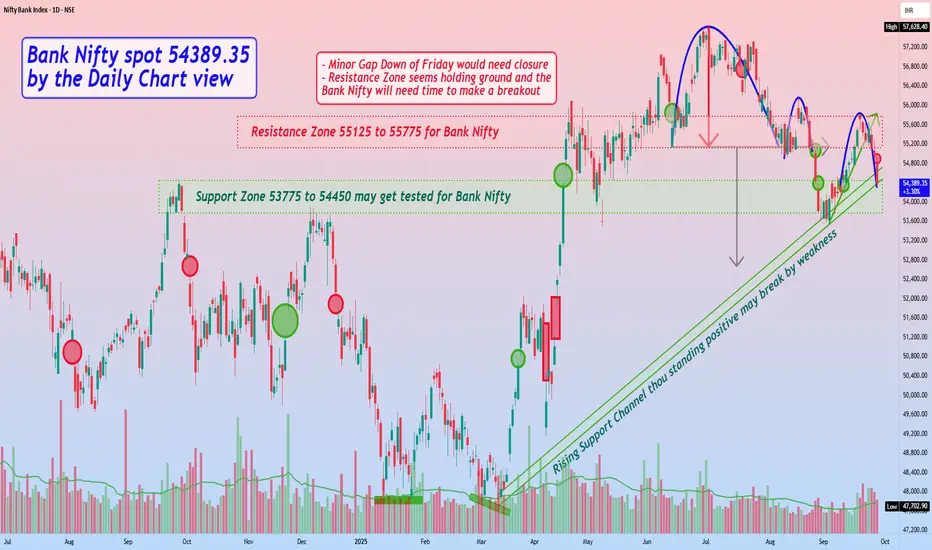
Bank Nifty spot 54389.35 by Daily Chart view - Weekly updateBank Nifty spot 54389.35 by Daily Chart view - Weekly update
- Minor Gap Down of Friday would need closure
- Resistance Zone 55125 to 55775 for Bank Nifty
- Bearish Rounding Top has made again at Support Zone neckline
- Rising Support Channel thou standing positive may break by weakness
- Support Zone 53775 to 54450 may get tested for Bank Nifty by ongoing weakness
- Resistance Zone seems holding ground and the Bank Nifty will need time to make a breakout
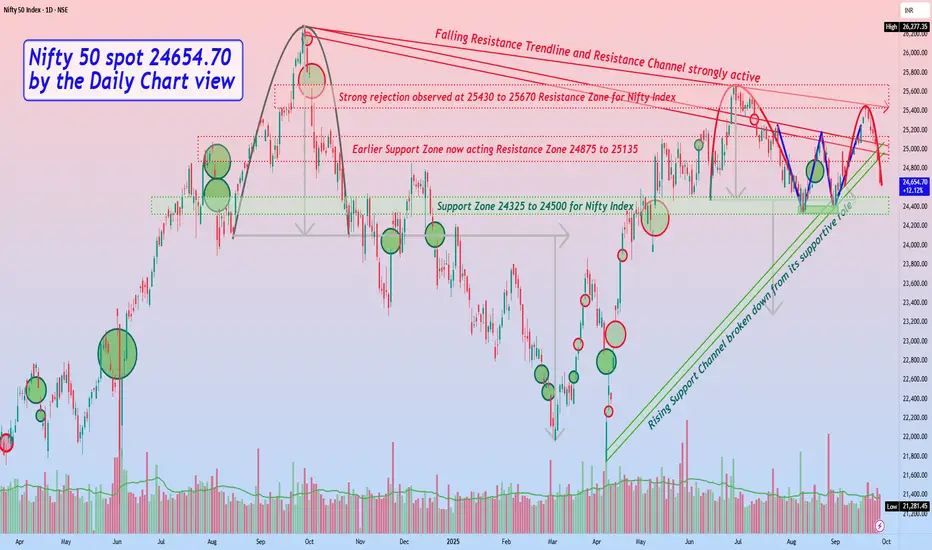
Nifty 50 spot 24654.70 by Daily Chart view - Weekly updateNifty 50 spot 24654.70 by Daily Chart view - Weekly update
- Support Zone 24325 to 24500 for Nifty Index
- Rising Support Channel broken down from its supportive role
- Earlier Support Zone now acting Resistance Zone 24875 to 25135
- Falling Resistance Trendline and Resistance Channel are strongly active
- Strong rejection observed at 25430 to 25670 Resistance Zone for Nifty Index
- Bearish Rounding Top is seen in the making process with Support Zone neckline
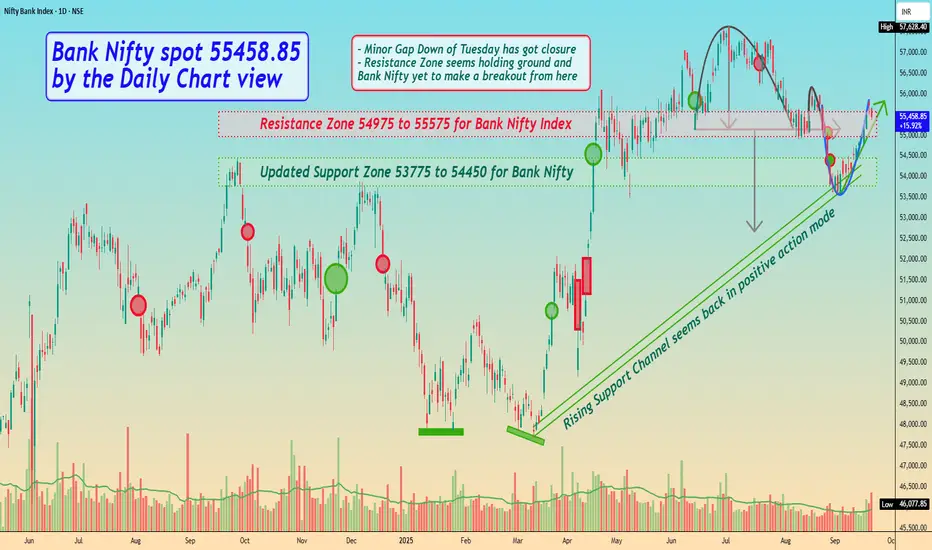
Bank Nifty spot 55458.85 by Daily Chart view - Weekly updateBank Nifty spot 55458.85 by Daily Chart view - Weekly update
- Minor Gap Down of Tuesday 26th Aug got closure
- Resistance Zone 54975 to 55575 for Bank Nifty Index
- Updated Support Zone 53775 to 54450 for Bank Nifty
- Rising Support Channel seems back in positive action mode
- Resistance Zone seems holding ground and Bank Nifty yet to make a breakout from here
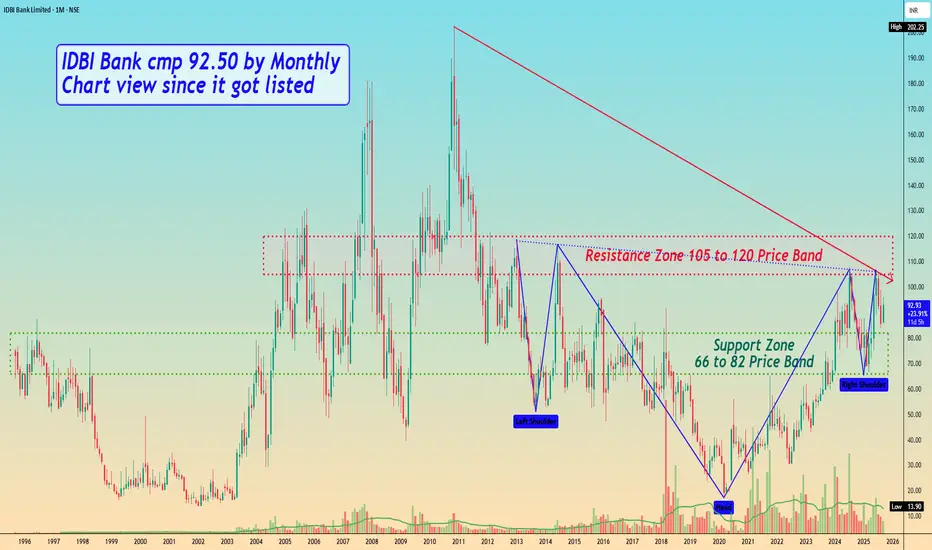
IDBI Bank cmp 92.50 by Monthly Chart view since it got listedIDBI Bank cmp 92.50 by Monthly Chart view since it got listed
- Support Zone 66 to 82 Price Band
- Resistance Zone 105 to 120 Price Band
- Bullish Cup and Handle done indicative of good upside probability
- Resistance Zone acting strongly hence Price move getting rejected since October 2011
- Breakout above Resistance Zone needs heavy traded Volumes increase and needs to sustain above it for few days to foresee and anticipate fresh upside 🤞🏽🤞🏽🤞🏽🤞🏽
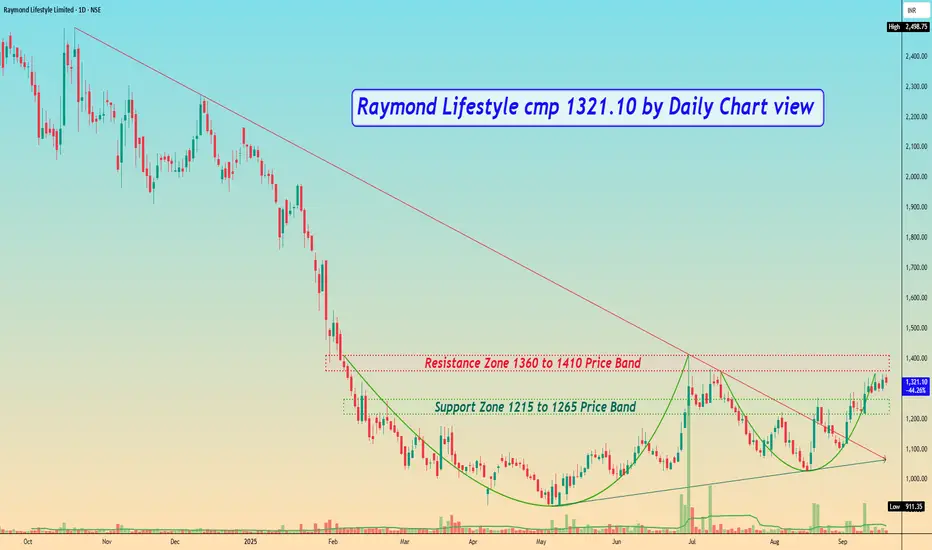
Raymond Lifestyle cmp 1321.10 by Daily Chart viewRaymond Lifestyle cmp 1321.10 by Daily Chart view
- Support Zone 1215 to 1265 Price Band
- Resistance Zone 1360 to 1410 Price Band
- Bullish Rounding Bottoms by Resistance Zone neckline
- Resistance Zone tested rested prior to Breakout attempt
- Breakout sustained above the Falling Resistance Trendline
- Volumes seem subdued, need to increase for good Breakout
- Chart showing indicative positive setup for BB, EMA, MACD, RSI
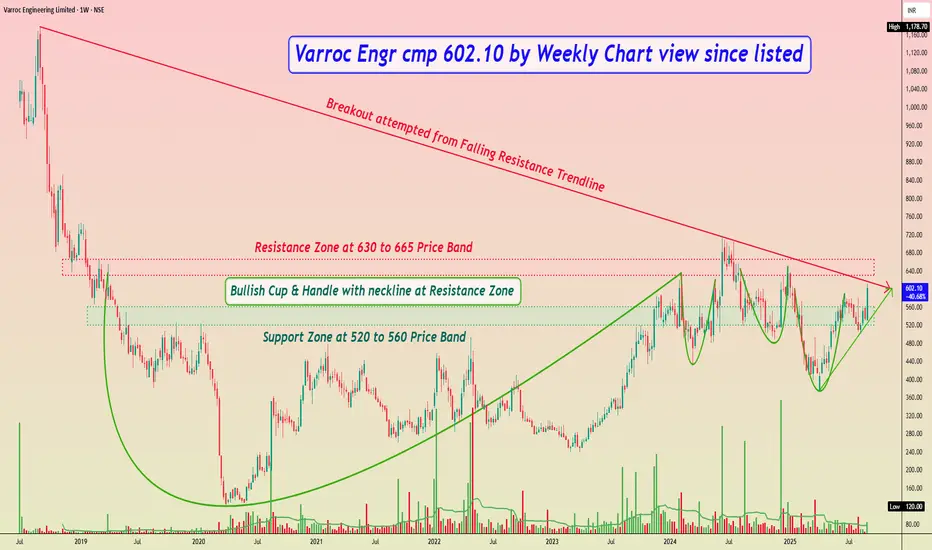
Varroc Engr cmp 602.10 by Weekly Chart view since listedVarroc Engr cmp 602.10 by Weekly Chart view since listed
- Support Zone at 520 to 560 Price Band
- Resistance Zone at 630 to 665 Price Band
- Breakout attempted from Falling Resistance Trendline
- Bullish Cup & Handle with neckline at Resistance Zone
- Bullish Rounding Bottoms also formed by Resistance Zone neckline
- Heavy Volumes based Breakout on Daily Chart after Support Zone testing retesting
Diffusion Engineers cmp 357.70 by Daily Chart view since listedDiffusion Engineers cmp 357.70 by Daily Chart view since listed
- Support Zone 325 to 345 Price Band
- Resistance Zone 365 to 385 Price Band
- Volumes are seen spiking above the average traded quantity
- Price trending and respecting the rising Rising Support Trendline
- Dotted Falling Resistance Trendline Breakout seems been attempted
- Multiple Bullish Rounding Bottoms rejected at Resistance Zone neckline
- Price reversed multiple times and backed out by strong Resistance Zone since listed
- Breakout above Falling Resistance Trendline from ATH level seems well sustained for now
- Price Breakout only possible by continued Volumes increase and few days closure above Resistance Zone

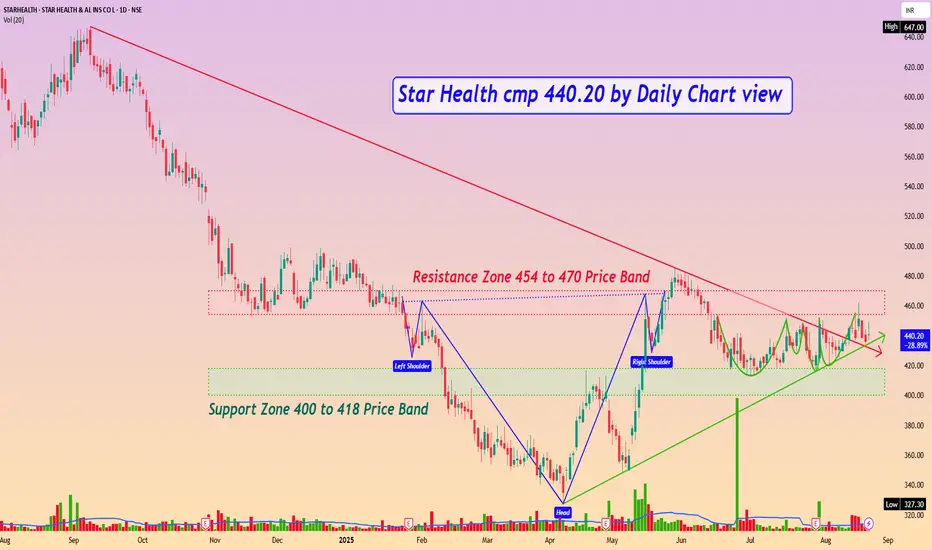
Star Health cmp 440.20 by Daily Chart viewStar Health cmp 440.20 by Daily Chart view
- Support Zone 400 to 418 Price Band
- Resistance Zone 454 to 470 Price Band
- *Price repeatedly rejected down from the Resistance Zone*
- Falling Resistance Trendline Breakout seems to be sustained
- *Volumes falling by selling pressure from the Resistance Zone*
- Rising Support Trendline yet well respected by up-trending price
- *Stock Price traversing within the Darvas Box between Support and Resistance*
- Bullishness indicated by Technical patterns Head & Shoulders and Rounding Bottoms
- *Price Breakout post crossing and sustaining for few days over Resistance Zone neckline hurdle*
Zydus Lifesciences cmp 989.45 by Daily Chart viewZydus Lifesciences cmp 989.45 by Daily Chart view
- Support Zone 946 to 966 Price Band
- Resistance Zone 996 to 1016 Price Band
- Falling Resistance Trendline and Zone Breakout attempted
- Volumes seem in decent sync with the average traded quantity
- Multiple Bullish Rounding Bottoms with Cup & Handle by Resistance Zone neckline
- Resistance Zone acting as a strong hurdle to crossover and breakout basis past reversals

IOC LONG (167-170), AT UPTREND SUPPORT LINE AND READY TO BLOWTechnical Analysis of Indian Oil Corporation (IOC) - Daily Chart
Note: I bought at 168 and find next major support at 155.
1. Support Zone: The stock has consistently found support around the 160-165 range, as indicated by the green arrows. This shows strong buying interest in this zone, preventing the price from falling further.
2. Volume Spikes: Noticeable volume spikes occurred when the price moved upwards, highlighted by the green arrows. This is a bullish indicator, suggesting increased buying activity and investor confidence.
3. Uptrend Support Line: The stock has been respecting an uptrend support line (blue), which indicates a gradual increase in price and a bullish trend.
4. Resistance Zone 1 (Purple): The stock faced resistance around the 180-185 range multiple times (red arrows). Although there were attempts to break out of this zone, they failed, indicating this area as a significant resistance level.
5. Resistance Zone 2 (Green): The next resistance level is around the 195-200 range. Breaking through this zone would signal further bullish momentum.
6. Short-term Target: The short-term target for the stock is around 189, which is just above Resistance Zone 1. If the stock breaks this level, it could see further upward movement.
7. Long-term Target: The long-term target is set at 225, indicating potential for substantial gains if the bullish momentum continues.
Conclusion
The technical indicators suggest a bullish outlook for Indian Oil Corporation, with strong support levels, volume spikes on upward movements, and potential breakout targets.
Disclaimer: I am not SEBI certified, and this is not financial advice. Always conduct your own research before making any investment decisions.

JBCHEPHARM - KEEP EYE ON IT (LONG SETUP) | ASCENDING TRIANGLEThis is how I see the future of JBCHEPHARM. Keep an eye on it for possible entry opportunities.
Disclaimer: I am not SEBI certified and these are my personal views. Please do your research before making any investment decisions.

14 year resistance Price moving near 14 years of resistance since 2010 expecting price movement up till 80% only if the price breaks above 410-470 range. Analysis based on support and resistance only.
Personal views only, please do your own research.

Evening star - Reversal patternThe pattern has formed at the resistance zone and the price has come below the important support of the 17600 range.
As per the volume profile majority of price, action has happened on the 17300 level. It can be considered the next level of support.

JUBILANT INGREVIA DAILY CHART AS ON 11.01.2022 TARGET ACHIEVEDPosted 10.01.2022 JUBILANT INGREVIA stock above 617 for a target 624 and today the stock made high 625 and closing at 606.

GABRIEL INDIA DAILY CHART ANALYSIS AS ON 10.01.2022GABRIEL INDIA as per daily chart analysis stock has broken the consolidation zone and today it had tried to break the resistance 149. Stock above 150 for a target 155. Resistance at 158 level.

INDIA GLYCOLS DAILY CHART ANALYSIS AS ON 04.01.2022INDIA GLYCOLS as per daily chart analysis stock once breaks resistance 1016 then above 1017 and target 1027. As per my view tomorrow might be a bearish day after a initial rise or gap up.

INDIA PESTICIDES DAILY CHART ANALYSIS AS ON 23.12.2021INDIA PESTICIDES as per daily chart analysis stock above 325 level for a target 335 level. Happy Trading to all.
