IPCA Labs – Trend Reversal After Long ConsolidationNSE:IPCALAB has successfully transitioned from a downtrend into a bullish structure after months of sideways consolidation. The breakout above the falling trendline followed by a controlled pullback suggests accumulation.
As long as price holds above ₹1450, the trend remains positive and a fresh breakout above ₹1500 can open the door for further upside.
Reversalpattern

JTLIND: 3 year Downtrend Trendline Breakout, Chart of the WeekFrom ₹138 to ₹50: Why This Old Multi-Bagger Steel Stock Just Hit 20% Upper Circuit, Breaking 3-Year Downtrend and Getting a Big Order. Let's Understand in "Chart of The Week"
As per the Latest SEBI Mandate, this isn't a Trading/Investment RECOMMENDATION nor for Educational Purposes; it is just for Informational purposes only. The chart data used is 3 Months old, as Showing Live Chart Data is not allowed according to the New SEBI Mandate.
Disclaimer: "I am not a SEBI REGISTERED RESEARCH ANALYST AND INVESTMENT ADVISER."
This analysis is intended solely for informational purposes and should not be interpreted as financial advice. It is advisable to consult a qualified financial advisor or conduct thorough research before making investment decisions.
Price Action:
- Current Price: ₹72.29
- 52W High: ₹138.30
- 52W Low: ₹21.79
- The stock has recently broken above a critical downward trendline that had been in effect since mid-2024, showing strong reversal momentum with 15x average volume spike
Volume Spread Analysis:
Volume Characteristics:
- Average Volume: 1.42M shares
- Recent Spike: 21.33M shares (15x average)
- This represents exceptional institutional participation and strong momentum buying
- Historical volume spikes occurred during the 2021-2023 rally phase, suggesting similar strong hands accumulation
Volume Patterns:
- Volume dried up significantly during the downtrend, reaching multi-year lows near the ₹50 base
- This "spring" action with low volume at support followed by explosive volume on breakout is a classic Wyckoff accumulation pattern
- The volume bar chart shows distinct phases: high volume during 2023 rally, declining volume during correction, and massive spike on recent breakout
Volume-Price Correlation:
- The stock showed positive volume-price correlation during the breakout, confirming institutional buying
- Previous high-volume days in 2023 coincided with price rallies, suggesting volume leads price for this stock
- Current volume expansion suggests a potential multi-week rally ahead
Base Formation and Support Levels:
- Primary Base: ₹50-55 zone (marked with horizontal green dashed line)
- This base represents a critical accumulation zone where most institutional hands exchanged during the 2021-2022 period
- The stock tested this support multiple times between 2021-2022 before the explosive rally to ₹138
- Recent re-test of this base in late 2025/early 2026 at ₹50-52 suggests strong institutional buying interest
- Secondary Support: ₹21-22 zone represents the absolute low and panic bottom
Resistance Levels:
- Immediate Resistance: ₹80-85 zone
- Major Resistance: ₹95-100 (previous consolidation area in mid-2025)
- Critical Resistance: ₹110-115 zone
- Ultimate Resistance: ₹120-125 (prior to all-time high of ₹138.30)
Trendline Analysis:
- A clear downward trendline has been connecting lower highs since the peak at ₹138.30
- This trendline acted as resistance throughout 2024-2025, rejecting multiple bounce attempts
- Recent breakout above this trendline with massive volume confirms trend reversal
- The breakout occurred at approximately ₹60-62 level, suggesting the downtrend has been structurally broken
Breakout Confirmation:
- The recent 40% single-day rally with 20% upper circuit suggests strong momentum
- Breakout above the descending trendline with volume confirmation is a textbook bullish signal
- The stock reclaimed the ₹70 level, which previously acted as support-turned-resistance
Sectoral Backdrop:
Industry Overview:
- JTL Industries operates in the Steel Pipes & Tubes manufacturing sector, specifically focused on Electric Resistance Welded (ERW) pipes
- The company is positioned in the Basic Materials sector, under Steel & Iron Products subsector
- It serves critical end-use industries including Infrastructure, Oil & Gas, Power Transmission, Water Management, and Construction
Market Position:
- JTL is among the top 5 steel tube manufacturers in India and the largest ERW pipe manufacturer in North India
- Current manufacturing capacity: 9,36,000 MTPA (Metric Tons Per Annum) across 4 state-of-the-art facilities
- Geographic presence: Pan-India domestic market plus exports to 20+ countries across 5 continents
- Product portfolio: 1,200+ SKUs covering MS Black pipes, Galvanized pipes, Hollow sections, Solar mounting structures, Transmission towers, and specialty products
Sectoral Growth Drivers:
- Infrastructure Boom: India's infrastructure spending is accelerating with massive government projects including Bharatmala (34,800 km highways), PM-AWAS housing program, and Smart Cities 2.0
- Steel Demand Growth: India's steel demand is projected to grow at approximately 9% CAGR during 2025-2026, the highest globally according to World Steel Association
- Pipe Market Expansion: The Indian steel pipes market is expected to grow from USD 32.88 billion (2023) to USD 37.69 billion by 2030 at a CAGR of 6.43%
- Government Policy Support: Production Linked Incentive (PLI) scheme for specialty steel worth ₹27,106 crore and preferential procurement mandates support domestic manufacturers
- Power Sector Growth: Significant investments in power transmission infrastructure across India creating sustained demand for transmission towers and related products
Sector Challenges:
- Raw Material Volatility: Steel prices remain subject to global commodity cycles, coal costs, and iron ore price fluctuations
- Chinese Competition: China's steel oversupply and export surge create pricing pressure
- Environmental Regulations: EU's Carbon Border Adjustment Mechanism (CBAM) effective 2026 could add USD 80-397 per ton cost to exports
- Working Capital Intensity: Industry characterized by high working capital requirements (JTL's working capital days increased from 100 to 147 days)
Fundamental Backdrop:
Business Model:
- Integrated manufacturer of ERW steel pipes with backward integration capabilities
- Recent acquisition of 67% stake in Nabha Steels & Metals adds 2 lakh MT HRC (Hot Rolled Coil) capacity
- Diversified customer base across B2B, B2G, OEMs, and international markets reduces concentration risk
- Distribution network of 800+ dealers/distributors ensures strong market reach
Recent Corporate Actions:
- Major Order Win: Secured significant order from Punjab State Transmission Corporation Limited (PSTCL) for manufacturing 220kV transmission tower material and substation structures
- Execution Timeline: Order to be completed within FY 2025-26
- Strategic Significance: This order reinforces JTL's positioning in the power transmission infrastructure segment
- Stock Impact: The PSTCL order announcement triggered a 20% upper circuit rally, demonstrating market confidence
Financial Performance Snapshot:
- Q2 FY26 Revenue: ₹371 crores (down 22% YoY from ₹480 crores)
- Q2 FY26 EBITDA: ₹29 crores
- EBITDA Margin: Improved to 8% (from 6% YoY)
- EBITDA per ton: Increased 29% YoY to ₹4,247
- Market Capitalization: Approximately ₹2,360 crores
- Sales Mix: 88% domestic, 12% exports
Operational Efficiency Metrics:
- Despite revenue decline, operational efficiency has improved as evidenced by EBITDA margin expansion
- Higher EBITDA per ton suggests better realization and product mix optimization
- Working capital pressure visible with debtor days increasing from 40.1 to 52.8 days
Growth Catalysts:
- Capacity Expansion: With acquired Nabha Steels capacity, total capacity stands at 6 lakh MT for pipes + 2.5 lakh MT HRC + 1 lakh MT long products
- Product Diversification: Expansion into solar mounting structures, transmission towers, and specialty products reduces cyclicality
- Export Growth Potential: Recognition as "Star Export House" by Government of India supports international expansion
- Green Transition: Focus on sustainable practices and potential for green steel production aligns with global trends
Management & Governance:
- Promoter holding remains stable with recent inter-se transfers within promoter group
- ISO 9001:2015 certified operations demonstrating quality commitment
- Established in 1991, providing 30+ years of industry expertise
- Leadership under Pranav Singla (Executive Director) has articulated growth strategy and export targets
Competitive Landscape:
- Key competitors include APL Apollo Tubes, Rama Steel Tubes, Hi-Tech Pipes, Sambhv Steel
- Industry seeing consolidation with smaller players struggling with working capital and raw material costs
- JTL's integrated model and backward integration through Nabha Steels acquisition provides competitive advantage
Valuation Considerations:
- 5-Year Returns: Stock has delivered 312% returns over 5 years vs NIFTY 50's 79%
- Despite recent correction from ₹138 to ₹50, long-term value creation trajectory remains intact
- Current levels around ₹72 offer attractive entry for investors with 2-3 year horizon
- Recent order wins and capacity additions support earnings growth potential
Bull Case:
- Technical breakout from multi-month downtrend with exceptional volume confirmation
- Strong sectoral tailwinds from India's infrastructure boom and 9% steel demand growth
- Recent PSTCL order validates competitive positioning and execution capabilities
- Improved operational efficiency despite revenue headwinds
- Capacity expansion and backward integration strengthen margin profile
- Government policy support through PLI schemes and procurement preferences
Bear Case:
- Revenue declined 11% YoY in Q2 FY26, indicating near-term demand challenges
- Working capital pressure with increased debtor and working capital days
- Raw material cost volatility remains a persistent risk
- Global trade uncertainties and potential CBAM impact on exports
- Chinese steel oversupply creating pricing pressure
- Technical pattern needs confirmation with sustained trading above ₹65-70 zone
Key Monitorables:
- Quarterly revenue and EBITDA trend in coming quarters
- Execution and revenue recognition from PSTCL order
- Raw material cost trends and margin sustainability
- Order book build-up from infrastructure projects
- Working capital management improvements
- Technical price action: Holding above ₹65-70 support zone would confirm bullish reversal
My 2 Cents:
NSE:JTLIND presents an interesting technical setup following the breakout from a prolonged downtrend, supported by a major order win and improving operational metrics. The stock's 15x volume spike and 20% upper circuit rally suggest strong institutional interest resuming after extended consolidation at the ₹50-55 base.
From a sectoral perspective, the company is well-positioned to benefit from India's infrastructure boom, power transmission expansion, and robust steel demand growth. The recent PSTCL order validates its competitive capabilities in the high-value transmission infrastructure segment.
Full Coverage on my Mid-Week Newsletter coming Wednesday.
Keep in the Watchlist and DOYR.
NO RECO. For Buy/Sell.
📌Thank you for exploring my idea! I hope you found it valuable.
🙏FOLLOW for more
👍BOOST if you found it useful.
✍️COMMENT below with your views.
Meanwhile, check out my other stock ideas on the right side until this trade is activated. I would love your feedback.
As per the Latest SEBI Mandate, this isn't a Trading/Investment RECOMMENDATION nor for Educational Purposes; it is just for Informational purposes only. The chart data used is 3 Months old, as Showing Live Chart Data is not allowed according to the New SEBI Mandate.
Disclaimer: "I am not a SEBI REGISTERED RESEARCH ANALYST AND INVESTMENT ADVISER."
This analysis is intended solely for informational purposes and should not be interpreted as financial advice. It is advisable to consult a qualified financial advisor or conduct thorough research before making investment decisions.

ABLBL: Falling Channel Study — Reversal Base + Swing Opportunity1️⃣ Primary Trend: Falling Channel (Bearish to Neutral)
Price has been moving inside a well-defined descending channel (lower highs & lower lows).
This indicates controlled selling, not panic — which is important for future reversals.
The stock is currently near the lower band of the channel, a typical area where:
Short covering starts
Value buyers enter
2️⃣ Support Zone & Reversal Signs
Strong demand zone: ₹114 – ₹118
Multiple rejections from this area
Long lower wicks indicate buying interest
This zone has acted as a base, increasing probability of a pullback move.
Breakout Levels to Watch (Very Important)
Immediate resistance: ₹133 – ₹134
Horizontal resistance + mid-channel zone
First sign of strength if crossed with volume
Major trend change confirmation: ₹150 – ₹152
Break & sustain above this = channel breakout
Can shift structure from downtrend → trend reversal
Swing Trading Perspective
Inside-channel swing opportunity:
Bounce from lower channel → mid / upper channel
Upside swing zones:
Target 1: ₹133–135
Target 2: ₹145
Target 3 (only if breakout): ₹150–155
🧠 What This Chart Is Saying (Simple Words)
Selling pressure is slowing down.
The stock is building a base near support.
A short swing bounce is likely first.
A trend reversal only happens above ₹150.
⚠️ Important Note
This analysis is for educational & learning purposes only.
Not a buy or sell recommendation.

KMEW is trading in a well-defined higher high–higher low structuNSE:KMEW is trading in a well-defined higher high–higher low structure on the weekly timeframe, indicating a strong primary uptrend. Price has respected the rising trendline support multiple times, confirming the validity of the trend.
After a strong impulse move, the stock is currently undergoing a healthy pullback / consolidation near the trendline, which often acts as a demand zone in trending markets. There is no significant breakdown structure, suggesting this move is a pause rather than a reversal.
Volume expansion during the up-move followed by controlled volume during the pullback indicates lack of aggressive selling pressure. RSI remains in the bullish zone (above 60), supporting continuation bias.
As long as price holds above the rising trendline, the structure favors a trend continuation towards higher levels.

$NSE:APLAPOLLO Breakout Retest from Long-Term Resistance NSE:APLAPOLLO has recently broken out above a long-term resistance zone on the weekly timeframe, marking a structural shift from consolidation to uptrend. The highlighted zone had previously acted as a strong supply area, rejecting price multiple times in the past.
Post breakout, the stock is currently undergoing a controlled pullback / retest into the breakout zone, which is now acting as support (role reversal). Price action during the retest remains stable, with no aggressive selling pressure, indicating absorption of supply and strong demand at higher levels.
Volume expansion during the breakout phase followed by relatively lower volume during the pullback supports the view that this move is a healthy retest rather than a failed breakout. RSI continues to remain in the bullish range, suggesting momentum is intact.
As long as price holds above the breakout support zone, the structure favors a bullish continuation towards higher targets.

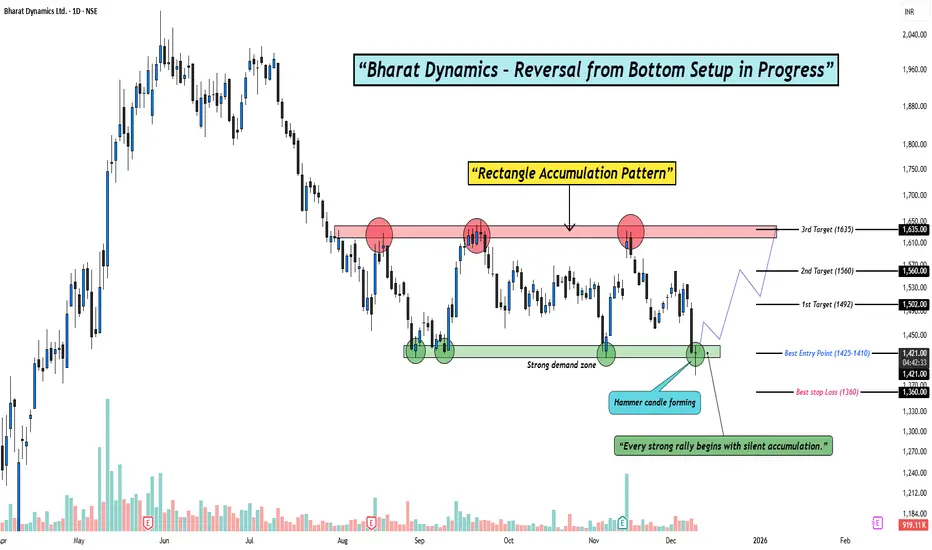
Smart Money Accumulating BDL — Are You Watching This Setup?Hello Traders!
Today’s analysis is on Bharat Dynamics Ltd. (BDL) where a clear Reversal from Bottom Setup is developing. After weeks of sideways consolidation, the stock has formed a clean Rectangle Accumulation Pattern right above a strong demand zone. The latest Hammer candle appearing inside this zone adds strong confirmation that buyers are stepping in again.
Why this setup is special?
Multiple rejections from supply and repeated buying from demand create a classic accumulation range.
The recent hammer candle shows rejection of lower prices and signals potential reversal strength.
Sideways accumulation after a downtrend often leads to strong breakout rallies when demand overpowers supply.
Levels to Track:
The best entry zone lies between 1425–1410, aligning perfectly with demand. As long as price stays above 1360, the structure remains intact. On the upside, the first target sits near 1492, followed by 1560, and finally a breakout extension target around 1635, where previous supply reacts strongly.
Rahul’s Tip:
Every strong rally begins with silent accumulation. Patterns like this look slow at first, but once the breakout hits, momentum often surprises traders who were waiting too long.
(Analysis By @TraderRahulPal | More analysis & educational content on my profile. If this helped you, don’t forget to like and follow for regular updates.)
Disclaimer:
This analysis is for educational purposes only and should not be taken as financial advice. Please do your own research or consult your financial advisor before investing.
Premier Polyfilm Ltd – Inverted Hammer Reversal at Key SupportStrong Bullish Candle After Multi-Month Downtrend
Premier Polyfilm has printed a bullish Inverted Hammer at a major support zone after a prolonged decline — a classic early reversal signal on the weekly timeframe. The stock has been falling consistently for months, and this week’s sharp +12% bounce shows strong buying interest returning near the demand zone of ₹34–₹36.
Price is now closing above the minor resistance zone (₹40–₹43). If sustained, the stock may attempt a short-term trend reversal.
RSI also shows a bullish uptick from oversold territory, supporting the possibility of a relief rally.
🎯 Key Technical Levels
CMP: ₹43.00 (+12.33%)
Immediate Resistance: ₹49–₹52
Major Resistance Zone: ₹73–₹80
Support Zone: ₹34–₹36
Major Support: ₹30
Swing SL: Close below ₹35 (weekly basis)
📈 Technical View
A clean Inverted Hammer candle formed exactly at support → early reversal signal.
RSI bouncing sharply from oversold (14–20 range).
Price reclaiming the small demand zone around ₹40–₹43.
Trend is still down, but first signs of exhaustion are visible.
Sustaining above ₹43 could lead to a move toward the 20-week EMA and the ₹49–₹52 area.
🧠 View
Premier Polyfilm has shown its first strong bullish candle after several months of selling pressure. The combination of Inverted Hammer + support + RSI reversal makes this an early-stage reversal watch. A weekly close above ₹43 strengthens the case for upside toward ₹49–₹52, and potentially ₹70+ on a medium-term basis.

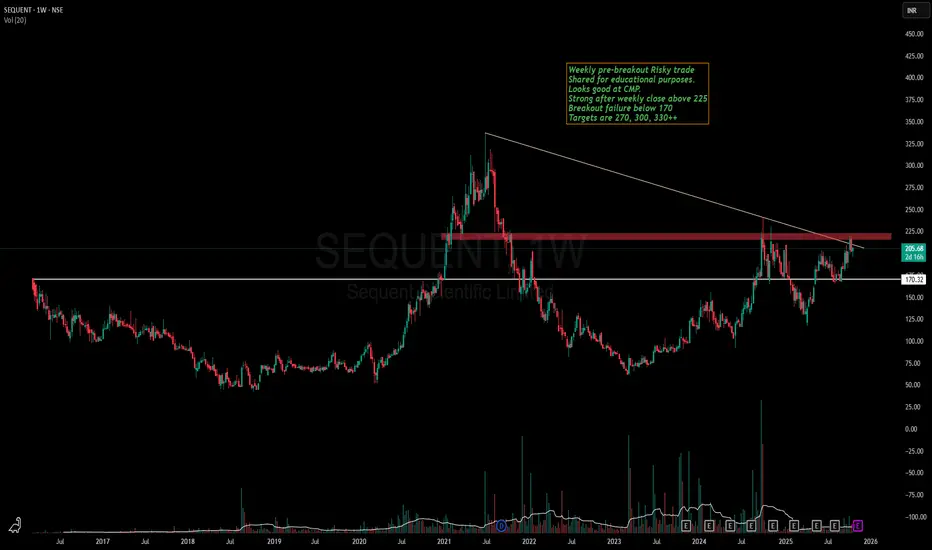
Sequent Scientific - Is it ready for a run towards ATH now?Sequent has been in my watchlist since the breakout of 170 levels.
Stock is making a good Higher high , Higher low pattern in weekly time frame and VCP in lower time frame.
Recently stock gave breakout of a strong resistance zone of 190-200 and is currently consolidating above the same.
If the breakout of 225 happens, we might see stock making a new ATH soon.
Keep this stock in watchlist and lets learn together how the patterns unveils.
This is not a recommendation and idea shared only for educational purposes
I am a NISM Certified RA & not SEBI registered.
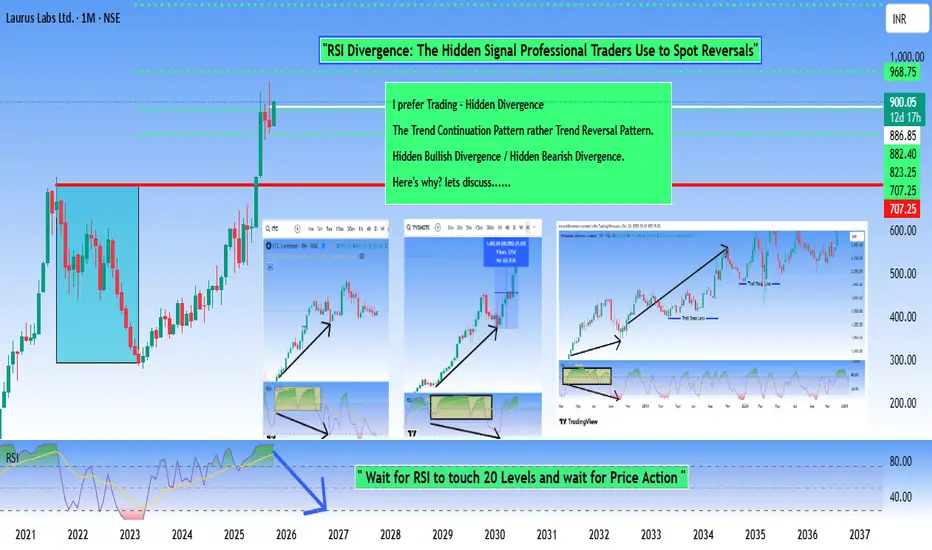
Hidden Signal Professional Traders Use to Spot ReversalsRSI divergence is a technical analysis tool used to identify potential reversals or weakening momentum in price trends.
Here's how it works:
RSI (Relative Strength Index) Divergence occurs when the price of an asset moves in one direction while the RSI indicator moves in the opposite direction.
This disconnect between Price action and Momentum is what traders find significant.
Bullish / Bearish Divergence - This Divergence occurs at the end of a trend, be it Bullish or Bearish Trend.
RSI Hidden Divergence is a more subtle and advanced form of divergence that occurs within trending markets. It's different from regular divergence because it suggests the trend will continue rather than reverse.
Why It's Called "Hidden" ?
Regular divergence is more "obvious" because Price and RSI move in completely opposite directions . Hidden divergence is subtler— It appears within the flow of an existing trend and is easy to miss, hence the name.
Reasons to Prefer Hidden Divergence Rather then Classic Divergence !!!
When we follow Classic Divergence, the possible results are....
False Signals
The biggest issue is that divergences frequently fail to produce reversals. A price may form a lower low while RSI forms a higher low, suggesting a reversal is coming, but the price continues in the original direction anyway. This can lead traders into losing trades if they act on divergence signals prematurely.
Lagging Nature
RSI divergence is a lagging indicator—by the time you spot it clearly, a significant portion of the move may already be complete. You're often trading what's already happened rather than predicting what's about to happen. The reversal might be weeks away, making it difficult for short-term traders.
Subjectivity in Identification
Identifying divergence requires drawing trend lines and choosing which highs and lows to compare. Different traders might draw these lines differently, leading to inconsistent identification of the same divergence. This subjectivity makes it harder to create reliable, mechanical trading rules.
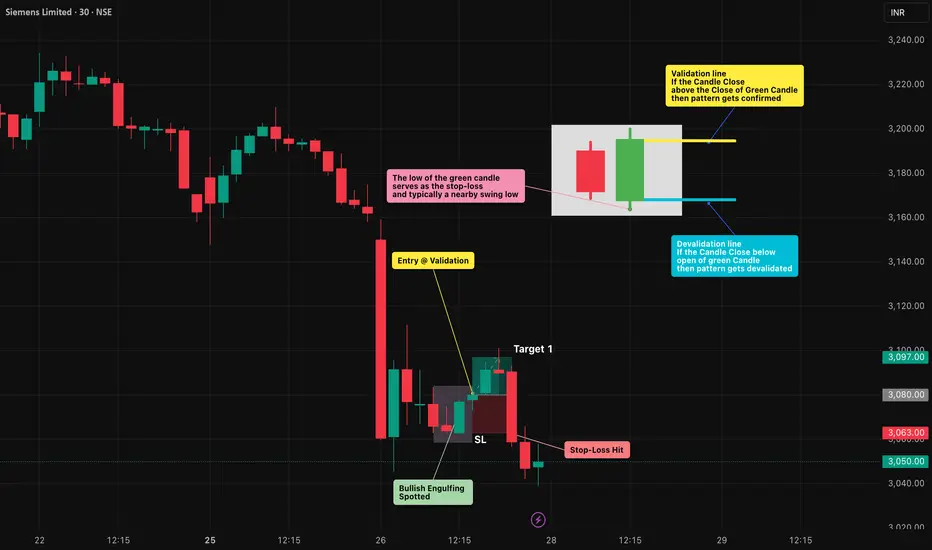
Bullish Engulfing Pattern: Spotting Reversals with Discipline🔎 Intro / Overview
Managing risk is just as important as finding an entry. The Bullish Engulfing is one of the most effective candlestick patterns to identify potential reversals. When traded with discipline, it signals a shift from seller pressure to buyer control, helping traders time their entries with confidence.
📔 Concept
A Bullish Engulfing occurs when:
The first candle is a small red candle that continues the downtrend.
The next candle is a large green candle whose body completely engulfs the red candle’s body .
👉 This shows a clear psychological shift — sellers push lower (red candle), but buyers step in strongly (green candle) and reclaim control.
📌 How to Use
✅ Validation → The candle must close above the close of the green candle.
❌ Invalidation → If price closes below the open of the green candle before confirmation.
Trading Plan:
Entry → After confirmation of the green candle’s close.
Stop-Loss (SL) → Below the low of the green candle.
Take-Profit (TP) :
Conservative → 1R (Entry → SL distance)
Moderate → 2R
Aggressive → Book partial at 1R and trail the rest using tools like ATR, Fibonacci levels, or structure-based stops to ride any extended upside move.
📊 Chart Explanation
On the chart, the first small red candle shows sellers continuing the downtrend. The next large green candle completely engulfs the red candle’s body and closes higher — signaling that buyers have taken control.
The pattern was validated at the close of the green candle , where the long entry was taken. The low of the green candle is used as the stop-loss level, while the targets are mirrored in reverse using the same distance.
In this example, Stop-loss was quickly achieved . From there, traders can apply trailing stop methods to lock in profits and manage further upside targets.
👀 Observation
Most effective at support zones or after a prolonged downtrend .
A high-volume green candle adds conviction to the signal.
In sideways/choppy markets , it can produce false signals — always filter with structure and indicators.
❗ Why It Matters?
The red candle shows seller pressure .
The green candle shows buyer strength .
This clear shift in control creates a rule-based setup with defined entry, SL, and TP.
🎯 Conclusion
The Bullish Engulfing is a strong sign of reversal — but only when combined with structure, confirmation, and disciplined risk management.
🔥 Patterns don’t predict. Rules protect.
⚠️ Disclaimer
For educational purposes only · Not SEBI registered · Not a buy/sell recommendation · No investment advice — purely a learning resource
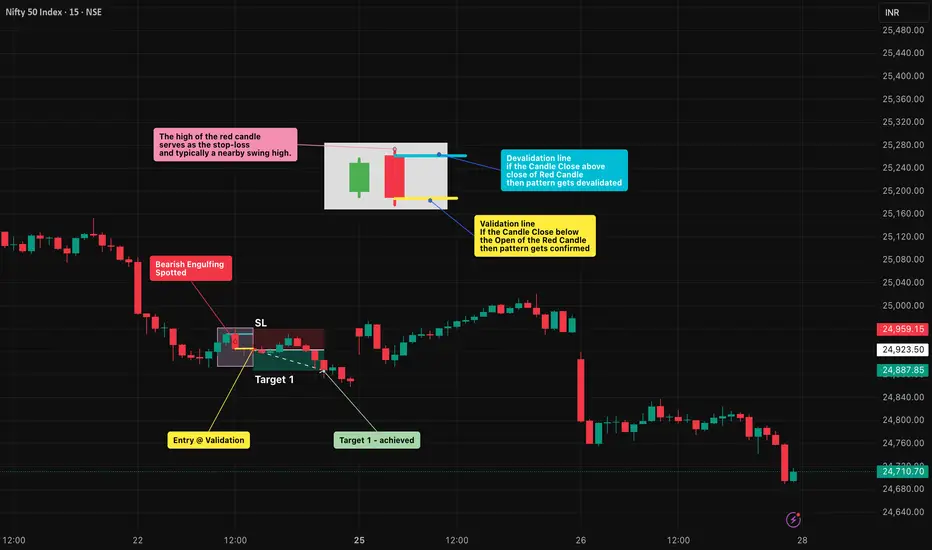
Bearish Engulfing Pattern: Spotting Reversals with Discipline🔎 Intro / Overview
Managing a trade after entry is just as important as finding the right setup. The Bearish Engulfing is one of the most reliable candlestick patterns to spot potential reversals. When traded with discipline, it helps you recognize momentum shifts early and manage risk objectively.
📔 Concept
A Bearish Engulfing occurs when:
The first candle is a small green candle that continues the uptrend.
The next candle is a large red candle whose body completely engulfs the green candle’s body .
👉 This shows a clear psychological shift — buyers push higher (green candle), but sellers step in aggressively (red candle) and erase those gains.
📌 How to Use
✅ Validation → The candle must close below the open of the red candle.
❌ Invalidation → If price closes above the close of the red candle before confirmation.
Trading Plan:
Entry → After confirmation of the red candle’s close.
Stop-Loss (SL) → Above the high of the red candle which is also a swing high.
Take-Profit (TP) :
Conservative → 1R (Entry → SL distance)
Moderate → 2R
Aggressive → Book partial at 1R and trail the rest using tools like ATR, Fibonacci levels, or structure-based stops to ride any extended downside move.
📊 Chart Explanation
On the chart, the first small green candle represents buyers continuing the uptrend. The next large red candle completely engulfs the green candle’s body and closes lower, signaling that sellers have taken control.
The pattern was validated at the close of the red candle , where the short entry was taken. The high of the red candle is used as the stop-loss level, while the targets are mirrored in reverse using the same distance.
In this example, Target 1 was quickly achieved . From there, traders can apply trailing stop methods to lock in profits and manage further downside targets.
👀 Observation
Works best when the pattern forms at major resistance levels or after a sustained uptrend .
A high-volume red candle strengthens the reliability of the signal.
In sideways or choppy conditions , false signals are common — always confirm with structure and indicators before acting.
❗ Why It Matters?
The green candle shows buyer optimism .
The red candle shows seller dominance .
This clear flip in control creates a rule-based setup with defined entry, SL, and TP.
🎯 Conclusion
The Bearish Engulfing is a strong sign of reversal — but it’s powerful only when combined with structure, confirmation, and disciplined risk management.
🔥 Patterns don’t predict. Rules protect.
⚠️ Disclaimer
For educational purposes only · Not SEBI registered · Not a buy/sell recommendation · No investment advice — purely a learning resource
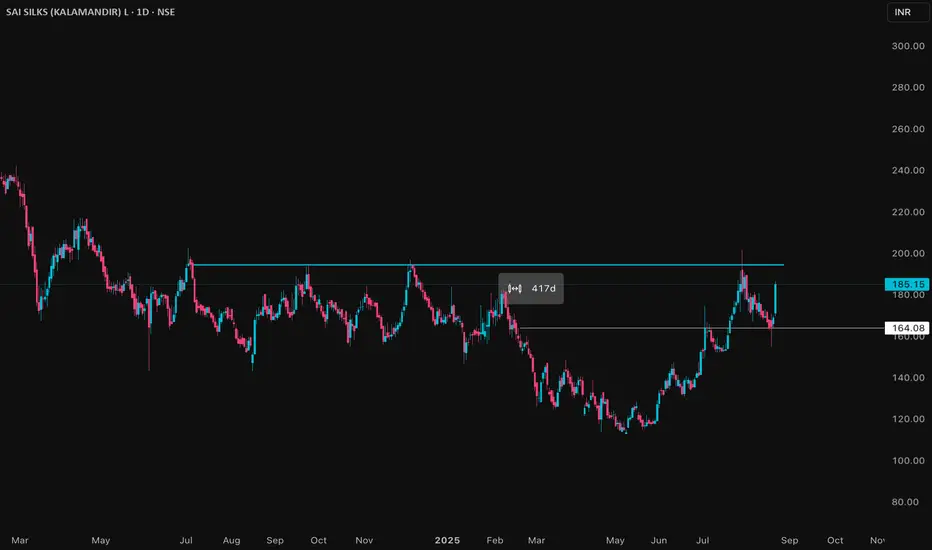
KALAMANDIR Price ActionKalamandir Industries (Sai Silks) is currently trading around ₹165–₹185 as of August 2025. The stock has seen a significant recovery in recent months after reaching lows near ₹113 in the past year. It is trading close to its 52-week high of about ₹201, indicating strong bullish momentum.
The company operates in the textile and garment retail sector, with a focus on silk and ethnic wear. Revenue growth has been moderate, with recent quarterly financials showing steady improvement in sales and profit margins, driven by an uptick in both retail and wholesale demand.
Valuation wise, the stock has a price-to-earnings (PE) ratio around 22–23, reflecting moderate market expectations for growth. The price-to-book (PB) ratio stands near 2.2, indicating a fair premium over book value.
Volume patterns show increased trading activity near current price levels, confirming investor interest. The stock is currently in a consolidation phase after a strong rally, with support around ₹150 and resistance near the recent highs at ₹200.
In summary, Kalamandir Industries is positioned for potential upside with improving fundamentals and positive technical momentum. Investors should monitor key support and resistance levels for entry or profit-taking decisions.
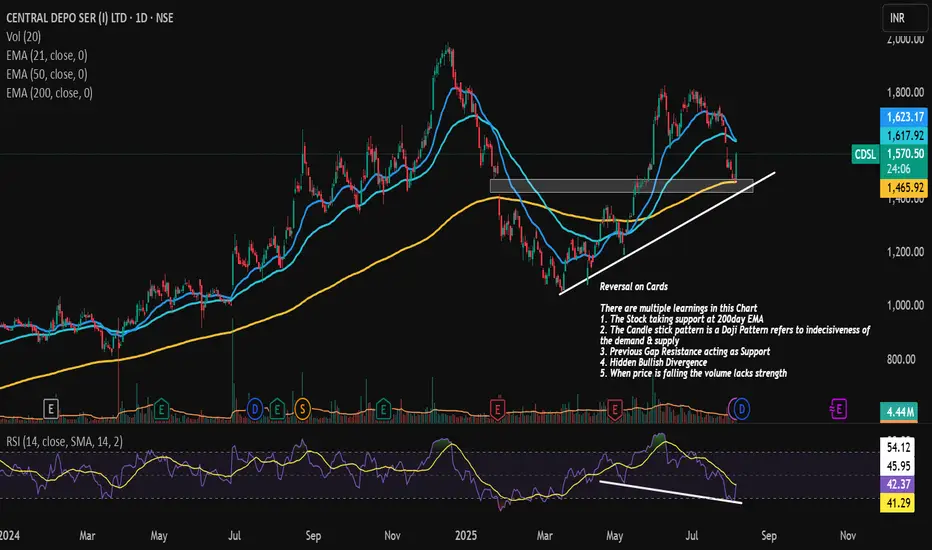
CDSL Reversal !!!CDSL is on the verge or Reversal or Temporary Pull back
There are multiple learnings in this Chart
1. The Stock taking support at 200day EMA
2. The Candle stick pattern is a Doji Pattern refers to indecisiveness of the demand & supply
3. Previous Gap Resistance acting as Support
4. Hidden Bullish Divergence
5. When price is falling the volume lacks strength
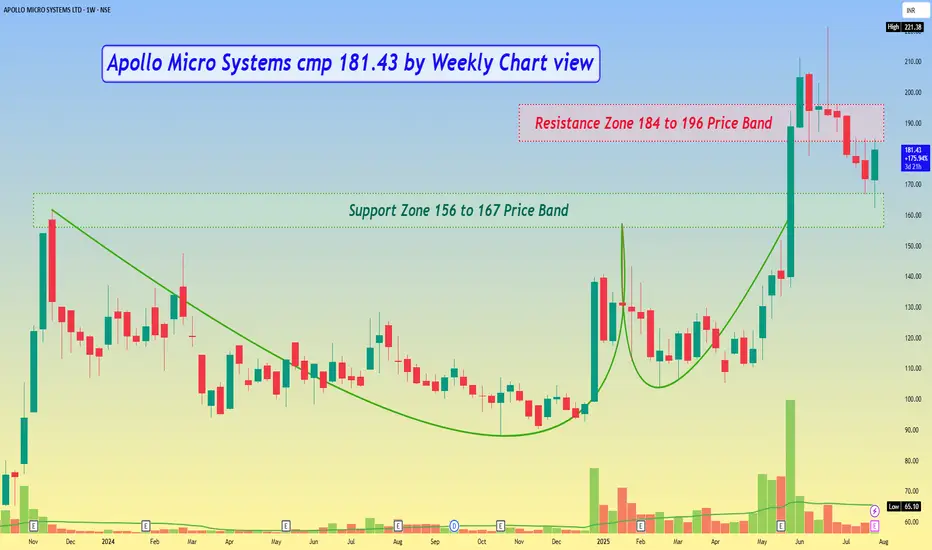
Apollo Micro Systems cmp 181.43 by Weekly Chart viewApollo Micro Systems cmp 181.43 by Weekly Chart view
- Support Zone 156 to 167 Price Band
- Resistance Zone 184 to 196 Price Band
- Support been tested retested since last week
- Volumes gradually closing in with avg traded quantity
- Price staging above EMA 20, 50, 200 with positive MACD, RSI, SAR
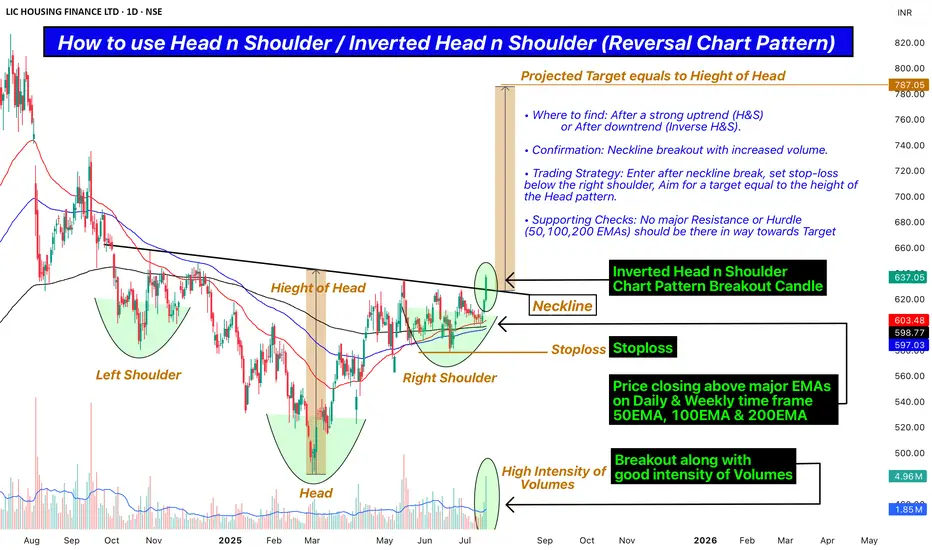
How to use Head n Shoulder / Inv. Head n Shoulder Chart Pattern.Hello Friends,
Welcome to RK_Chaarts,
Today we are going to Learn how to use Head n Shoulder / Inverted Head n Shoulder (Reversal Chart Pattern) as a Professional Trader along with real terms to check, Confirm and apply.
• Where to find: After a strong uptrend (H&S) or After downtrend (Inverse H&S).
• Confirmation: Neckline breakout with increased volume.
• Trading Strategy: Enter after neckline break, set stop-loss below the right shoulder, Aim for a target equal to the height of the Head pattern.
• Supporting Checks: No major Resistance or Hurdle (50,100,200 EMAs) should be there in way towards Target.
This post is shared purely for educational purpose & it’s Not a trading advice.
I am not Sebi registered analyst.
My studies are for educational purpose only.
Please Consult your financial advisor before trading or investing.
I am not responsible for any kinds of your profits and your losses.
Most investors treat trading as a hobby because they have a full-time job doing something else.
However, If you treat trading like a business, it will pay you like a business.
If you treat like a hobby, hobbies don't pay, they cost you...!
Hope this post is helpful to community
Thanks
RK💕
Disclaimer and Risk Warning .
The analysis and discussion provided on in.tradingview.com is intended for educational purposes only and should not be relied upon for trading decisions. RK_Chaarts is not an investment adviser and the information provided here should not be taken as professional investment advice. Before buying or selling any investments, securities, or precious metals, it is recommended that you conduct your own due diligence. RK_Chaarts does not share in your profits and will not take responsibility for any losses you may incur. So Please Consult your financial advisor before trading or investing.
Exhaustion vs Runaway Gap |How to Catch Trend and Spot ReversalsGaps often confuse traders — some lead to powerful trends, others signal trend exhaustion. In this video, I break down the key psychological and technical differences between Runaway Gaps and Exhaustion Gaps, with real examples and clean explanations.

ISLAMIC NEW YEAR OR RATHYATRA PICKTechnical View
Stock is clearly formed Cup&Handle pattern. Privious major SR Line break. Pattern made near major SR line. complete reversal formation.
RESPONIND
CMP 219
TARGET 250/275/300+++
BUY ON DIPS NEAR 200-204
SL 190( DAILY CLOSING BASIS)
Fundamental View
ROE and ROE BOTH ARE GOOD. Quaterly and Yearly boh Revenue and PAT are Highest Ever. positive cashflow..
I Am Not SEBI Registered Research Analyst. It Is Giving Only Educational Purpose. Buying in RESPONIND After Discussing With Your Financial Advisor.

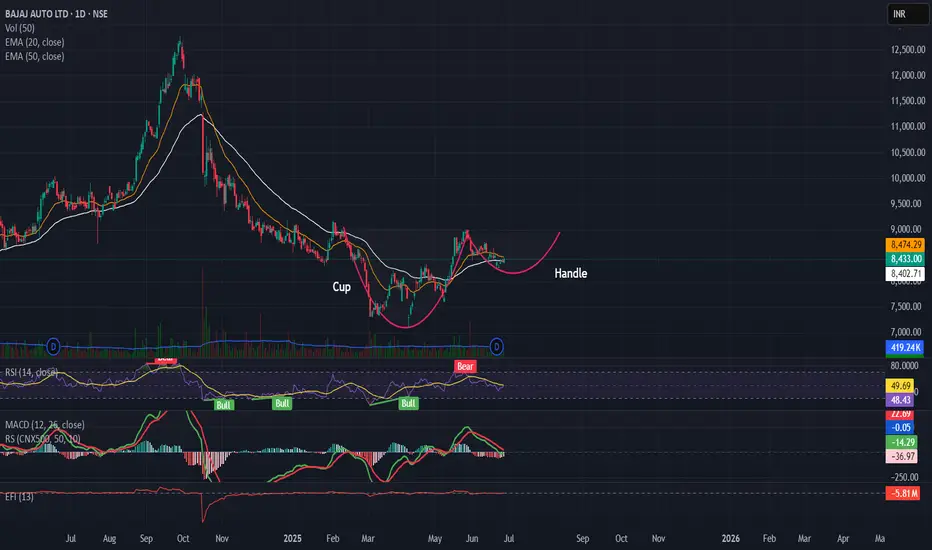
Cup and Handle Pattern in the makingAfter a 9 month long downtrend Bajaj Auto shows signs of reversal with a Cup and Handle pattern in the making with neckline breakout level at 9000
The stock trading close to the 20 and 50 EMA
RSI closing 50
MACD begins to stabalize
Target 11000
stoploss 8250
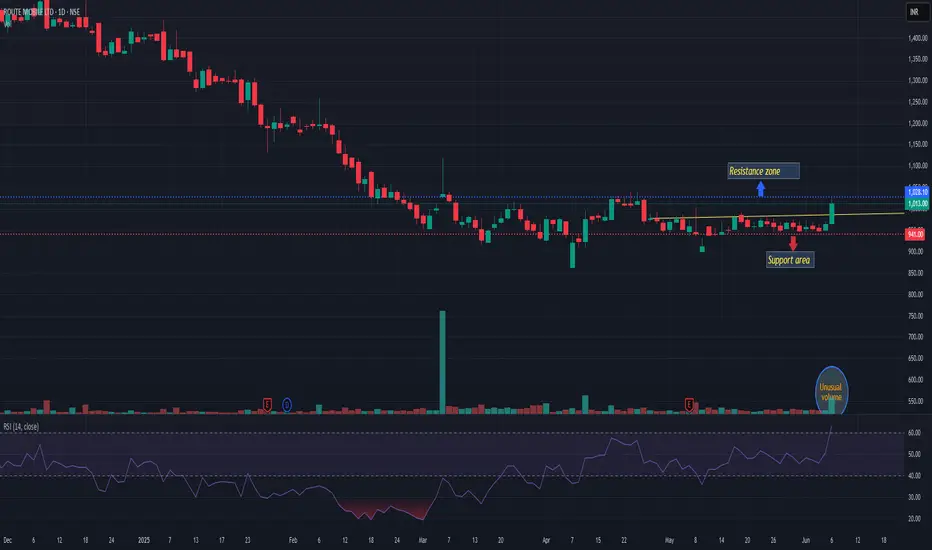
ROUTEROUTE is giving hint of reversal with unusual volume. And in mu opinion reversal will be confirmed only if it closes above 1030. If it confirmed then 15-17% from here may be possible. And if it closes below 930 may change my view. Today it is attempting to close above short term key moving averages. Keep a closer watch
PARAMOUNT COMA LTD📊 PARAMOUNT COMA LTD (1D) – CMP ₹60.08
📅 Date: May 20, 2025
📈 Exchange: NSE
📌 Ticker: PARACABLES
🧠 Technical Analysis Overview
✅ Bullish W-Pattern (Double Bottom):
Price has formed a strong W-pattern, also known as a double bottom, indicating a potential trend reversal. The neckline breakout above ₹58.00 confirms bullish momentum.
✅ Downtrend Breakout:
The long-term falling trendline has been broken decisively with strong bullish candles and increasing volume – a classic reversal signal.
✅ Volume Spike:
Breakout has occurred with significant volume (1.98M), confirming the strength of the move and hinting at potential institutional entry.
✅ Fibonacci Retracement Levels:
🔶 38.2% – ₹65.69
🟩 50.0% – ₹72.36
🟩 61.8% (Golden Ratio) – ₹79.03
💡 Price Action Strategy
🧱 Key Support & Resistance Levels
🟩 Support
₹58.00 – Previous neckline breakout level
₹50.00 – Mid-range base level
🟥 Resistance (Fibonacci-based)
₹65.69 – 38.2%
₹72.36 – 50%
₹79.03 – 61.8% Golden Ratio
📌 Conclusion
PARAMOUNT COMA LTD has triggered a strong breakout after forming a W-pattern and clearing a key trendline. With volume confirmation and upside potential toward Fibonacci levels, this could be a promising swing trade setup. Retesting ₹58 zone could offer a perfect entry opportunity.
📌 Disclaimer:
This is for educational purposes only. Not financial advice. Always do your own research or consult a financial advisor.

Dixon Technologies Bullish Bias 10% upsideThe Stock has been consolidating for a while
As visible from the RSI the stock has given a nice breakout from the range
The stock price was also falling and took support near 200day EMA zone
The price has reversed from the selling zone
3 days constant increase in the price and reversal with a W Breakout pattern
The overall sentiment looks really bullish for the counter
Also, the tariff pause shall be helping the business for a short term
Looks really bullish to me.
Caution: Trade as per your risk appetite.

NIFTY 50 Price analysis## Current NIFTY 50 Price
As of the latest data, the NIFTY 50 is trading at **23,332.35**, reflecting a gain of **+166.65 (0.72%)**.
**Short-Term Technical Outlook**
- **Resistance levels**: Immediate resistance is observed at **23,566**, with potential upside targets at **23,640**, **23,715**, and **23,810** if sustained. A decisive close above **23,800** could propel the index toward **24,500**
- **Support zones**: Key support lies in the **23,300–23,200** range, with a breakdown below **23,413** signaling short-term bearish momentum
- **Volatility**: Recent sessions saw a sharp decline to **23,486**, breaking an ascending channel pattern on lower timeframes
**Long-Term Technical Outlook**
- **Bullish scenario**: Sustaining above **23,850** may trigger a rally toward **24,000**, **24,210**, and **24,500**, with a stop-loss at **23,700**
- **Bearish risk**: A breakdown below **22,300** could indicate further downside
**Technical Indicators**
- **RSI (14)**: Neutral at **47.54**, suggesting balanced momentum
- **MACD**: Signals a buy with a value of **17.59**
- **Moving Averages**: Mixed signals, with short-term SMAs (5, 10, 20) indicating sell pressure, while longer-term SMAs (50, 100, 200) remain bullish
- **Stochastic indicators**: Overbought conditions in STOCH (99.214) contrast with oversold STOCHRSI (23.768)
**Fundamental and Sentiment Factors**
- **FII/DII activity**: Foreign Institutional Investors (FIIs) bought **₹2,240 crore** recently, while Domestic Institutional Investors (DIIs) sold **₹696 crore**. Monthly trends show FII outflows (**₹4,744 crore**) offset by strong DII inflows (**₹27,421 crore**)
- **External drivers**: A weakening U.S. dollar (DXY at **104.3**) and declining U.S. Treasury yields support rupee appreciation, potentially aiding market gains
**Valuation Metrics**
- **P/E ratio**: **21.2**
- **Dividend yield**: **1.33%**
- **Market cap**: **₹1,86,04,127 crore**
**Strategic Recommendation**
Investors may consider a **buy-on-dips strategy** for long-term positions, leveraging current valuations. Short-term traders should monitor **23,566** (upside trigger) and **23,413** (downside threshold) for directional cues
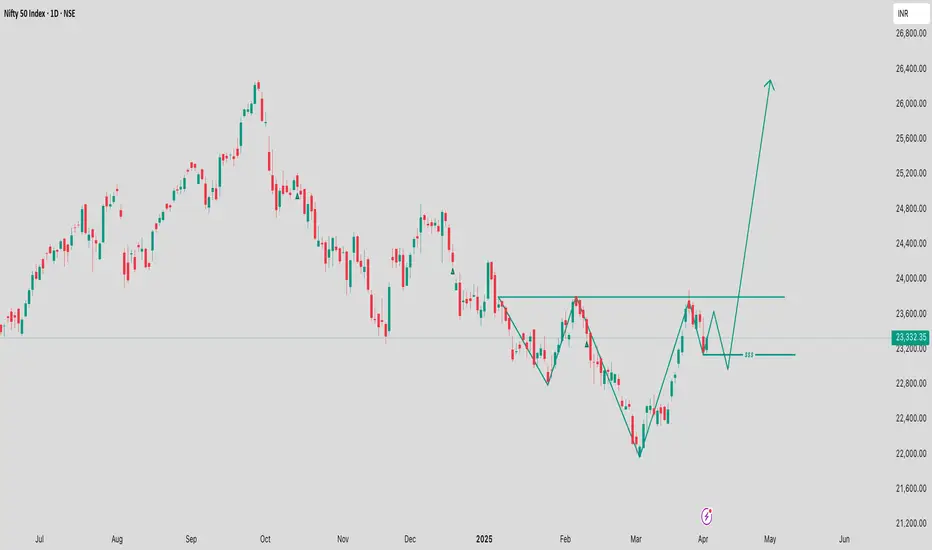
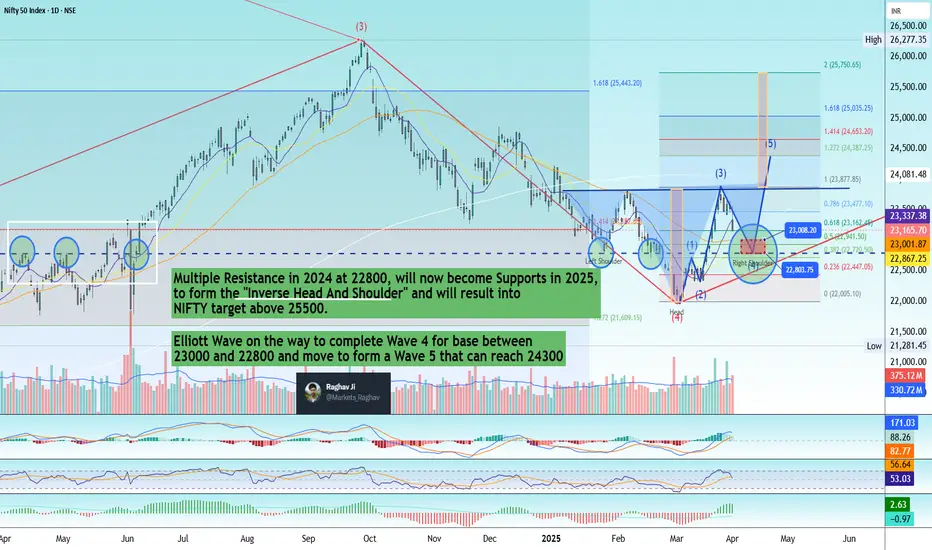
Shocked by Nifty50's sharp correction? Don't worry!Today NIFTY has crashed by 350+ points and reached 23165, a correction from 23800 levels .
Let me explain, This Nifty Daily chart is a classic example of how many fundamentals of Technical Analysis are satisfied.
1) Old resistances in 2024 at 22800 will now become Support levels
2) If it goes to 23000 and stops at 22800 levels it also fulfils the Wave 4 criteria, which says that Wave 4 never gets in Wave 1 territory
3) If this happens, the chart also completes an Inverse Head and Shoulder's Right Shoulder bottom to make an up-move towards the Neck.
4) if it crosses the Neck, the targets of Nifty will be above 25500, which will be 2500+points.
Technicals are beautiful only when you practice them.