Reliance: Channel Breakdown Below 1535Details:
Asset: Reliance Industries Ltd (RELIANCE)
Breakdown Level: 1535
Potential Targets: 1470, lower levels if selling pressure continues
Stop Loss: 1570
Timeframe: Short-term
Rationale:
Reliance has broken below the key channel support at 1535, indicating a shift toward bearish momentum. If the price continues to sustain below this level, further downside toward 1470 or even lower levels is likely.
Market Analysis:
Technical Setup: Clean channel breakdown with strong bearish candles forming.
Momentum: Weakness observed across multiple timeframes, confirming selling pressure.
Risk Management:
Stop loss at 1570 to avoid getting trapped in any pullback.
Risk-Reward Ratio:
Favorable for short positions with clear breakdown and defined targets.
Monitor for continued weakness and volume confirmation to validate the bearish move.
Ril

Reliance Industries Ltd. - Stock AnalysisDate : 30-Nov-2025
LTP : Rs. 1,567.50
Technical View:
• NSE:RELIANCE is in primary uptrend since Apr 2025 and currently trading through it's secondary uptrend since 16-Oct-2025.
• After touching the high of 1,551 on 9-Jul-2025, it has retraced 14% to 1,340.60 level.
• NSE:RELIANCE has formed a Rounding Bottom Pattern and has breakout from it's neckline with higher than average volume on 26-Nov-2025. The Rounding Bottom Neckline is marked as 1st Resistance (R1) in chart and is placed at 1,551.
• NSE:RELIANCE is trading above 20 DEMA and 50 DEMA since last few weeks.
• MACD is trading at 30.91 and RSI is trading at 72.71.
• NSE:RELIANCE is looking bullish from here onwards.
• Resistance Levels: (R2) Rs. 1,608 --> (R3) Rs. 1,680 --> (R4) Rs. 1760
• Support Level: Rs. 1,461
If you have liked this analysis, please Like/Boost this idea and follow me for more ideas.
Disclaimer : I am not a SEBI registered analyst/consultant and not recommending anyone to take any BUY or SELL position in stock market. Investing in stock market is risky and one should do a self analysis and validation before investing in stock market. My ideas are published for learning purpose only and are available to everyone at no cost/charge.

Reliance (RIL) Long Trade SetupReliance looks very promising on the daily chart. The stop loss is very close and the target is very far off. Though it has not given a buy signal yet, but I am still jumping on to it because once the buy signal is confirmed, everybody will jump in, the algos will jump in and the buy price then would not be as good as now. Use your discretion if following this.

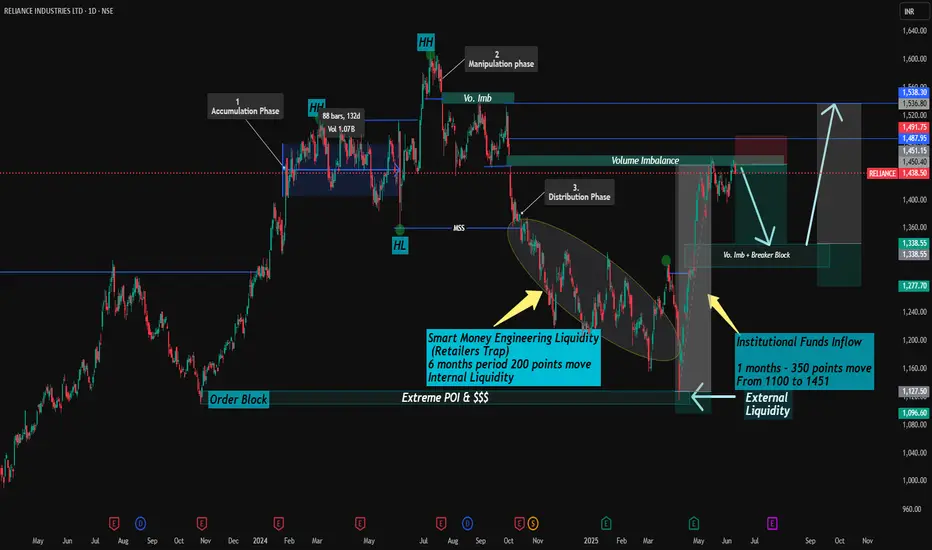
Reliance industries ltd. Deep AnalysisSharing my Analysis on Reliance (RIL). (Only for Education Purpose)
This analysis is based on Higher Time Frame (Daily)
Past Move scenario ----
1. If we see on chart, after 3rd oct. 2024, Price has completed major liquidity sweep below internal lows followed by Market Structure Shift (Marked as MSS) and for that it took 6 months.
2. After that External liquidity sweep been performed near to 1100 levels which is also marked as Extreme POI which triggered an impulse move of 350 points with funds inflow which pushed price to 1451 levels. (Here it just took 1 months only)
Current Move Scenario ----
===upside there we saw volume imbalance + Breaker block where price is making resistance or rejecting upside move.
(Potential Short Term Supply Zone 1450-1488 levels)
Expected Short Term Bias ---
Downside levels --- 1335 (Breaker Block + Discount Zone)
Upside Resistance ---- Cross of Order block range 1496
Expected Long Term Bullish Bias -- Likely after Retracement to downside Vo. Imbalance and + Breaker block
Re-Entry Long Zone - 1335-1350
Upmove expected to 1500 Imbalance levels
above that Final External Liquidity zone to 1560
Steps --- Accumulation ---Expansion ---Re accumulation, targeting External Liquidity.
Everything mentioned on chart itself.
{Above Views are only for Education purpose and do not consider it as any Advisory. Consult your Financial Advisor before investments in any securities.}
YOur Views or Comments are Welcomed.
Reliance - Is at attractive level to Buy & Invest nowRIL now around 1200-1250 levels is very good opportunity to buy and get invested for medium to long term profits. Price is at swing support and this low level was due to Elon entry into India and groupism by MF Manager to accumulate at lower levels. RIL recent land purchase at throwaway price and its business with NVDIA & Disney are few reasons to fetch more income to RIL. RBI mood to devalue to INR is +ve for RIL. Reliance is No - 1 company for 2 decades now. Stay Invested in this counter for good Profits. use this for educational purpose and consult your Advisor or take your own decision before Investing

Long Reliance Industries Between 2585 - 2660 Target 3500Reliance forming bullish Butterfly Harmonic Pattern on weekly charts and going no where up till November 20th. Good Time to accumulate.
Targets marked on charts with horizontal line. Once point B is breached and closed then rally will start.
Few triggers -
Giga factory opening in December.
JIO price hike effect
Hydrogen plant
Windfall tax removal effect
No stop loss as fall is limited.

Reliance 15 min time frame AnalysisReliance 15 min time frame Analysis for 12th July 2024 NSE:RELIANCE
stock makes Ascending Rising Wedge

RELIANCE: Running TriangleStock has already concluded a running triangle structure at OCt'23 low of 2220 and is rising in an impulsive manner. The measured target for the same is coming in the region of 3400.
Hence, stock is likely to continue it's uptrend towards 3400 with any weakness holding above the support zone of 2500-2450 in the coming months.

Reliance LongReliance trading is near good support. Good risk-reward ratio. Support marked. Target new high 2800 in 6 months. long term target 5000 in 4-5 years, value unlocking near like- retail IPO, jio ipo. stay invested.

Long Setup in GOCL CorpA bullish flag & pole Chart Pattern Breakout completed on the Weekly Time frame of NSE:GOCLCORP
Price Action supported by very good volume.
The stock is currently in uptrend making higher highs and higher lows.
One can add this stock into their stocks to buy list and initiate the long trade as per the levels mentioned on the chart
Stop loss will be on a weekly closing basis.
Trend Analysis :- UP Trend
Chart Pattern :- Bullish flag & pole Chart Pattern
Technical Indicator :- Positive MACD Crossover
Disclaimer: This is for educational purpose only.

Reliance has shown good bounce from 2480 levelsNSE:RELIANCE has shown good bounce back from 2480 levels but 2550 is going to work as resistance.

Reliance making Expanding triangle (RIL technical analysis)Reliance making Expanding triangle
(RIL technical analysis)
If this lower trend line break out than may comes to expanding triangle lower trend line. appx 2100 level
If this upper trend line break out than may comes to expanding triangle upper trend line. appx 2900 level

RELIANCE Intraday Analysis : 16-Jun-23RELIANCE imp zones mentioned on chart , all reversal and expected move mentioned with Arrow line, RED: Sell, Green: Buy
Sell< 2540 SL:2565 Target: 2510,2470,2440
Buy> 2565 SL: 2540 Target : 2585,2610,2650
Wait for Proper Rejection :
@Support : Bullish
@Resistance : Bearish
USE SL TRAILING
Any query do comment
*All views for educational purpose only

Reliance Intraday Analysis: 14-Jun-23Reliance imp zones mentioned on chart and expected direction and reversal points on chart
Buy>2522 SL: 2505
Target : 2535,2555,2600
Buy>2504 SL: 2522
Target : 2475,2460,2445
Wait for Proper Rejection :
@Support : Bullish
@Resistance : Bearish
Any query do comment
*All views for educational purpose only

RELIANCE INTRADAY ANALYSIS 05-JUN-23RELIANCE imp zones mentioned on chart
Buy > 2465 SL: 2454 Target: 2478,2500
Sell <2445 SL: 2461 Target : 2435, 2420
Wait for Proper Rejection :
@Support : Bullish
@Resistance : Bearish
Any query do comment
*All views for educational purpose only

Reliance Industries : Updated ViewCHeck RIL Day chart...King of Indian stock market...Nifty cannot move without RIL
disc : for educational purpose

RelianceAfter long time the stock has come near lower range of BB. It may be bought with small quantity if purchased for trading. Otherwise it is good level for long term accumulation. 1750 can be kept as SL for long term investor. Long term means more than 3 years minimum.
For trading buy small quantity with 3% SL. If turns favorable then add else take SL

RELIANCE 🚀You can go with long Expected target 2365 and 2422.
Note : This is just for Backtesting and Educational Purpose Only.

H&S pattern formed on Reliance target 2394There are two patterns formation on Charts.
Weekly a triangle pattern and Daily head & Shoulder pattern formed today.
daily target 2392 may be coming.
2nd possible target 2210 in case of triangle pattern breakdown on weekly chart.

RELIANCE: IMPULSIVE WAVEStock is rising in an impulsive manner on the lower degree time frame and is likely to form a five wave structure on the higher degree time frame which will be a base building for the next higher level. The current structure suggests that stock has already concluded its 3rd wave and currently retracing back in a wave-4 which is likely to conclude in the region of 2406 which is 38.2% retracement level.
Buy 2410-2406 SL 2371 tgt: 2480/2520

Reliance RSI Bearish DivergencePrice is making lower lows while the RSI is making lower highs which is clear sign of RSI Bearish Divergence.
Entry
We can enter in long trade after breakout above resistance zone with strong bullish candle.
Stoploss
Below the resistance zone.
Target
Target will be the next resistance zone.
Please Like and Follow

Strong Support reached - 20% Bounce coming?Reliance has been trading in the range of 2250 and 2750 for a while now and has finally reached the price support region again.
The formation of recent Doji in the market further confirm the indecisiveness in the market after the recent down move.
A morning star pattern or a piercing pattern might further improve our confidence, with RSI bottoming out at 30 in weekly and MACD slowly turning bullish as well.
It will be interesting to see if RIL slowly traces its way back to 2750 levels and that would be a 20% move from current levels.
Not an investment reco, just for research purpose.
Thanks for reading :)

RELIANCE is at Good Position for Long-term and Short-termRIL is consolidating in a range from nearly 10 months. From here good to BUY and Accumulate on DIPs. Short-term 10% up and long-term 20% up possible. Next up move must be a heavy lift to the next accumulation range.
Note: This analysis is from my experience. Please take your financial advisor suggestion before taking position
