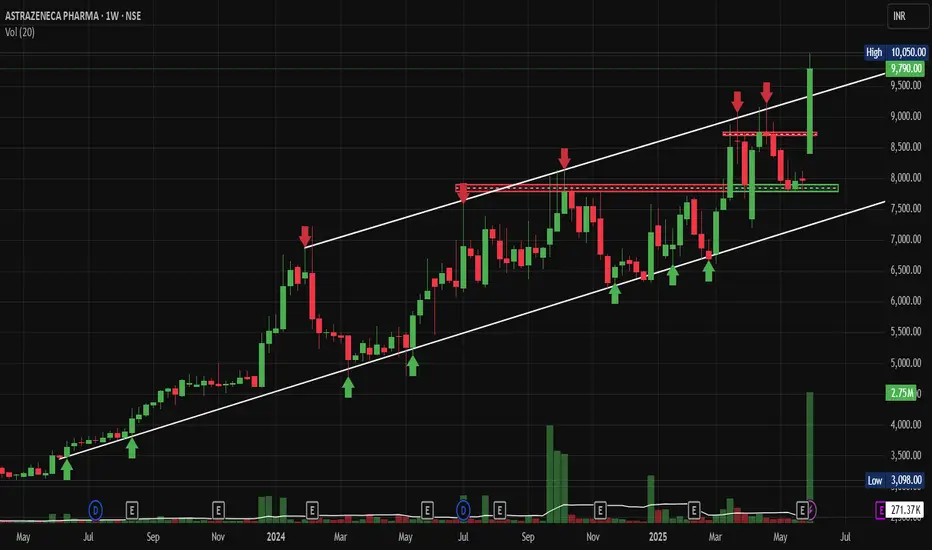
AstraZeneca Breakout Above 10000 Could Signal Next Leg, Post Q4NSE:ASTRAZEN Breakout Above 10000 Could Signal Next Leg, Post Spectacular Q4 and FY25 Numbers. Breaking out of Rising Channel, hence selected for this Week's "Chart of the WEEK"
Price Action Analysis:
• Stock has been in a strong uptrend since May 2024, rising from around 3000 levels to current levels near 9800
• Recent price action shows consolidation between the 7500-8500 levels with multiple tests of resistance
• Current price at 9409 represents a +22.80% gain, showing strong momentum
• Volume spike visible in recent sessions at 2.75M shares vs average, indicating institutional interest
• Price structure shows a higher highs and higher lows pattern intact.
Key Support and Resistance Levels:
• Primary Support: 8000-8200 zone (previous resistance turned support)
• Secondary Support: 7500-7600 (multiple bounce zone)
• Key Resistance: 8500-8600 (red horizontal line showing multiple rejections)
• Breakout Resistance: 9000 psychological level
• Current High: 10,950 acting as immediate resistance
Base Formation and Patterns:
• Rectangle consolidation pattern formed between 7500-8500 from September 2024 to March 2025
• Bullish flag pattern visible after the breakout above 8500
• Ascending triangle formation with higher lows and flat resistance around 8500
• Volume expansion during breakout confirms pattern validity
Technical Indicators:
• Strong upward-trending channel maintained since mid-2024
• Price trading above all major moving averages
• Momentum appears to be building after the recent consolidation phase
• Volume profile shows accumulation during base formation
Trade Setup:
Entry Strategy:
• Primary Entry: On pullback to 8800-9000 support zone
• Aggressive Entry: Current market price around 9400 for momentum play
• Conservative Entry: Wait for retest of 8500 breakout level
Exit Levels:
• Target 1: 10,500 (psychological resistance)
• Target 2: 11,200 (measured move from rectangle pattern)
• Target 3: 12,000 (extension target based on trend channel)
Risk Management:
• Stop Loss: 8200 for entries around 9000 (tight stop)
• Stop Loss: 7800 for swing positions (wider stop)
• Position Size: Risk 1-2% of portfolio per trade
• Risk-Reward Ratio: Minimum 1:2 for all entries
Position Sizing Guidelines:
• For 1% risk: Calculate position size based on distance to stop loss
• Maximum exposure: 3-5% of portfolio in a single stock
• Scale in approach: 50% on initial entry, 30% on pullback, 20% on confirmation
Sectoral and Fundamental Backdrop:
Pharmaceutical Sector Overview:
• Indian pharma sector benefiting from global generic drug demand
• Regulatory approvals and US FDA compliance driving growth
• Export-oriented companies are seeing currency tailwinds
• Increased healthcare spending post-pandemic, supporting sector growth
AstraZeneca Pharma Fundamentals:
• Strong presence in oncology and respiratory segments
• Robust pipeline of innovative drugs and biosimilars
• Strategic partnerships with global pharmaceutical companies
• Consistent revenue growth and expanding market share in India
• Strong balance sheet with healthy cash flows
Market Dynamics:
• Institutional buying is visible through increased volumes
• FII interest in pharmaceutical stocks remains positive
• Sector rotation favouring defensive healthcare plays
• Government initiatives supporting pharmaceutical manufacturing
Risk Factors:
Technical Risks:
• High volatility near resistance levels
• Potential for false breakouts given extended rally
• Volume confirmation required for sustained moves
• Overbought conditions in the short term
Fundamental Risks:
• Regulatory changes in pharmaceutical pricing
• Currency fluctuation impact on export revenues
• Competition from generic drug manufacturers
• Global economic slowdown affecting healthcare spending
Market Risks:
• Overall market correction could impact individual stocks
• Sector rotation away from pharmaceuticals
• Profit booking by institutional investors
• Global pharmaceutical industry headwinds
My Take:
NSE:ASTRAZEN presents a compelling technical setup with a clear breakout above long-term resistance. The stock's strong fundamentals post Q4 and FY25, combined with favourable sector dynamics, make it an attractive investment opportunity. However, risk management remains crucial given the extended nature of the current rally. Traders should consider scaling into positions on pullbacks while maintaining strict stop-loss discipline.
Keep in the Watchlist.
NO RECO. For Buy/Sell.
📌Thank you for exploring my idea! I hope you found it valuable.
🙏FOLLOW for more
👍BOOST if you found it useful.
✍️COMMENT below with your views.
Meanwhile, check out my other stock ideas on the right side until this trade is activated. I would love your feedback.
Disclaimer: "I am not a SEBI REGISTERED RESEARCH ANALYST AND INVESTMENT ADVISER."
This analysis is intended solely for informational and educational purposes and should not be interpreted as financial advice. It is advisable to consult a qualified financial advisor or conduct thorough research before making investment decisions.
Risingchannelbreakout
Breakout in GRASIMAfter a long consolidation, stock has given breakout from its Rising channel pattern and has given confirmation for breakout by a Doji and Marubozu. From the past 3 days, buying volume has been increasing consistently. Stock is trading above all its EMA.

All time high and Rising Channel Breakout seen in Gabriel IndiaHello Traders, i have brought another analysis on a pattern breakout which called (Rising Channel Pattern). Well i have marked and written most of the things on chart, but still i am gonna to teach you here guy's about this pattern so if you see this type of Rising channel pattern next time, So at least you guy's will be able to trade. So Let's start.
Q:- What is Rising Channel Pattern and How to trade that?
Rahul:- A Rising channel is the price action contained between upward sloping parallel lines. Higher highs and higher lows characterize this price pattern. Technical analysts construct a rising channel pattern by drawing a lower trend line that connects the swing lows, and an upper channel line that joins the swing highs as shown above in Gabriel India Chart. Guy's Rising channels show a clearly defined uptrend. Traders can take swing trade between the pattern’s support and resistance levels or trade in the direction of a breakout or breakdown.
Above in monthly charts we have seen a neat and clean proper breakout in Gabriel India , at same point there was a all time high which had taken place in september 2017 , after that price started forming Falling Channel Pattern in chart and it has taken support at earlier resistance zone, means price action says once a resistance is always act like support zone, after breaking out the resistance zone . Since then it has never made lower lows, and started forming a Rising channel pattern and now it has broken all time high and given a successfully Rising Channel Pattern breakout .
Now i will tell you how to Trade on this type of pattern or when it gives breakout?
There is two types of trading can be initiate in this, First you can take swing trades when it touches and reverse from lower range of channel. Second you can wait for breakout of channels upper range then you can take entry for long side but, one of the important criteria to bear in mind is there should be at least 4 points of reaction within the channel. Means price should touch at least 4 times lower range of the channel, and guy's Gabriel India Stock has touch 4 times and then given breakout.
I hope guy's you have learned about this pattern very well.
Important Levels for Gabriel India Ltd.
Best buying range will be 250-237
Targets will be 311/372++
Keep Stop loss at 193
Price is above 200 EMA. It is a positive sign for this stock.
Volumes are supporting breakout.
MACD and RSI has given Bullish Crossover.
Note:- Guy's i have not placed any indicator which i have discussed above but i have done analysis on this before publishing this idea. The reason is very simple i want my chart neat and clean and easy to understandable and i want teach purely price and action trading.
So now let's focus about company background.
Gabriel India is part of ANAND Group. From being a single-product company in 1961, They have transformed themselves in line with changing market, technical and social trends and played a key role in limiting emissions of ride control products and foster the cause of environmental protection. Company manufactures over 300 models of ride control products.
Its products include shock absorbers, struts, front forks and others.
It has a vision to be amongst top 5 shock absorber manufacturers in the world by 2025.
Market Cap
₹ 3,564 Cr.
Current Price
₹ 248
High / Low
₹ 252 / 129
Stock P/E
25.1
Book Value
₹ 60.6
Dividend Yield
1.03 %
ROCE
22.0 %
ROE
16.2 %
Face Value
₹ 1.00
Debt
₹ 11.2 Cr.
EPS
₹ 9.88
PEG Ratio
3.59
Promoter holding
55.0 %
Intrinsic Value
₹ 162
Pledged percentage
0.00 %
EVEBITDA
14.0
PROS
Company is almost debt free.
Company has been maintaining a healthy dividend payout of 24.7%
Company's working capital requirements have reduced from 37.1 days to 29.4 days
CONS
Company has a low return on equity of 12.7% over last 3 years.
Disclaimer:- Please always do your own analysis or consult with your financial advisor before taking any kind of trades.
Dear traders, If you like my work then do not forget to hit like and follow me, and guy's let me know what do you think about this idea in comment box, i would be love to reply all of you guy's.
Thankyou.

BoB| BO from Rising Channel|50% UpsideNSE:BANKBARODA
Weekly Breakout from Rising Parallel Channel
CMP trading above all major Weekly Exponential Moving Avgs and taking Support and bouncing
RSI in Bullish Zone
Tgt: 155 - 171 - 190 - 224
SL : 125
Upside Potential : 50%
Time Frame : 3 - 12 Months

Ascending channel breakdown in COROMANDELAs you can see ascending channel already broken now just need to wait to let it break the level of 994 we expect a good fall.

Ascending Channel Pattern 1. What is the Ascending channel pattern?
- Price trade within the range in an up trend, it forms a higher high and higher
low.
- The channel provides support and resistance
- Until prices continue to advance trade within the channel
- Volume Activity turns stagnant
2. How to trade it?
- If it breaks above the resistance line, extrapolate the channel range from point of the breakout point.
- If it breaks down the support line, extrapolate the channel range from point of breakdown point.

NIIT 🎯650NSE:NIITLTD broke out of a rising channel pattern and price made a green candle after retest.
Price did give a breakdown from the pattern but the bulls look more powerful than the bears.
Enter entire position at C.M.P and hold for targets of 650/700
Sl- below 380

Rising Channel on a daily chartStock movement has formed a rising channel on daily chart. However, Stock is overbought on monthly chart. Thus, stock will sluggishly move up with limited upside

UPSIDE POTENTIAL IN GUJALKALI ASCENDING CHANNEL BREAKAn ascending channel is a chart pattern formed from two upward trend lines drawn above and below a price representing resistance and support levels
The ascending channel is also known as a “rising channel” and “channel up“.
The lower line is identified first, as running along with the lows: it defines the trend line. The upper line (the “channel line”) is identified as parallel to the trendline, running along with the highs.
It is a bullish chart pattern defined by a trend line supporting the series of higher lows and a diagonal resistance level connecting the higher highs.
When in the channel, prices are expected to bounce off both upper and lower boundaries; the more such reversals occur, the more reliable the pattern.
If it breaks the upper trendline then we can buy the stock else we sell or short the stock.
this is just educational practice for myself, not investment advice please consult your financial advisor before trading or investing, I am not SEBI registered and not liable responsible for your profit and losses
