Bank Nifty spot 60120.55 by Daily Chart view - Weekly UpdateBank Nifty spot 60120.55 by Daily Chart view - Weekly Update
- Support Zone 58850 to 59350 for Bank Nifty
- Resistance Zone 60100 to ATH 60437.35 for Bank Nifty
- Bank Nifty created a New Lifetime High 61764.85 on 03rd February, 2026
- Gap Up Opening with 1106 pts of 03-Feb-2026 would need be filled, sooner or later
Risingchannels

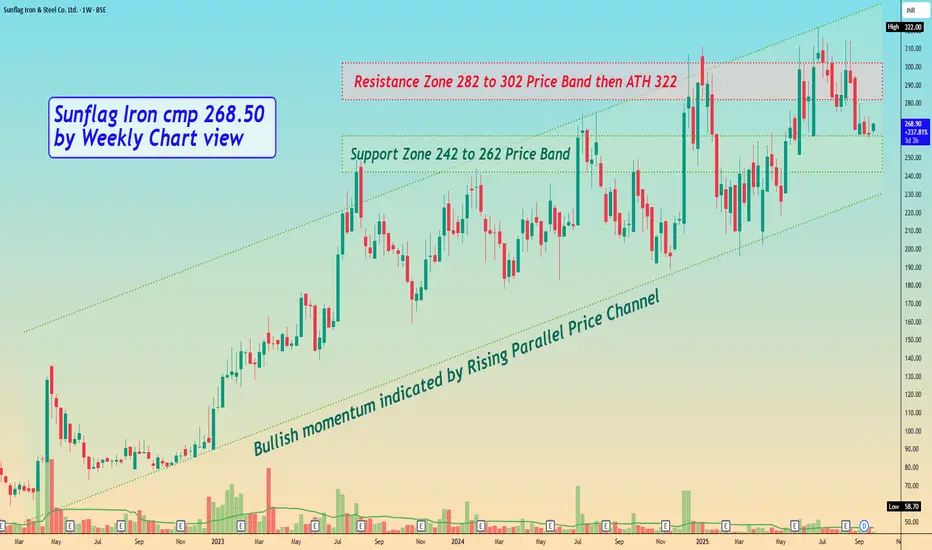
Sunflag Iron cmp 268.50 by Weekly Chart viewSunflag Iron cmp 268.50 by Weekly Chart view
- Support Zone 242 to 262 Price Band
- Resistance Zone 282 to 302 Price Band then ATH 322
- Bullish momentum indicated by Rising Parallel Price Channel
- Volumes are seen getting in close sync with average traded quantity
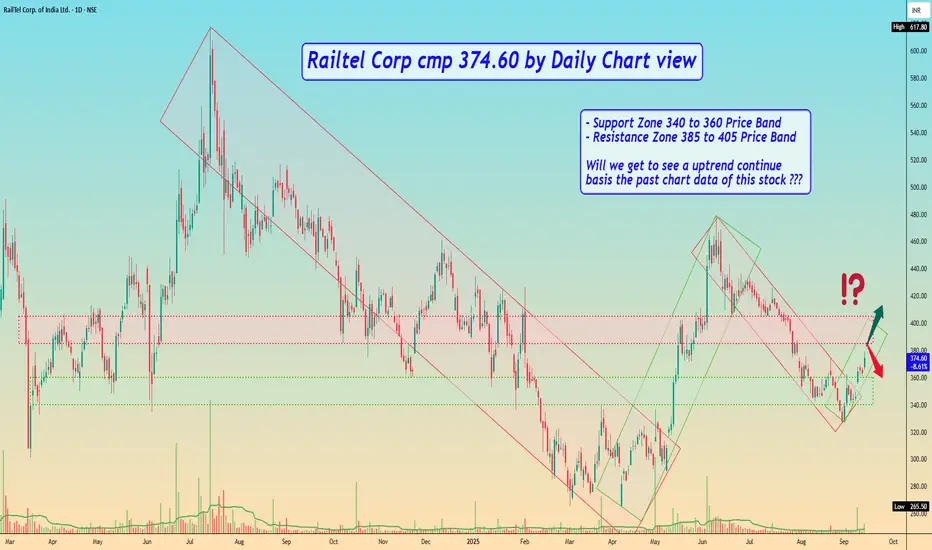
Railtel Corp cmp 374.60 by Daily Chart viewRailtel Corp cmp 374.60 by Daily Chart view
- Support Zone 340 to 360 Price Band
- Resistance Zone 385 to 405 Price Band
- Will we get to see a uptrend continue basis the past chart data of this stock ???
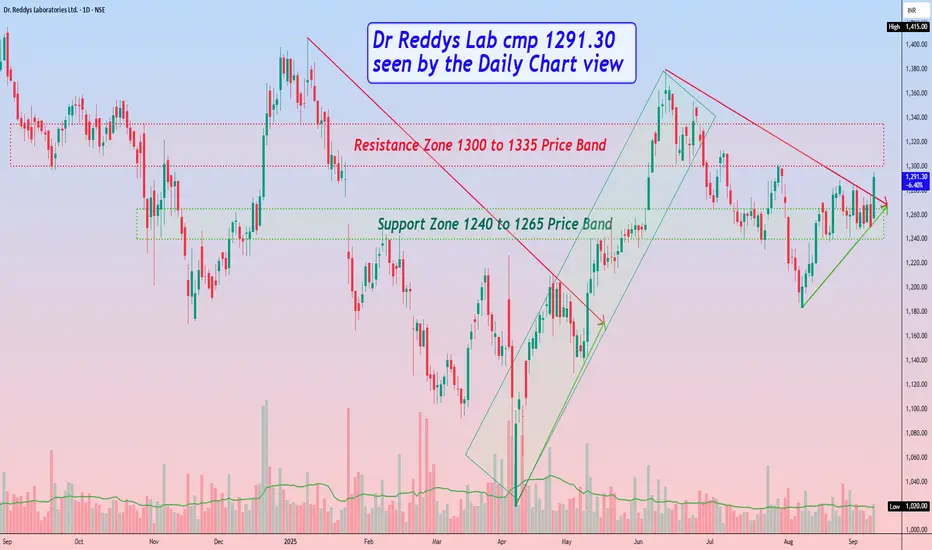
Dr Reddys Lab cmp 1291.30 by Daily Chart viewDr Reddys Lab cmp 1291.30 by Daily Chart view
- Support Zone 1240 to 1265 Price Band
- Resistance Zone 1300 to 1335 Price Band
- Breakout from Falling Resistance Trendline
- Bullish Rising Price Channel with intermittent highs and lows
- Recent history repeating by Breakout from Falling Resistance Trendline
- *Will we see a repeat Bullish Rising Price Channel with intermittent highs and lows*
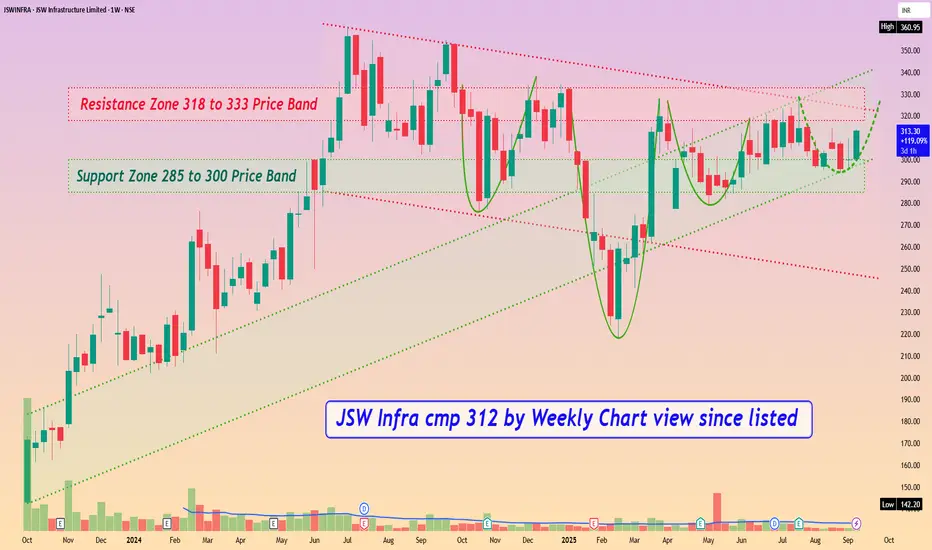
JSW Infra cmp 312 by Weekly Chart view since listedJSW Infra cmp 312 by Weekly Chart view since listed
- Support Zone 285 to 300 Price Band
- Resistance Zone 318 to 333 Price Band
- Bullish Rounding Bottoms repeated under the Resistance Zone neckline
- Stock making Higher High Lower High pattern within up-trending price channel momentum
- Stock traversing within Rising Support + Price Channel and attempting Falling Resistance + Price Channel Breakout
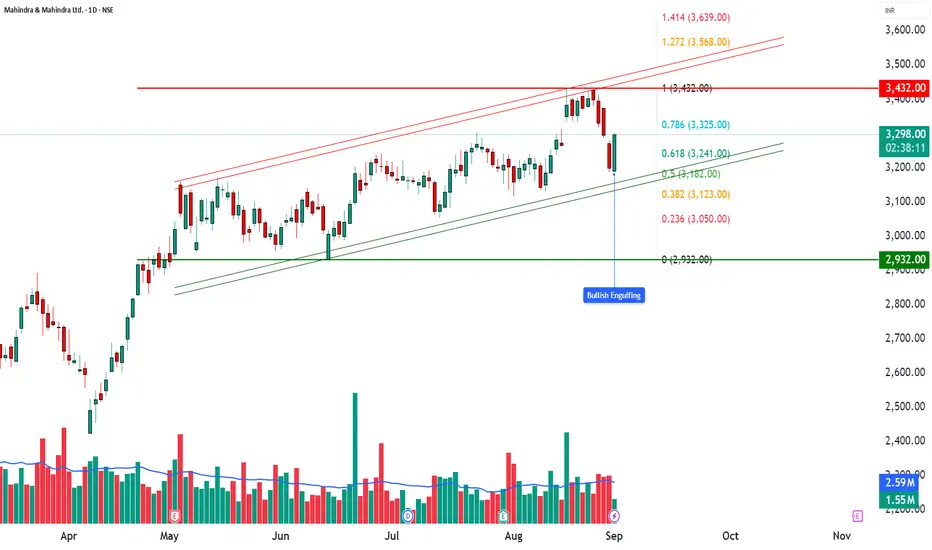
M&M | How to Trade a Bullish Engulfing in a Rising Channel🚘 M&M | How to Trade a Bullish Engulfing in a Rising Channel
📊 Stock: Mahindra & Mahindra Ltd (M&M)
⏳ Timeframe: Daily
📈 Chart Pattern: Rising Channel
🕯 Candlestick Pattern: Bullish Engulfing
________________________________________
🔹 Pattern Overview
M&M is currently trading within a Rising Channel, a structure that often reflects sustained bullish momentum. On the latest daily chart, a Bullish Engulfing candlestick has been formed, signaling renewed buying interest after a brief phase of consolidation.
________________________________________
The setup looks stronger with a Bullish Marubozu and an Open = Low candle, showing aggressive demand from the open. Price is holding well above VWAP, confirming bullish bias. A BB Squeeze Off signals volatility expansion ahead, while the recent false breakdown indicates sellers got trapped and buyers are back in control.
________________________________________
🔹 Key Levels to Watch
Resistance Zones: 3335 – 3374 – 3445
Support Zones: 3224 – 3152 – 3113
________________________________________
🔹 Technical Indicators Snapshot
RSI is at 52, sitting in the neutral zone but leaving room for upside momentum if buying picks up. The MACD shows a bearish crossover, which is an early caution signal to watch. CCI at -14 indicates neutral sentiment with no strong bias, while Stochastic at 55 is mid-range, suggesting neither overbought nor oversold conditions at the moment.
________________________________________
🔹 Candle Analysis
Candle 1 (Yesterday): High 3280 | Low 3187
Candle 2 (Today): High 3302.10 | Low 3191.10
👉 The today’s candle engulfed the previous session’s body, confirming the Bullish Engulfing pattern.
________________________________________
🔹 Trading View (Educational Insight Only)
A Bullish Engulfing inside a Rising Channel generally indicates continuation of the prevailing uptrend. If price manages to probably sustain above the 3335–3374 zone, it may signal strength for further upside. On the other hand, if the stock probably slips below the 3224–3152 support zone, it could lead to short-term profit booking.
________________________________________
📌 “All price levels mentioned are as observed at the time of writing and may change with market movements. Readers are advised to track live prices before making any trading or investment decision.”
⚠️ Disclaimer – Please Read Carefully
The information shared here is meant purely for learning and awareness. It is not a buy or sell recommendation and should not be taken as investment advice. I am not a SEBI-registered investment advisor, and all views expressed are based on personal study, chart patterns, and publicly available market data.
Trading — whether in stocks or options — carries risk. Markets can move unexpectedly, and losses can sometimes exceed the money you have invested. Past performance or past setups do not guarantee future results.
If you are a beginner, treat this as a guide to understand how the market works — practice on paper trades before risking real money. If you are experienced, always assess your own risk, position sizing, and strategy suitability before entering trades.
Consult a SEBI-registered financial advisor before making any real trading decision. By engaging with this content, you acknowledge full responsibility for your trades and investments.
💬 Found this useful?
🔼 Give this post a Boost to help more traders discover clean, structured learning.
✍️ Drop your thoughts, questions, or setups in the comments — let’s grow together!
🔁 Share with fellow traders and beginners to spread awareness.
👉 “If you liked this breakdown, follow for more clean, structured setups with discipline at the core.”
🚀 Stay Calm. Stay Clean. Trade With Patience.
Trade Smart | Learn Zones | Be Self-Reliant 📊
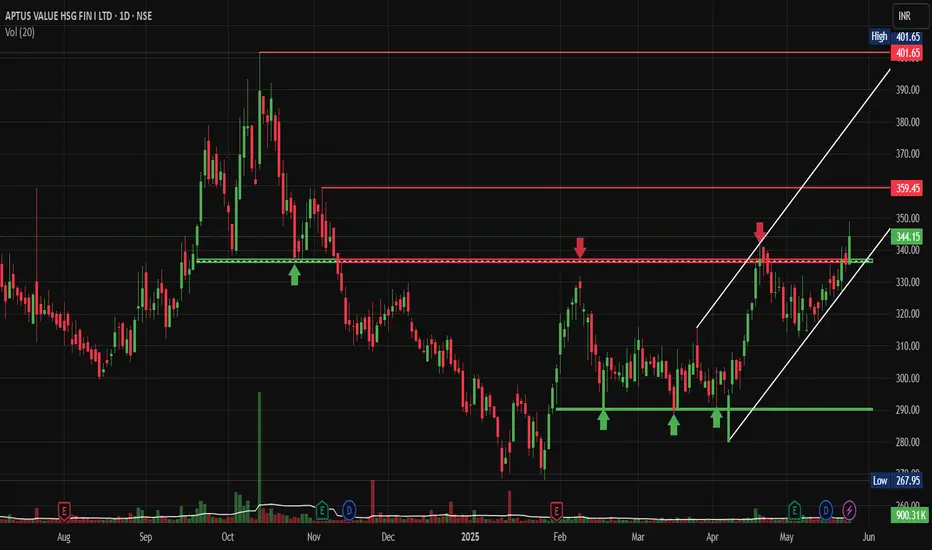
Aptus Rising Channel Pattern with Prior Triple Bottom PatternNSE:APTUS : Rising Channel Pattern with Prior Triple Bottom Pattern Signals Major Reversal - Could This Be the Next Multi-Bagger?
Pattern Recognition & Base Formation:
NSE:APTUS presents a compelling technical setup with a Triple Bottom reversal pattern formed at the ₹267-275 support zone. This pattern, completed over several months from late 2024 to early 2025, represents one of the most reliable bullish reversal formations in technical analysis.
The stock has also carved out a distinct ascending triangle pattern with the upper trendline acting as dynamic resistance around ₹340-350 levels. The recent breakout above this consolidation zone, accompanied by increased volume participation, signals a potential trend change from the prolonged correction phase.
Key Technical Levels Analysis:
Critical Support Levels:
- Immediate Support: ₹330-335 (recent breakout consolidation)
- Major Support: ₹290-295 (triple bottom neckline and 50% retracement)
- Ultimate Support: ₹267-275 (triple bottom base - absolute floor)
Resistance Levels:
- Immediate Resistance: ₹359 (marked horizontal resistance zone)
- Next Target: ₹380-385 (psychological resistance before ATH)
- Ultimate Target: ₹401.65 (all-time high retest)
- Extension Target: ₹420-430 (measured move from triple bottom pattern)
Volume Profile Assessment:
The volume pattern shows significant improvement during the recent bounce from the triple bottom lows. Today's volume at 900.31K represents a 44% increase from the 20-day average, indicating institutional interest returning to the stock.
The volume during the formation of the triple bottom showed classic accumulation characteristics - high volume on declines (smart money buying) and lower volume on any bounces, until the recent breakout attempt.
Technical Pattern Breakdown:
Primary Pattern: Triple Bottom Reversal
- Formation Period: December 2024 - February 2025
- Support Base: ₹267-275
- Neckline: ₹290-295
- Measured Target: ₹350+ (already achieved), next target ₹420-430
Secondary Pattern: Ascending Triangle
- Formation Period: February 2025 - Present
- Base: Rising support from ₹275 to ₹330
- Apex: ₹340-350 resistance zone
- Breakout Status: In progress with volume confirmation pending
Trade Setup Strategy:
Setup Classification: Reversal Play with Pattern Confirmation
Entry Approaches:
- Aggressive Entry: ₹340-345 (current levels on any minor dip)
- Conservative Entry: ₹330-335 (on pullback to breakout support)
- Value Entry: ₹290-295 (if neckline retest occurs - lower probability)
Position Management:
- Initial Position: 1-1.5% portfolio allocation
- Add-on Levels: ₹330-335 (if pullback materialises)
Profit Booking Strategy:
- Target 1: ₹365-370 (6-8% upside) - Book 25% position
- Target 2: ₹385-390 (12-15% upside) - Book 40% position
- Target 3: ₹410-420 (20-25% upside) - Book remaining 35%
Risk Management:
- Tight Stop: ₹325 (5-6% downside for aggressive traders)
- Swing Stop: ₹310 (10% downside for position traders)
- Pattern Stop: ₹285 (below neckline - invalidates bullish thesis)
Sector & Fundamental Backdrop:
Housing finance companies are experiencing renewed interest due to:
- Improving real estate cycle momentum
- Regulatory clarity on lending norms
- Credit growth revival in retail segments
- Government policy support for affordable housing
Risk-Reward Assessment:
Bullish Catalysts:
- Triple bottom completion - highly reliable reversal signal
- Volume expansion during the recent bounce
- Sector tailwinds supporting fundamentals
- Technical breakout from months of consolidation
- Strong support base established at ₹270 levels
Risk Factors:
- Overall market volatility could impact momentum
- NBFC sector sensitivity to interest rate changes
- Need to sustain above ₹340 to confirm breakout
- High beta nature amplifies market moves
Bottom Line:
NSE:APTUS offers an attractive risk-adjusted opportunity with the completion of a triple bottom reversal pattern. The stock appears to be in the early stages of a potential trend reversal after months of base building.
The most prudent approach would be to initiate positions around current levels (₹340-345) with a tight stop below ₹325, targeting the ₹365-370 zone initially. Any pullback to the ₹330-335 support area would present an even better entry opportunity.
The key technical milestone will be a decisive break and hold above ₹350, which would likely trigger the next leg of the move toward the ₹380-400 zone. Until then, trade with defined risk parameters and respect the established support levels.
Keep in the Watchlist.
NO RECO. For Buy/Sell.
📌Thank you for exploring my idea! I hope you found it valuable.
🙏FOLLOW for more
👍BOOST if you found it useful.
✍️COMMENT below with your views.
Meanwhile, check out my other stock ideas on the right side until this trade is activated. I would love your feedback.
Disclaimer: "I am not SEBI REGISTERED RESEARCH ANALYST AND INVESTMENT ADVISER."
This analysis is intended solely for informational and educational purposes and should not be interpreted as financial advice. It is advisable to consult a qualified financial advisor or conduct thorough research before making investment decisions.
Capacite Infra - Rising ChannelCapacite Infra is forming rising channel and also follow a particular timeframe.
Price is printing Higher High and Higher Low makes the trend up.
As per time analysis and interpretation of chart, we got a price target of 400.
Expected time frame to achieve target would be 3-4 months
Thank You
Arvind Yadav, Cfa
Arvind Share Academy

Breaking Resistance With Volume Blast in Risisng ChannelNSE:ASTRAZEN is Breaking Major Levels With high Voulme Blast in Rising Channel on Daily Timeframe.
Disclaimer: This analysis is intended solely for informational and educational purposes and should not be interpreted as financial advice. It is advisable to consult a qualified financial advisor or conduct thorough research before making investment decisions.

Respecting Rising Channel and 100 EMANSE:KPIL is respecting its Uptrend in Rising Channel and not breaking 100 EMA.
Just an Update no Trade as of Now.
Check out my other stock ideas below until this trade gets activated, I would love your feedback.
Disclaimer: This analysis is intended solely for informational and educational purposes and should not be interpreted as financial advice. It is advisable to consult a qualified financial advisor or conduct thorough research before making investment decisions.

Verge of Breakout with Good Volumes NSE:ELECON is on the Verge of a breakout with good volumes today on a daily time frame respecting the rising channel and 100 EMA a close above 716 is crucial.
Disclaimer: This analysis is intended solely for informational and educational purposes and should not be interpreted as financial advice. It is advisable to consult a qualified financial advisor or conduct thorough research before making investment decisions.

Rounding Bottom in Rising Channel NSE:POWERGRID is Making a Rounding Bottom near its ATH in a Rising Channel giving Respect to 100 EMA with Heavy Volumes once breaking it, it will continue its uptrend Further ahead in days to come. Keep on Watch.
Disclaimer: This analysis is intended solely for informational and educational purposes and should not be interpreted as financial advice. It is advisable to consult a qualified financial advisor or conduct thorough research before making investment decisions.

UBL in Rising ChannelNSE:UBL is in a rising channel in the daily time frame with good volume and can continue its upward move to ATH Levels.
