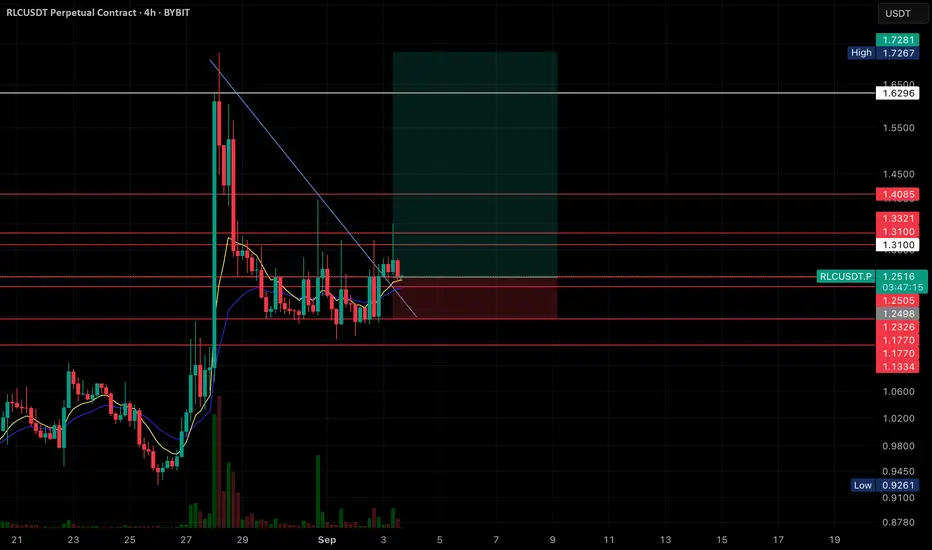
RLC going goodPrice was consolidating below a descending trendline (blue). It has now broken above it with momentum, suggesting a bullish breakout.
• Entry Zone:
Current price is around 1.3480 USDT after reclaiming the breakout area. The long entry zone starts above this breakout.
• Stop-Loss Zone (Red Area):
Placed below 1.3100 – 1.2500 USDT, with deeper support around 1.1770. This covers previous consolidation lows, protecting against false breakouts.
• Target Zone (Green Area):
The first target is around 1.4085 USDT (near resistance).
The major target is 1.6296 USDT, extending up toward 1.72 USDT (previous highs).
• Risk-to-Reward (RR):
The setup looks to be a high RR trade, aiming for more than 2–3x reward compared to the risk zone.
• Indicators:
Short EMA (yellow) has crossed above the longer MA (blue), confirming bullish momentum. Volume has also picked up on the breakout, which strengthens the setup.
👉 Overall: This is a bullish breakout trade with stop-loss protection below recent supports and upside targets toward 1.62–1.72 if momentum continues.
RLC

RLC BullishRLC/USDT – 4H Bullish Outlook
RLC has broken out of the descending trendline and is showing early signs of strength. Price is currently consolidating just above the breakout zone, holding support around 1.23 – 1.25.
📊 Key Levels:
• Support: 1.23 – 1.25, 1.17
• Resistance: 1.31, 1.33, 1.41
• Target Zone: 1.62 – 1.72
🔥 Bullish Scenario:
As long as price sustains above 1.23 – 1.25, buyers may continue pushing higher. A breakout above 1.31 resistance would confirm further bullish momentum, opening the way toward 1.62 – 1.72.
📉 Invalidation:
If price falls below 1.17, this bullish setup becomes invalid.
Nifty-50 levels for swing tradingAccording to a recent analysis, the important levels are:
Trend‑deciding pivot: 25,064
Resistance (R): 25,142 → 25,221 → 25,299 → 25,343 → 25,416
Support (S): 24,985 → 24,907 → 24,828 → 24,750 → 24,671
Weekly Pivot: ~24,844
R1: ~25,187, R2: ~25,372; S1: ~24,661, S2: ~24,317

RLC LONG IDEARLC falling wedge pattern detected in 6h timeframe. Also it is forming double bottom which is bullish sign for upcoming days. Expecting a bullishness from current price. If it gets some momentum then we will see 50% to 100% growth in upcoming weeks.
Targets could be 1.7, 1.9, 2.2, 2.6, 3.0
STOP 1.4

RLC: 📈 Watch for potential opportunities.💎 Paradisers, #RLC is exhibiting a bullish market structure and might gather liquidity before reaching the bullish Order Block (OB).
💎If #RLCUSDT displays a Change of Character (CHoCH) and Break of Structure (BOS) from the bullish OB, we can anticipate a bounce from that point.
💎Should the bullish OB break down without any CHoCH or BOS, a bounce from the demand area might be expected, but we'll need confirmation before proceeding.
💎If the price breaks down both of these levels without any confirmation, it would be prudent to overlook #RLC for the time being.

RLC/USDTcurrently rlc is making a W pattern (reversal pattern), if the structure break'sout long entry is great. Also all indicators turning to bullish. If BTC is stable or bullish, then RLC will start a great bullish rally.


RLC/BTC long idea, possible cup and handleiExec (RLC), not financial advice.
Possible cup and handle in play here on the daily
Entry: 2067
Target 1: 2317 (2200 short term)
Target 2: 2510
STOPLOSS: 2019
possible profit 12% - 22% (6.4% short term)
possible loss 2.32%
Risk/reward 5.21 - 9.23
Keep your eyes on bitcoin!!!!!!!! could throw off the numbers, trail your stop if you'd like to protect gainz. Always play for satoshis!!!!!! RESPECT STOPLOSSES
