Axis Bank Ltd Daily Chart. Chart Pattern1. The chart pattern : Rounding Bottom Pattern:
Indicates a gradual reversal from a downtrend to an uptrend.
The white‑outlined area shows the consolidation phase forming the “bowl” shape.
A breakout above the resistance (upper rim of the bowl) would confirm the reversal and trigger a bullish move.
2. EMA Analysis:
EMA 21 (purple line) is crossing above EMA 55 (green line), showing short‑term momentum shift to bullish.
EMA 55 is above EMA 100 (blue line) and EMA 200 (orange line), indicating medium‑term bullish alignment.
Price is above all EMAs, suggesting strong support from the moving averages.
3. Volume:
Volume spikes during the decline into the bottom and increases near the breakout zone, confirming interest and potential strength in the reversal.
Watch for higher than average volume on the breakout to validate the move.
4.The View :
Measure the depth of the rounding bottom (from the lowest point to the rim) and project that distance upward from the breakout level.
Stop‑Loss: Place the SL below the recent swing low of the rounding bottom to protect against a false breakout.
Roundingbottom

Dhampur Bio Organics cmp 95.76 by Daily Chart viewDhampur Bio Organics cmp 95.76 by Daily Chart view
- Support Zone 75 to 85 Price Band
- Resistance Zone 95 to 105 Price Band
- Resistance Zone holding strong since a year from January 2025
- Head & Shoulders around Support Zone and last Rounding Bottom
- Heavy Volumes surge seen last week Friday by demand based buying
- Bullish Rounding Bottoms with good consolidation around Support Zone
- Falling Resistance Trendlines Breakout with Rising Support Trendline been respected

BSE cmp 2790.60 by Daily Chart viewBSE cmp 2790.60 by Daily Chart view
- Support Zone 2570 to 2670 Price Band
- Resistance Zone 2790 to 2915 Price Band
- Bullish "W" Double Bottom by Support Zone base
- Rising Support Trendline well sustained and respected
- Falling Resistance Zone Trendline Breakout been attempted
- Volumes spiked today with good sync with the avg traded qty

BUY TODAY SELL TOMORROW for 5%DON’T HAVE TIME TO MANAGE YOUR TRADES?
- Take BTST trades at 3:25 pm every day
- Try to exit by taking 4-7% profit of each trade
- SL can also be maintained as closing below the low of the breakout candle
Now, why do I prefer BTST over swing trades? The primary reason is that I have observed that 90% of the stocks give most of the movement in just 1-2 days and the rest of the time they either consolidate or fall
Round Bottom Breakout in MINDTECK
BUY TODAY SELL TOMORROW for 5%

Canara Bank cmp 154.87 seen by the Monthly Chart view since listCanara Bank cmp 154.87 seen by the Monthly Chart view since listed
- Support Zone 129 to 142 Price Band
- Resistance Zone 155 to ATH 164.22 Price Band
- Bullish Cup and Handle Breakout done above Support Zone
- Stock Price ready for New ATH beyond current ATH 164.22 level
- Double Bullish patterns of Rounding Bottom inclusive of Cup and Handle
- Basis both Technical Chart patterns, the logical target price comes to +/- 300

Sai Life Sciences cmp 921.70 by the Daily Chart view since listeSai Life Sciences cmp 921.70 by the Daily Chart view since listed
- Support Zone 865 to 895 Price Band
- Resistance Zone 923 to ATH 943 Price Band
- Volumes are regularly spiking well above the average traded quantity
- Darvas Bos Setup seems like repeated basis the current technical chart setup
- Rising Price Channels are in good sync to each other at ending and fresh new start
- Considerate Bullish Rounding Bottoms and/or Rising VCP pattern, as one may interpret
- Darvas Box Setup : Stock trending within 845 to ATH 943 price band since ATH on 25-Aug-2025

Bank Nifty spot 60150.95 by Daily Chart view - Weekly UpdateBank Nifty spot 60150.95 by Daily Chart view - Weekly Update
_*Bank Nifty created a New Lifetime High Milestone 60203.75 on 02-Jan-2026*_
- Support Zone 59450 to 59750 for Bank Nifty
- Resistance only at ATH 60230.75 and each New ATH
- Volumes trending well above the average traded quantity
- Strong Bullish Bottom formed around 58650 to 58750 level
- Bullish Rounding Bottom formed by previous ATH and New ATH
- Hope to see further higher levels for Bank Nifty thru New Year 2026

Belrise Inds cmp 157.70 by Daily Chart view since listedBelrise Inds cmp 157.70 by Daily Chart view since listed
- Support Zone 150 to 157 Price Band
- Resistance Zone 166.50 to ATH 172.68 Price Band
- Price traversing within Rising Price Channel since listed
- Volumes need to increase for sustained upside movement
- Support Zone been tested retested since mid of November 2025
- Bullish Rounding Bottoms retracing at Resistance Zone inclusive of ATH 172.68

IRIS Clothing cmp 35.66 by Weekly Chart viewIRIS Clothing cmp 35.66 by Weekly Chart view
- Support Zone 28 to 31 Price Band
- Resistance Zone 36.50 to ATH 40.71 Price Band
- Volumes above average traded quantity over past 2 weeks
- Darvas Box - Price trending between 30 to 35.50 since June 2025
- Long Bullish Rounding Bottom followed by small one's made within Darvas Box

Zuari Agro Chemicals cmp 294.80 by Monthly Chart viewZuari Agro Chemicals cmp 294.80 by Monthly Chart view
- Support Zone 239 to 274 Price Band
- Resistance Zone 325 to 362 Price Band
- Rounding Bottom by Resistance Zone neckline
- Breakout well sustained above dotted Falling Resistance Trendlines
- 3rd Falling Resistance Trendline from ATH level Breakout maybe made
- Rising Support Trendlines are well respected by upside price momentum
- Volumes with heavy spikes in between by close sync with avg traded quantity

MAS Financial cmp 313 by Daily Chart viewMAS Financial cmp 313 by Daily Chart view
- Support Zone 275 - 295 Price Band
- Resistance Zone 325 to 345 Price Band
- Falling Resistance Trendline Breakout seems been sustained
- Repeat Bullish Rounding Bottoms done with last in making process
- Volumes are seen to be in decent sync with the average traded quantity
- Good accumulation since August 2025 within Support and Resistance Zone

RR Kabel cmp 1420 by Weekly Chart view since listedRR Kabel cmp 1420 by Weekly Chart view since listed
- Support Zone 1285 to 1350 Price Band
- Resistance Zone 1525 to 1600 Price Band
- Resistance Zone Breakout in the making process

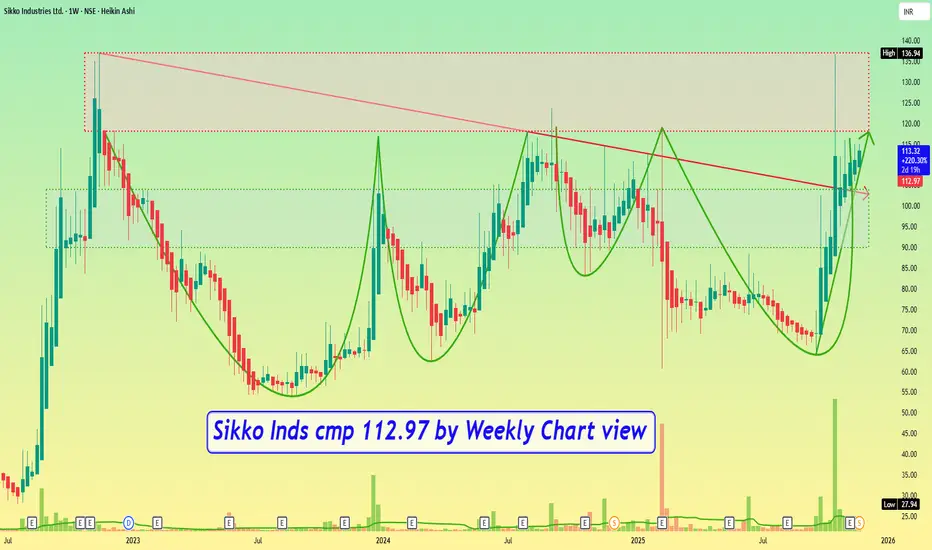
Sikko Inds cmp 112.97 by Weekly Chart viewSikko Inds cmp 112.97 by Weekly Chart view
- Support Zone 90 to 104 Price Band
- Resistance Zone 118 to ATH 136.94 Price Band
- Volumes in good sync with average traded quantity
- Bullish Rounding Bottoms by Resistance Zone neckline
- Resistance Zone holding strongly at each breakout attempts
Infibeam Avenues cmp 19.67 by Daily Chart viewInfibeam Avenues cmp 19.67 by Daily Chart view
- Support Zone 16.00 to 18 Price Band
- Resistance Zone 21.50 to 23.50 Price Band
- Falling Resistance Price Channel Breakout sustained
- Rising Support Price Channel going in a uptrend mode
- Bullish Rounding Bottoms by Resistance Zone neckline
- Volumes spiking at regular intervals over past few weeks

BUY TODAY SELL TOMORROW for 5%DON’T HAVE TIME TO MANAGE YOUR TRADES?
- Take BTST trades at 3:25 pm every day
- Try to exit by taking 4-7% profit of each trade
- SL can also be maintained as closing below the low of the breakout candle
Now, why do I prefer BTST over swing trades? The primary reason is that I have observed that 90% of the stocks give most of the movement in just 1-2 days and the rest of the time they either consolidate or fall
Round Bottom Breakout in APEX
BUY TODAY SELL TOMORROW for 5%

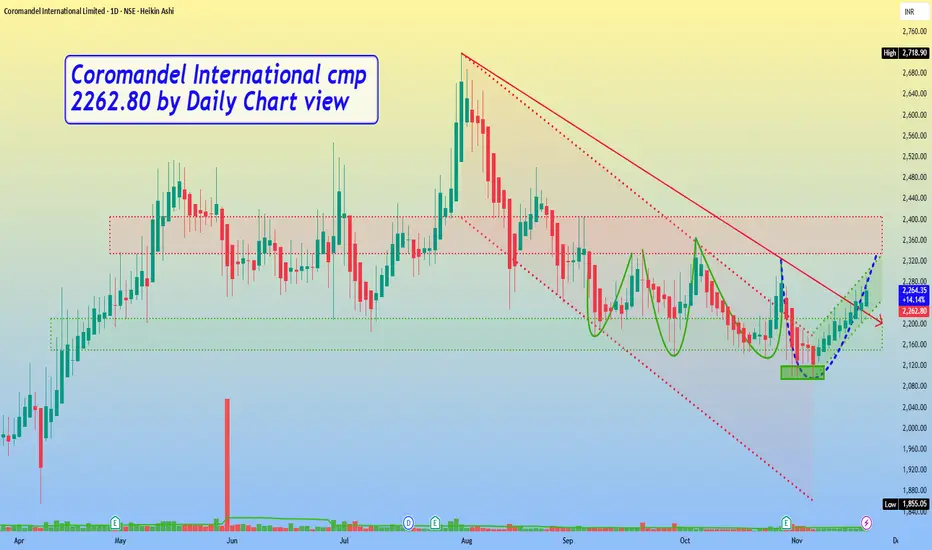
Coromandel International cmp 2262.80 by Daily Chart viewCoromandel International cmp 2262.80 by Daily Chart view
- Support Zone 2150 to 2210 Price Band
- Resistance Zone 2335 to 2405 Price Band
- Falling Resistance Trendline Breakout has well sustained
- Bullish Triple Bottom made around 2095 to 2120 Price Band
- Repeated Bullish Rounding Bottoms by Resistance Zone neckline
- Volumes seem steady and need to increase for Resistance Zone Breakout
IDBI Bank cmp 104.62 by Monthly Chart viewIDBI Bank cmp 104.62 by Monthly Chart view
- Support Zone at 64 to 84 Price Band
- Resistance Zone at 108 to 128 Price Band
- Breakout attempted from Falling Resistance Trendline
- Bullish Head and Shoulders by the Resistance Zone neckline
- Monthly Volumes spiking regularly over a year since Sept 2024
- Positively trending Technical Indicators BB, EMA, MACD, RSI, SAR, SuperTrend

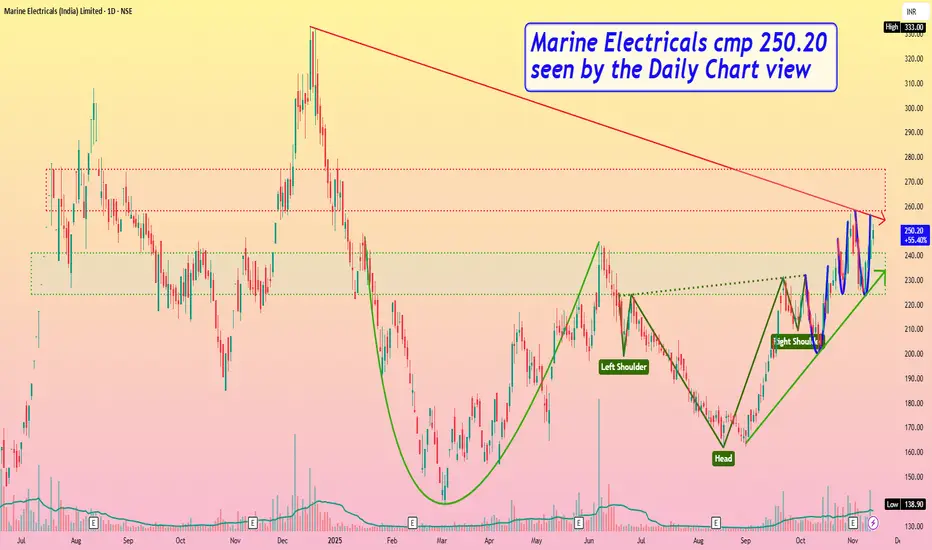
Marine Electricals cmp 250.20 by Daily Chart viewMarine Electricals cmp 250.20 by Daily Chart view
- Support Zone 224 to 241 Price Band
- Resistance Zone 258 to 275 Price Band
- Bullish Chart setup by Rounding Bottoms, pre and post Head & Shoulders
- Volumes seen spiking very heavily and well above the average traded quantity
- Positively trending Technical Indicators BB, EMA, MACD, RSI, SAR, SuperTrend, VWAP
- Breakout attempted above Falling Resistance Trendline and Rising Support Trendline sustained
- Fresh Breakout probable subject to Resistance Zone crossing and closure sustained above it for few days
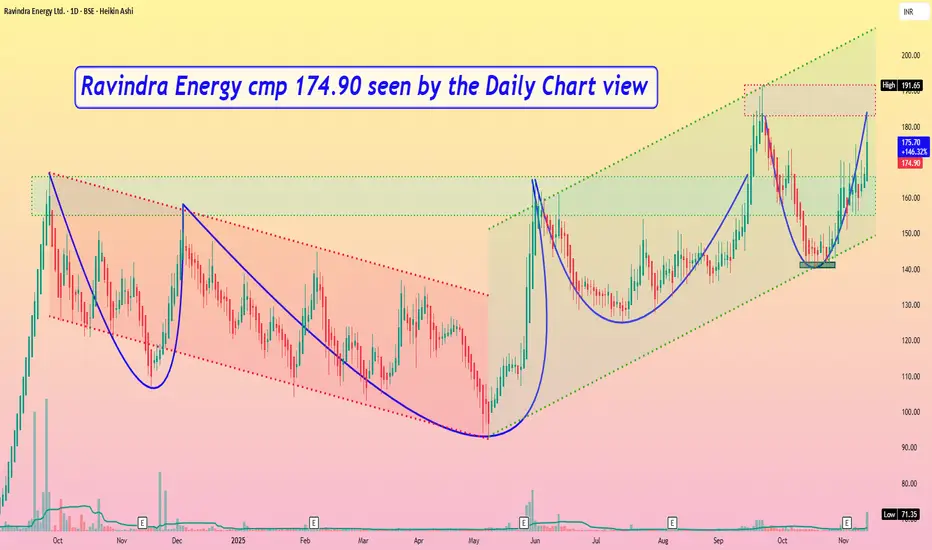
Ravindra Energy cmp 174.90 by Daily Chart viewRavindra Energy cmp 174.90 by Daily Chart view
- Support Zone 155 to 166 Price Band
- Resistance Zone 183 to ATH 191.60 Price Band
- Bullish Triple Bottom formed at 140 to 142 price band
- Repeated Bullish Rounding Bottoms with considerate VCP too
- Volumes spiking in good numbers intermittently over past few weeks
Thyrocare-A beautiful breakout is done!Thyrocare has given a good closing today above its previous ATH.
Stock has formed a beautiful rounding bottom pattern. Volumes buildup before breakout is decent as well.
Previously, i had covered Policybazar & Zomato with such patterns and they have given amazing returns.
Keep this stock in watchlist. This can give similar move as well.
Entering at ATH levels is tricky but these stocks come with excellent reward opportunity.
I am NISM certified RA and not SEBI registered.
This is not a recommendation but is shared for you to learn.

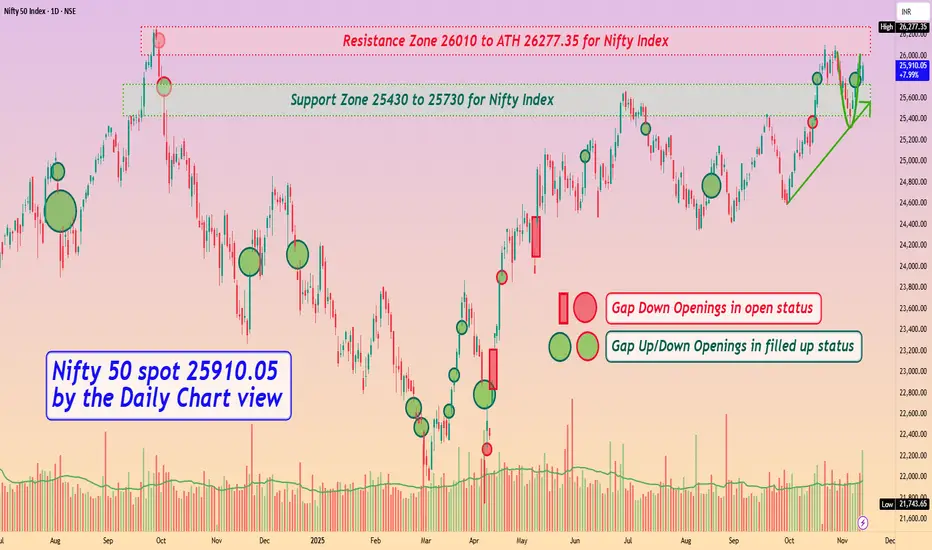
Nifty 50 spot 25910.05 by Daily Chart view - Weekly UpdateNifty 50 spot 25910.05 by Daily Chart view - Weekly Update
- Support Zone 25430 to 25730 for Nifty Index
- Resistance Zone 26010 to ATH 26277.35 for Nifty Index
- Rising Support Trendline seems respected by weekly positive closure
- Rounding Bottom Bullish momentum by Resistance Zone neckline seems sustained
- Nifty timidly shy from creating a New Lifetime High by crossing ATH final hurdle remains effectively elusive
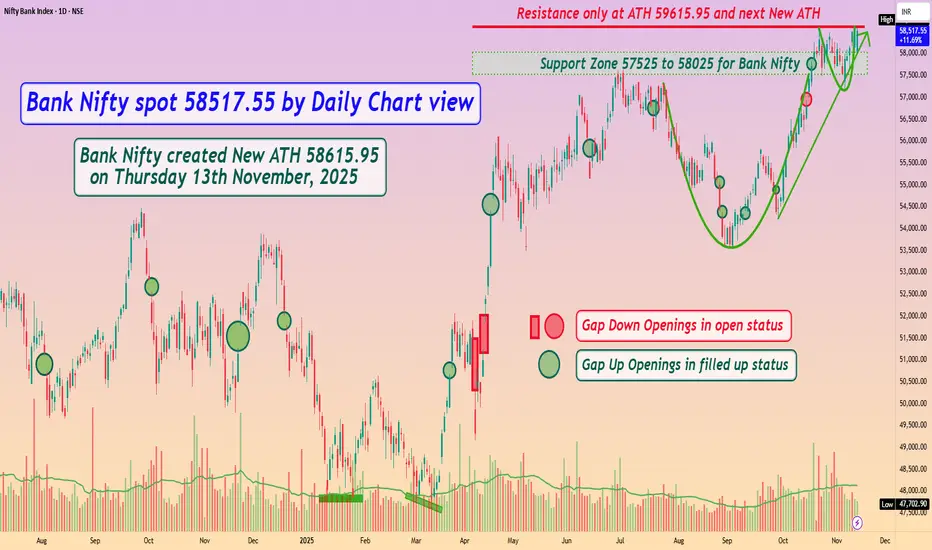
Bank Nifty spot 58517.55 by Daily Chart view - Weekly UpdateBank Nifty spot 58517.55 by Daily Chart view - Weekly Update
- Support Zone 57525 to 58025 for Bank Nifty
- Resistance only at ATH 59615.95 and next New ATH
- Bank Nifty created New ATH 58615.95 on Thursday 13th November, 2025
- Bullish momentum of Rounding Bottoms by Support Zone and Resistance Zone necklines well sustained
#GRMOVER: Rounding Bottom Breakout in Play!🚨 Monthly chart shows a classic rounding bottom breakout brewing!
Clear break above 498 MCB with strong momentum is needed to confirm the bullish continuation.
CMP: 481.40
🚧 Immediate Resistance: 498
🛡 Key Supports: 434 / 366 - 338 / 289 - 264
🎯 Targets: 935. Beyond that, sky’s the limit!
⚠️ Stay above the negation level to keep the bullish run intact.
#GRMOVER #RoundingBottom #ChartPatterns #PriceAction #LongTerm #Investing
📌 #Disclaimer: This analysis is shared for educational purposes only. It is not a buy/sell recommendation. Please do your own research before making any trading decisions.
