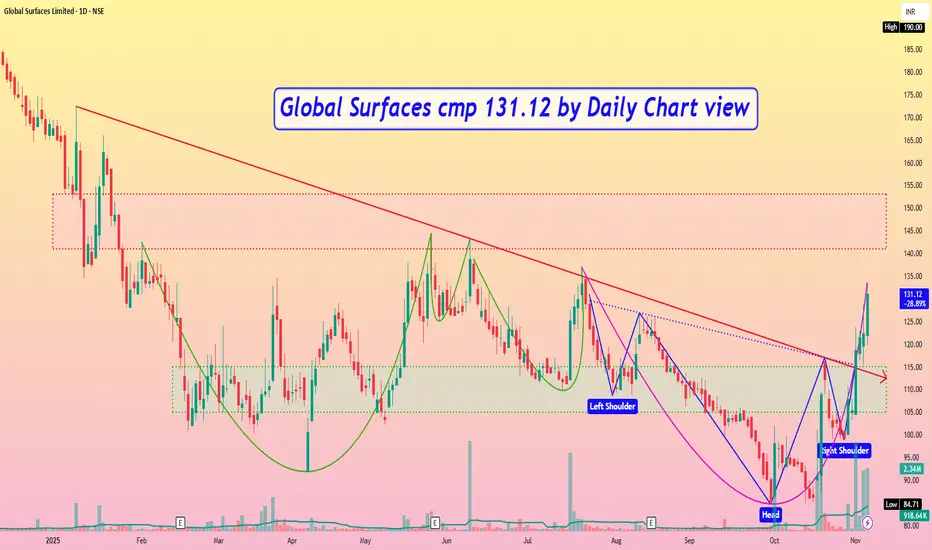
Global Surfaces cmp 131.12 by Daily Chart viewGlobal Surfaces cmp 131.12 by Daily Chart view
- Support Zone 105 to 115 Price Band
- Resistance Zone 141 to 153 Price Band
- Multiple Bullish Technical Chart patterns done
- Falling Resistance Trendline Breakout well sustained
- Majority of Technical Indicators seen trending positively
Roundingbottom
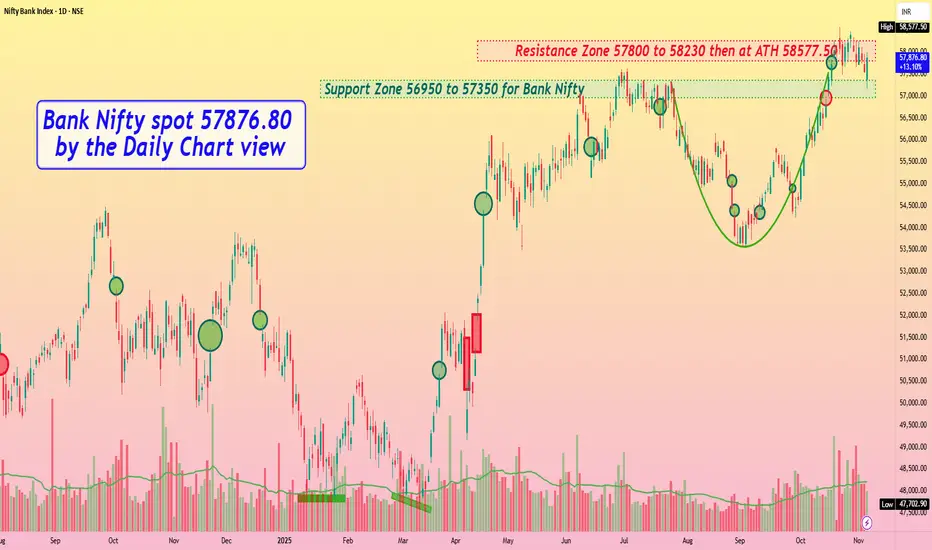
Bank Nifty spot 57876.80 by Daily Chart view - Weekly updateBank Nifty spot 57876.80 by Daily Chart view - Weekly update
- Support Zone 56950 to 57350 for Bank Nifty
- Resistance Zone 57800 to 58230 then at ATH 58577.50
- Bank Nifty sustaining between Support and Resistance Zones over 2 weeks
- Bullish Rounding Bottom still in active mode against the weak sentiments in general
Shriram Finance cmp 796.50 by Daily Chart viewShriram Finance cmp 796.50 by Daily Chart view
- Support Zone 728 to 760 Price Band
- Resistance only at ATH 814.15 done on Tuesday 04-Nov-2025
- The current Technical Chart setup is indicative of a very good upside with tentative target price level +/- 1025

Onmobile Global cmp 73.96 by Weekly Chart viewOnmobile Global cmp 73.96 by Weekly Chart view
- Support Zone 62 to 68 Price Band
- Resistance Zone 78 to 85 Price Band
- Bullish Rounding Bottom under Resistance Zone
- 1st Falling Resistance Trendline seems well sustained
- Next hurdles are Dotted Falling Resistance Trendline and Resistance Zone
- Volumes needed to provide fresh upside to give breakout above the Resistance
- Stock price trending well with positive technical indicators EMA, MACD, RSI, SAR, SuperTrend

DIACABS - Mutliple confirmation set upDiamond Power Infrastructure Limited (DIACABS) is trading near ₹154 in early November 2025. The stock shows mixed signals with a short-term sell signal but a longer-term buy signal, indicating some near-term caution within a general positive trend. Resistance is expected around ₹169.6, and support near ₹127.9. Technical indicators point to bullish momentum as the price is above 25-day and 50-day moving averages, although short-term volatility has caused some pullbacks.
Financially, DIACABS has a market cap of about ₹7,628 crore and recently showed impressive quarterly revenue growth of over 200%, though profit margins remain modest near 5.7%. The debt level is significant (₹2,355 crore) compared to its cash reserves, which raises risk concerns for risk-averse investors. The stock has delivered extraordinary long-term returns (+879% over five years), but recent performance has been volatile with notable quarterly earnings growth fluctuations.
Overall, DIACABS is a high-potential but higher-risk mid-cap stock showing bullish technical signals for short to medium-term trading, with resistance near ₹170 and downside risk if it falls below ₹128.

#TGVSL | Rounding Bottom on Monthly📊 CMP: 120
⚙️ Setup: Second Rounding Bottom forming - eyeing breakout above 182 (ATH)
🛡 Supports: 115 / 92–88
🚧 Resistances: 126 / 142 / 166 / 182
❌ Invalidation: Below 70 (MCB)
If 182 breaks with volume - next leg could mirror the 2021 move! 🚀
🎯 Pattern Target: 182 / 285+ (+59% from ATH breakout / +140% from CMP)
#TGVSL #PriceAction #RoundingBottom #LongTerm
📌 Disclaimer: This analysis is shared for educational purposes only. It is not a buy/sell recommendation. Please do your own research before making any trading decisions.

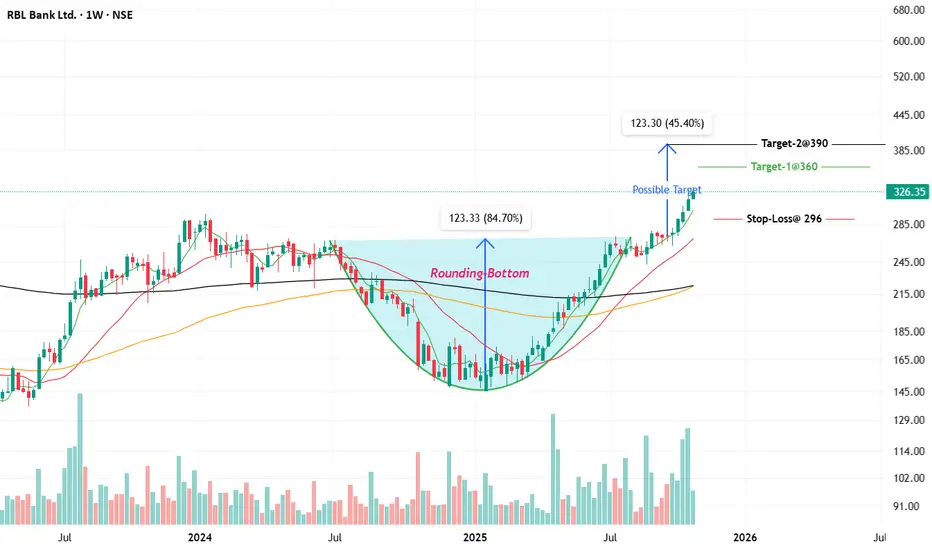
RBL Bank on the Verge: Weekly Chart Signals a Fresh Trend BreakRBL Bank has shown strong bullish momentum in its weekly chart, supported by rising price, strong moving averages, and a robust uptrend. The stock is currently trading near its 52-week high at around ₹326, indicating significant strength in the ongoing trend.
Technical Indicator Analysis
• Price and Trend: The stock has risen over 42% in the past year and over 7% in the last month, supported by strong volume and positive sentiment.
• Moving Averages: The 50-week and 200-week moving averages are sloping upwards, and the price is trading well above both, which is a bullish sign.
• Relative Strength: RSI (implied by the breakout and new highs) likely remains in bullish territory, confirming momentum.
• Support and Resistance: The stock has immediate support near ₹300 and strong resistance is seen at the recent high of ₹331.50.
Chart Pattern and Target
• Pattern Observed: A continuation breakout, possibly following a flag or rounding bottom pattern, is implied. The price action has broken past key resistances, and the trend remains strong.
• Entry Point: New entries can be considered on minor pullbacks toward ₹310-315, or on a weekly close above ₹331.50 for momentum traders.
• Target: Immediate target is the all-time range toward ₹350 . If momentum continues, longer-term targets could be in the ₹380–400 zone, using previous swing projections and extension from current levels.
• Stop Loss: Suggested stop-loss for positional trades is below ₹296 on a closing basis to protect gains and manage downside risk.
Overall, the weekly technical for RBL Bank support a bullish stance with buy-on-dip and breakout strategies, as long as the price remains above the key moving averages and stop-loss.
📌 Thanks a ton for checking out my idea! Hope it sparked some value for you.
🙏 Follow for more insights
👍 Boost if you found it helpful
✍️ Drop a comment with your thoughts below!
CANARA BANK ROUNDDING PATERN BREAKOUTCANARA BANK ( W )
ADD ON YOUR WATCHLIST
If you see in the chart, the rounding pattern has broken out and it is in the weekly time frame
You can buy at Rs 125 and go up to the target of 146 and 163. The stop loss can be kept at 117.50
Note: Our posts are posted for learning purposes. You are responsible for any profit or loss you make from the advice given in the channel. Before investing in the stock market, you must consult your financial advisor.
WE ARE NOT A SEBI REGISTERED

Adanient - Strong Bullish Momentum!!!Adanient showing Strong Bullish momentum
- Rounding bottom
-Inverted head and shoulders pattern
-Expanding channel pattern(shown as white dashed line)
-making higher highs and lower lows consistently
Target and Sl mentioned @ chart
not a tip nor advice...just sharing my view!!!!!
Thank you !!!

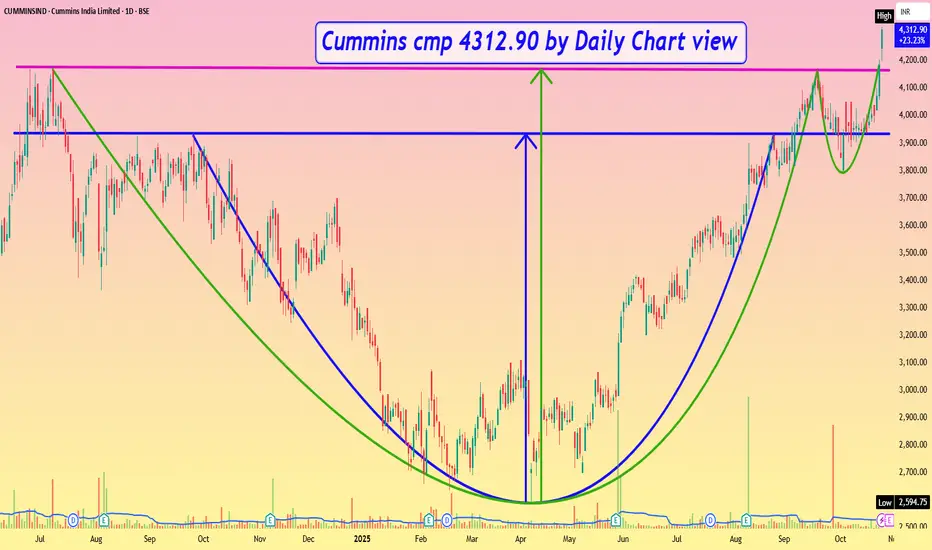
Cummins cmp 4312.90 by Daily Chart viewCummins cmp 4312.90 by Daily Chart view
- Support Zone 3900 to 4100 Price Band
- Only Resistance at ATH 4323.85 done today
- Very Strong Bullish Chart setup and Technical patterns made
- 1st Logical Target price level +/- 5250 by inner Rounding Bottom
- 2nd Logical Target price level +/- 5735 by broader Cup & Handle pattern
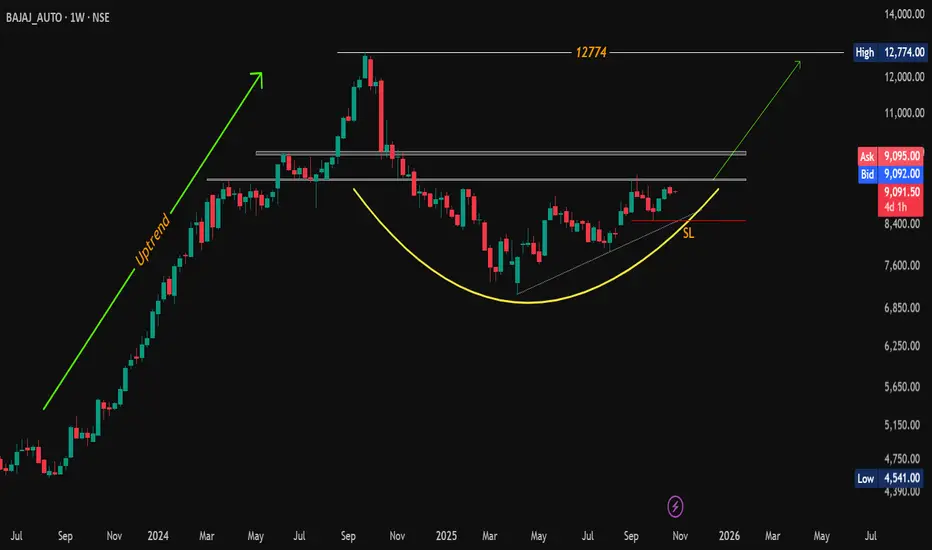
#BajajAuto | Rounding Bottom spotted on the Weekly timeframe!CMP: 9,091
🔽 Support: 8787–8741 / 8680
🔼 Resistance: 9156 / 9386 / 9490 / 9962–10039
💥 Weekly close above 9386 = momentum breakout zone!
❌ Pattern invalidation: below 8491.50 (WCB)
Bias remains bullish while above support.
#BajajAuto | #RoundingBottom | #ChartPatterns | #PriceAction | #SwingTrade
📌 Disclaimer: This analysis is shared for educational purposes only. It is not a buy/sell recommendation. Please do your own research before making any trading decisions.
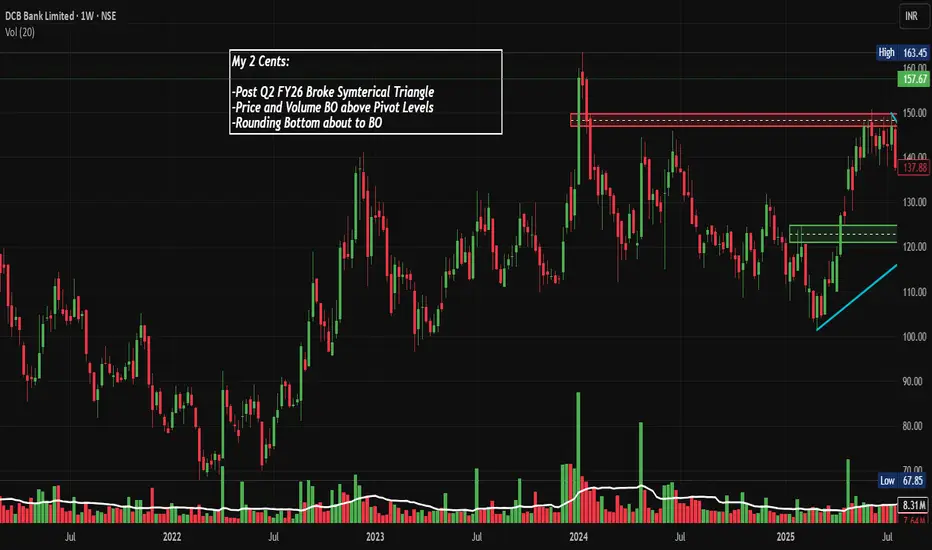
DCBBANK: Strong Q2 FY26 Numbers, Triangle BO, Chart of the MonthNSE:DCBBANK This Banking Stock Just Broke Out After a Year of Consolidation - Is a 30% Rally Coming? Posted Strong Q2 FY26 Numbers, Let's Analyse in the Chart of the Month.
As per the Latest SEBI Mandate, this isn't a Trading/Investment RECOMMENDATION nor for Educational Purposes; it is just for Informational purposes only. The chart data used is 3 Months old, as Showing Live Chart Data is not allowed according to the New SEBI Mandate.
Disclaimer: "I am not a SEBI REGISTERED RESEARCH ANALYST AND INVESTMENT ADVISER."
This analysis is intended solely for informational purposes and should not be interpreted as financial advice. It is advisable to consult a qualified financial advisor or conduct thorough research before making investment decisions.
Price Action Analysis:
Overall Trend Structure:
- The stock demonstrates a year consolidation pattern from 2024 to mid-2025, creating a strong base for accumulation
- Post-Q2 FY26 results, DCB Bank has broken out decisively from a symmetrical triangle pattern that formed during the consolidation phase
- The current price of ₹157.67 represents a significant move above the resistance zone of ₹150, which acted as a ceiling multiple times since early 2024
- A notable ascending trendline (marked in cyan) has been providing dynamic support from early 2024, suggesting sustained buying interest
Recent Price Movement:
- The stock witnessed a dramatic 23% surge in just two trading sessions (October 21-22, 2025) following the Q2 FY26 earnings release
- Current price of ₹157.67 is approaching the 52-week high of ₹163.70, demonstrating strong upward momentum
- The breakout candle shows strong conviction with increased volume participation, validating the move
- Price has successfully reclaimed and is sustaining above the critical ₹150 psychological and technical resistance level
- The stock is still 38% below its all-time high of ₹244.65, providing substantial room for upside potential
Historical Context:
- From 2021 lows around ₹70, the stock rallied to ₹150 levels by mid-2022
- A prolonged correction and consolidation phase lasted from mid-2022 through early 2024
- Multiple attempts to break the ₹150 resistance were rejected during 2024, creating a strong supply zone
- The recent breakout in October 2025 marks the first successful breach of this multi-year resistance with volume confirmation
Volume Action Analysis:
Volume Characteristics:
- Current daily volume stands at 98.79 million shares against an average of 11.07 million shares, representing an 8x surge
- Volume spike coincides perfectly with the breakout above ₹150 resistance, confirming institutional participation
- Consistent volume bars during the consolidation phase suggest steady accumulation by long-term investors
- Volume at key support levels during corrections has been relatively lower, indicating a lack of panic selling
- The volume profile shows the heaviest concentration between the ₹120-130 range, which now acts as a strong demand zone
Volume-Price Relationship:
- Breakout above resistance, accompanied by massive volume expansion, validates the bullish move
- Volume on up days significantly exceeds volume on down days during the recent rally, showing strong buying pressure
- Green volume bars dominating red volume bars in the recent price action indicate bullish accumulation
- Volume during the triangle formation was progressively declining, which is characteristic of a valid continuation pattern
- Post-breakout volume sustaining above average levels suggests continuation rather than exhaustion
Support and Resistance Levels:
Key Resistance Zones:
- Immediate Resistance (R1): ₹163.70 (52-week high and recent high)
- Medium-term Resistance (R2): ₹175-180 (Fibonacci extension level and psychological resistance)
- Major Resistance (R3): ₹200 (round number psychological barrier)
- Long-term Resistance (R4): ₹244.65 (all-time high)
Key Support Zones:
- Immediate Support (S1): ₹150 (previous resistance turned support, breakout level)
- Strong Support (S2): ₹138-140 (50% retracement of recent rally and pivot level marked on chart)
- Major Support (S3): ₹125 (ascending trendline support and breakout point from triangle)
- Critical Support (S4): ₹110-115 (bottom of recent consolidation range)
Support Strength Assessment:
- The ₹150 level has now transformed from a stubborn resistance to a new support base
- The ascending trendline from 2024 lows provides dynamic support that has been tested multiple times successfully
- The ₹125-130 zone represents a confluence of horizontal support, trendline support, and a high-volume node
- Gap support around ₹147 from the recent breakout provides a short-term cushion against minor corrections
Base Formation and Accumulation:
Base Characteristics:
- A well-defined multi-year base formation spanning approximately 2.5 years (mid-2022 to October 2025)
- The base exhibits characteristics of a symmetrical triangle consolidation pattern
- Lower highs and higher lows converging towards the apex created compression, leading to the explosive breakout
- This extended consolidation period allowed for the distribution of weak hands and accumulation by strong hands
- The base depth of approximately 35-40% from top to bottom indicates significant energy buildup
Accumulation Evidence:
- Declining volume during consolidation, followed by expansion on breakout, is a textbook accumulation pattern
- Multiple false breakouts were absorbed without panic selling, indicating patient accumulation
- Price holding above ascending trendline throughout 2024-2025 shows consistent buying support
- The rounding bottom formation visible from mid-2024 through September 2025 is a bullish accumulation pattern
- Improved fundamentals during the consolidation period attracted smart money accumulation
Technical Patterns:
Symmetrical Triangle Pattern:
- A clear symmetrical triangle pattern formed from June 2024 through October 2025
- The pattern shows converging trendlines with at least 4-5 touch points on each side
- Breakout occurred near the apex with strong volume, which is the ideal scenario for this pattern
- The pattern duration of approximately 16 months makes it a highly reliable formation
Ascending Triangle Elements:
- An ascending triangle component is visible in the chart with a flat top resistance at ₹150
- Rising lows forming the ascending trendline show progressive buying interest
- This bullish continuation pattern typically resolves to the upside, which has now been confirmed
- The pattern suggests strong demand overwhelming supply at higher levels
Breakout Pattern Validation:
- The breakout above ₹150 was accompanied by a large bullish engulfing candle
- Gap-up opening on breakout day shows urgency and conviction among buyers
- No immediate throwback to retest breakout level indicates strength
- The breakout occurred with 8x normal volume, validating the move
- Price sustaining above the breakout level for multiple sessions confirms pattern validity
Sectoral Backdrop - Private Banking Industry:
Sector Overview and Trends:
- The Indian banking sector has shown resilience with credit growth in the range of 15-17% year-on-year
- Private sector banks are gaining market share from PSU banks due to superior asset quality and technology adoption
- Small and mid-sized private banks like DCB Bank are carving niches in specific lending segments
- Net Interest Margins (NIMs) are stabilising after compression in 2023-2024, providing earnings visibility
- Asset quality metrics across the banking sector have improved, with Gross NPA levels at multi-year lows
Sector Valuations and Outlook:
- Banking sector trading at reasonable valuations with an average P/B ratio of 2-3x for private banks
- Small-cap private banks trading at a significant discount to large private banks, offering a value opportunity
- Sector outlook remains positive, driven by India's GDP growth trajectory of 6-7%
- Expected rate stability from the RBI in 2025 will help banks maintain margins
- Increasing digital adoption and financial inclusion are driving deposit and loan growth
Competitive Landscape:
- DCB Bank competes with peers like RBL Bank, South Indian Bank, Karur Vysya Bank, and CSB Bank
- Focus areas include retail lending, MSME lending, and specialised products like gold loans
- Technology adoption and digital banking are becoming key differentiators in the competitive landscape
- Consolidation trend in small banks may create M&A opportunities for well-positioned players
- Customer acquisition cost is declining with digital channels gaining prominence
Fundamental Backdrop:
Recent Financial Performance:
- Q2 FY26 results showed a robust 16.2% YoY growth in net profit to ₹184 crore
- Net Interest Income (NII) grew 17% YoY to ₹596 crore, indicating healthy core business growth
- Advances increased by 19% YoY, demonstrating strong loan book expansion
- Total operating income rose 16.22% to ₹1,822.75 crore in Q2 FY26
- Return on Assets (ROA) at 0.85% and Return on Equity (ROE) at 11.4% showing steady improvement
Asset Quality Metrics
- Gross NPA ratio improved to 2.91% as of September 30, 2025, down from 3.29% YoY
- Net NPA ratio at healthy 1.21%, indicating strong recovery and collection mechanisms
- Slippages are moderating sequentially, suggesting improved underwriting standards
- Provision coverage ratio remains adequate, providing a buffer against potential stress
- Management expects credit cost to remain below 45 basis points for the full year, indicating confidence in asset quality
Capital and Liquidity Position:
- Capital Adequacy Ratio (CAR) at strong 16.41% (Tier I: 13.97%, Tier II: 2.44%) as per Basel III norms
- Well-capitalised to support planned 20%+ loan growth without dilution
- CASA ratio at 23.52% as of September 2025, though lower than the desired 25%+
- Cost of deposits declining, helping NIM expansion despite a competitive deposit environment
- Liquidity coverage ratio and statutory ratios comfortably above regulatory requirements
Strategic Initiatives and Growth Drivers:
- Increased focus on gold loans and co-lending partnerships, driving fee income
- Emphasis on employee productivity and technology adoption, reducing Cost to Average Assets
- Digital transformation is improving customer experience and operational efficiency
- Targeting ROA of 1% and ROE of 14-15% by FY27 as per management guidance
- Niche focus areas like school finance, retail microfinance, and supply chain finance, providing growth levers
Valuation Metrics:
- Trading at P/E ratio of 7.30-7.58x, significantly below sector average of 15-20x
- Price to Book Value of 0.85x, below 1x, suggesting undervaluation
- PEG ratio of 0.51 indicates the stock is undervalued relative to the growth rate
- Dividend yield of 0.81-0.87% with a consistent dividend payout history
- Market capitalisation of approximately ₹5,065 crore classifies it as a small-cap bank
- Attractive valuation multiple offers significant re-rating potential as performance improves
Management and Governance:
- Leadership under MD & CEO Praveen Kutty is showing strong execution capabilities
- Management has consistently delivered on stated guidance parameters
- Board composition includes experienced banking professionals and independent directors
- No major governance concerns or regulatory issues flagged
- Transparent communication with stakeholders through regular investor calls and updates
Key Risks to Monitor:
- Small-cap bank status means higher vulnerability to market sentiment and liquidity shocks
- CASA ratio below peers indicates higher cost of funds and margin pressure risk
- Geographic concentration in certain states may lead to regional economic exposure
- Competition from larger banks and fintech players in key product segments
- Regulatory changes impacting small banks could affect operations
- Slower-than-expected economic growth could impact loan demand and asset quality
Technical Sentiment:
- Technical indicators, including MACD and Bollinger Bands, show bullish signals across timeframes
- Golden cross formation (50-day MA crossing above 200-day MA) has bullish implications
- Momentum indicators suggest the stock remains in a bullish zone with room to run
- Pattern completion targets align with brokerage fundamental price targets around ₹175-200
- Short-term overbought conditions may lead to consolidation, but don't negate the bullish thesis
Trade Monitoring and Review Framework:
Daily Monitoring Checklist:
- Check price action relative to key support and resistance levels identified
- Monitor volume patterns - declining volume on pullbacks is healthy, rising volume on breakdowns is concerning
- Track broader market indices (Nifty, Bank Nifty) for sector correlation
- Review any news flow specific to DCB Bank or the banking sector
- Ensure stop loss orders are active and properly placed in the system
Weekly Review Points:
- Assess whether the stock is respecting the ascending trendline support
- Compare DCB Bank's performance relative to the Bank Nifty index and peer banks
- Review any changes in FII/DII holdings or institutional activity
- Check for any upgrades/downgrades from research analysts
- Evaluate whether to book partial profits or adjust stop losses based on price movement
Quarterly Assessment:
- Deep dive into quarterly results when announced against expectations
- Review management commentary and guidance for any changes in outlook
- Assess asset quality trends, NIM trajectory, and expense management
- Compare performance metrics with peer group banks
- Re-evaluate position size and allocation based on updated fundamentals
Red Flags to Watch:
- Any close below the ascending trendline support on high volume
- Significant deterioration in asset quality (GNPAs rising above 3.5%)
- Margin compression beyond 10 basis points in a quarter
- Negative management commentary or guidance revision downwards
- Broader banking sector entering correction phase with systematic risks emerging
My 2 Cents:
- DCB Bank presents a compelling risk-reward opportunity at current levels following a clean technical breakout
- Multi-year base formation and pattern completion project has significant upside potential
- Strong fundamentals with improving profitability, asset quality, and capital ratios support the technical picture
- Attractive valuations at 0.85x P/B and 7.5x P/E provide substantial margin of safety
- Positive sectoral tailwinds and company-specific growth initiatives enhance medium-term outlook
Full Coverage on my Newsletter this Week
Keep in the Watchlist and DOYR.
NO RECO. For Buy/Sell.
📌Thank you for exploring my idea! I hope you found it valuable.
🙏FOLLOW for more
👍BOOST if you found it useful.
✍️COMMENT below with your views.
Meanwhile, check out my other stock ideas on the right side until this trade is activated. I would love your feedback.
As per the Latest SEBI Mandate, this isn't a Trading/Investment RECOMMENDATION nor for Educational Purposes; it is just for Informational purposes only. The chart data used is 3 Months old, as Showing Live Chart Data is not allowed according to the New SEBI Mandate.
Disclaimer: "I am not a SEBI REGISTERED RESEARCH ANALYST AND INVESTMENT ADVISER."
This analysis is intended solely for informational purposes and should not be interpreted as financial advice. It is advisable to consult a qualified financial advisor or conduct thorough research before making investment decisions.
Edelweiss Financial Services cmp 120.61 by Daily Chart viewEdelweiss Financial Services cmp 120.61 by Daily Chart view
- Support Zone 107.50 to 113.50 Price Band
- Resistance Zone 123.50 to 129.50 Price Band
- Falling Resistance Trendlines Breakout been attempted
- Price rejection couple of times on approaching Resistance Zone
- Volumes spiking regularly and in close sync with avg traded quantity
- Bullish patterns of Head & Shoulders followed by Cup & Handle and Rounding Bottom

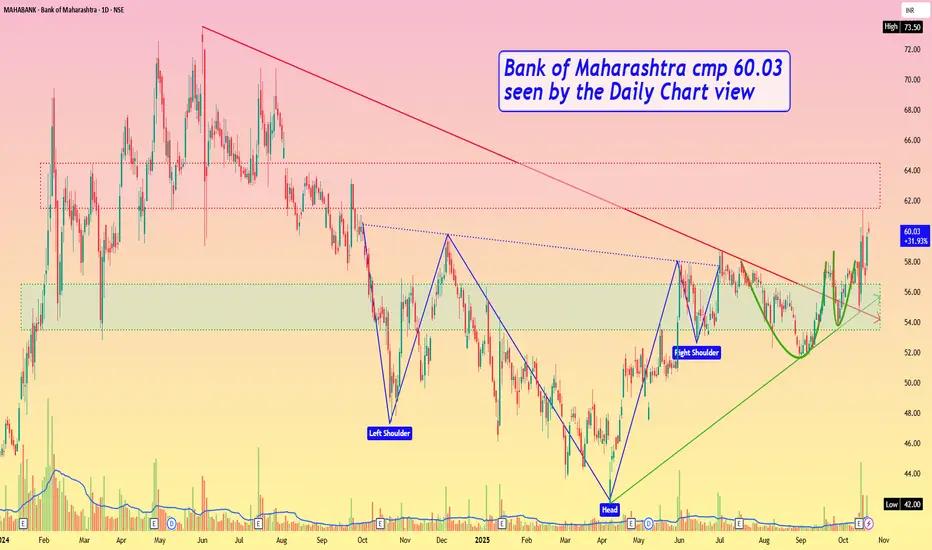
Bank of Maharashtra cmp 60.03 by Daily Chart viewBank of Maharashtra cmp 60.03 by Daily Chart view
- Support Zone 53.50 to 56.50 Price Band
- Resistance Zone 61.50 to 64.50 Price Band
- Bullish Head & Shoulders plus Rounding Bottoms around Support Zone
- Breakout from Falling Resistance Trendline and Rising Support Trendline maintained
- Volume are in close sync with avg traded quantity and spiking heavily over past few days
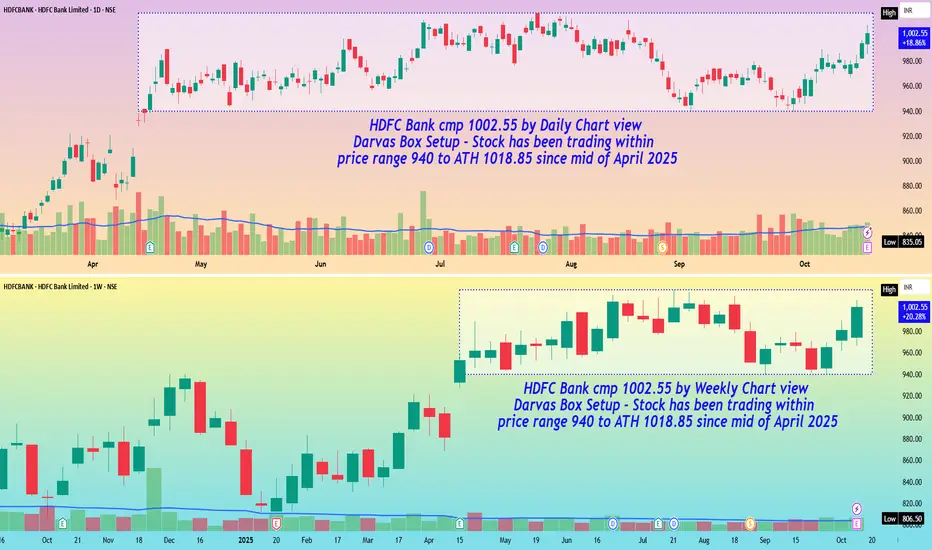
HDFC Bank cmp 1002.55 by Daily and Weekly Chart viewHDFC Bank cmp 1002.55 by Daily and Weekly Chart view
- Darvas Box Setup : Stock has been trading within price range 940 to ATH 1018.85 since mid of April 2025
- Stock chart has made Bullish Rounding Bottoms on both timeframes providing a technically logical upside target of +/- 1100 in the near future
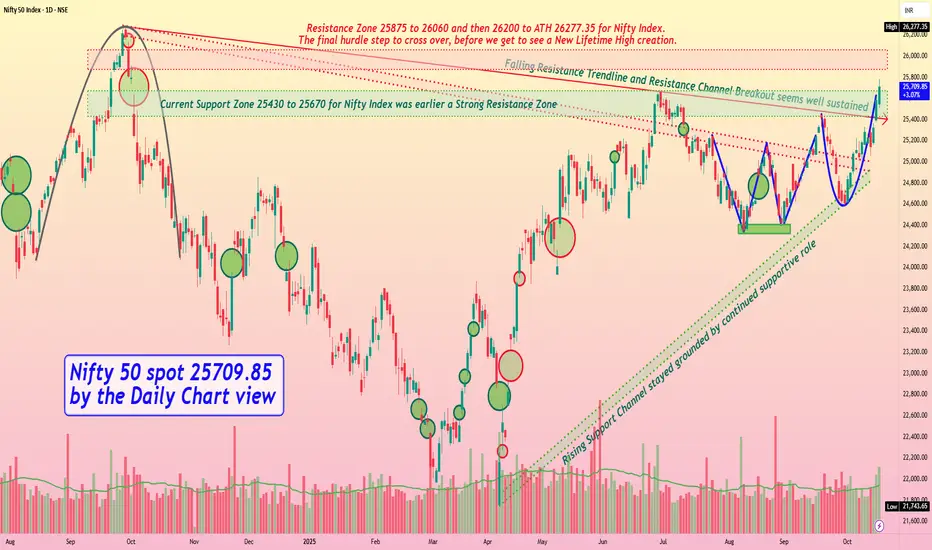
Nifty 50 spot 25709.85 by the Daily Chart view - Weekly updateNifty 50 spot 25709.85 by the Daily Chart view - Weekly update
- [ b]Nifty Index now just 567.50 points away from ATH 26277.35 for creating a New Lifetime High Milestone
- Resistance Zone 25875 to 26060 and then 26200 to ATH 26277.35 for Nifty Index
- The final hurdle step to cross over before we get to see a New Lifetime High creation
- Both Falling Resistance Trendline and Resistance Channel Breakout seem well sustained
- Current Support Zone 25430 to 25670 for Nifty Index was earlier a Strong Resistance Zone
- Rising Support Channel has stayed firmly grounded by providing the continued supportive role
- Bullish Technical patterns Double Bottom "W" followed by Rounding Bottom formed by Support Zone neckline
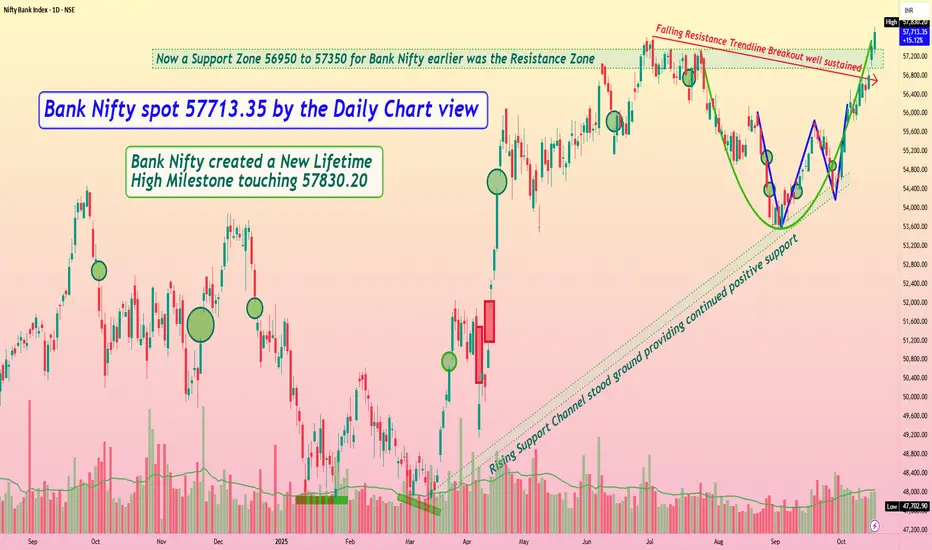
Bank Nifty spot 57713.35 by the Daily Chart view- Weekly updateBank Nifty spot 57713.35 by the Daily Chart view- Weekly update
- Bank Nifty created a New Lifetime High Milestone touching 57830.20
- Resistance Zone 56950 to 57350 then ATH 57628.40 for Bank Nifty
- Falling Resistance Trendline Breakout seems to be well sustained for now
- Rising Support Channel stood ground and providing steady positive support
- Current Support Zone 56950 to 57350 for Bank Nifty was earlier the Resistance Zone
- Bullish Rising W pattern done and has been well sustained by current trending momentum
- Bullish Rounding Bottom formed by Support Zone neckline inclusive of W pattern actively effective
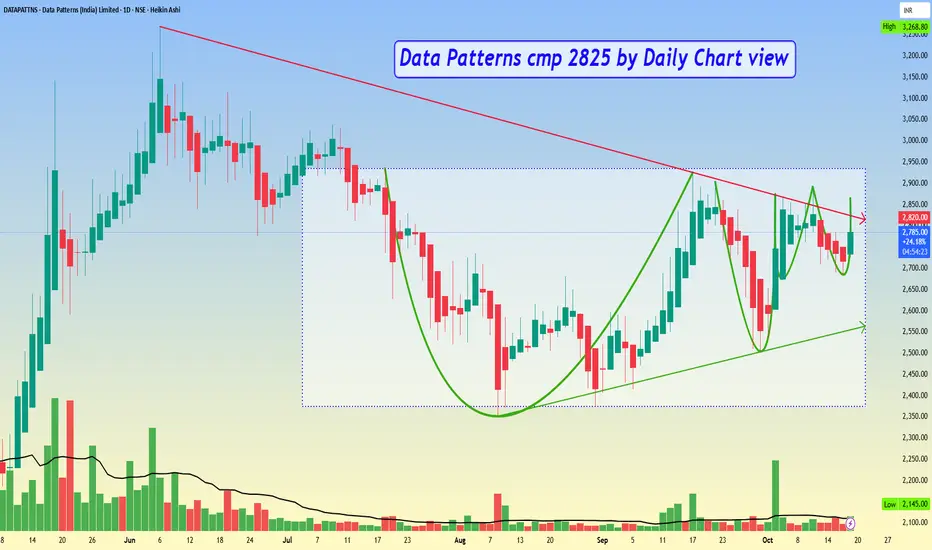
Data Patterns cmp 2825 by Daily Chart viewData Patterns cmp 2825 by Daily Chart view
* Support Zone 2585 to 2685 Price Band
* Resistance Zone 2935 to 3065 Price Band
* Stock has made a near tight and contracting VCP pattern
* Falling Resistance Trendline Breakout in the making process
* Darvas Box pattern with price trending between 2375 to 2935
* Bullish Rounding Bottom formed by the Resistance Zone neckline
* Volumes spiking intermittently by good numbers over past few weeks
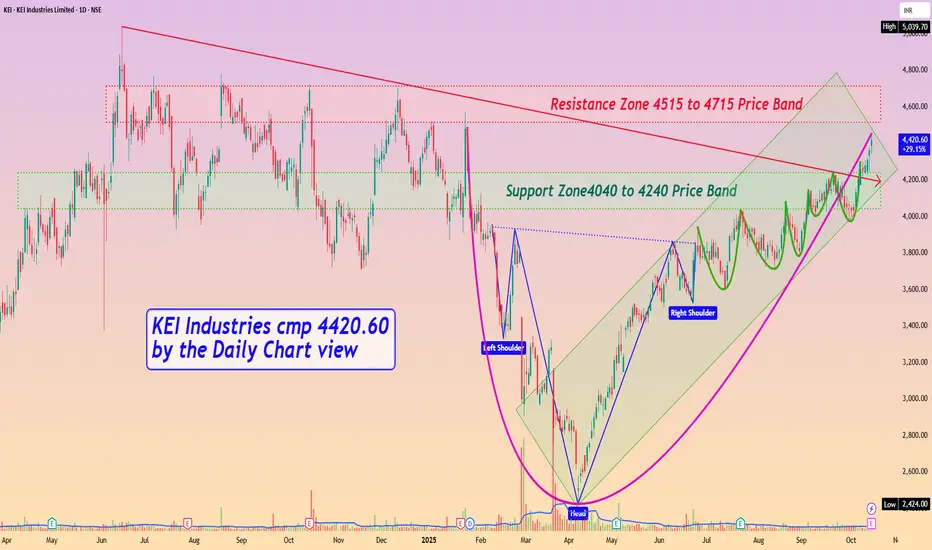
KEI Industries cmp 4420.60 by Daily Chart viewKEI Industries cmp 4420.60 by Daily Chart view
- Support Zone4040 to 4240 Price Band
- Resistance Zone 4515 to 4715 Price Band
- Falling Resistance Trendline Breakout seems sustained
- Support Zone under test retest phase over the past few days
- Price seen is traversing inside Rising Parallel Parallel Price Channel
- Volumes are seen to be in close sync with the average traded quantity
- Multiple Bullish Patterns formed of Rounding Bottom, Head & Shoulder and a tight VCP too
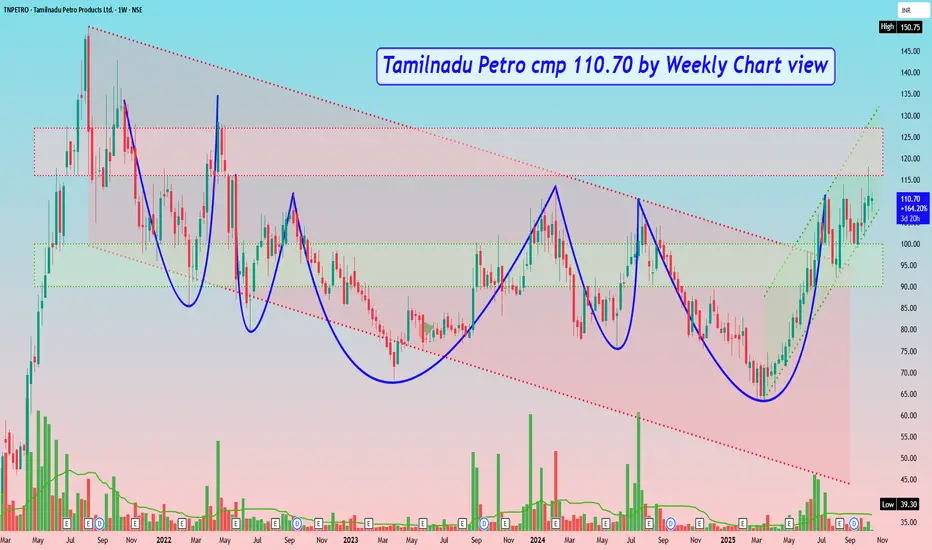
Tamilnadu Petro cmp 110.70 by Weekly Chart viewTamilnadu Petro cmp 110.70 by Weekly Chart view
- Weekly basis : Support Zone 90 to 100 Price Band
- Weekly basis : Resistance Zone 116 to 127 Price Band
- Multiple Bullish Rounding Bottoms around Support Zone and by Resistance Zone neckline
- Price was traversing in Falling Parallel Price Channel then took Breakout moving in Rising Parallel Price Channel
- Subject to the Resistance Zone Breakout and closure sustained above it for few days, may anticipate for fresh upside probability
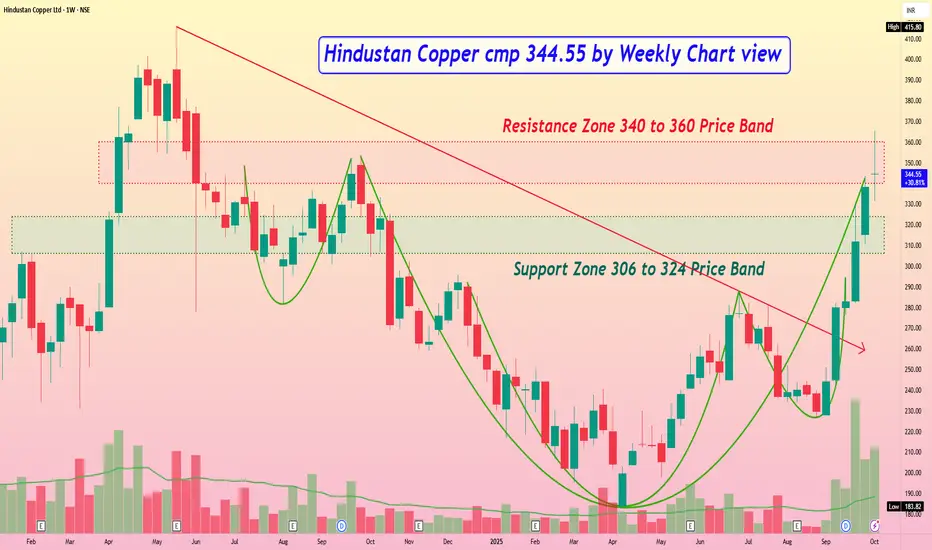
Hindustan Copper cmp 344.55 by Weekly Chart viewHindustan Copper cmp 344.55 by Weekly Chart view
- Support Zone 306 to 324 Price Band
- Resistance Zone 325 to 337 Price Band
- Falling Resistance Trendline Breakout is well sustained
- Bullish Rounding Bottom formed by Resistance Zone neckline
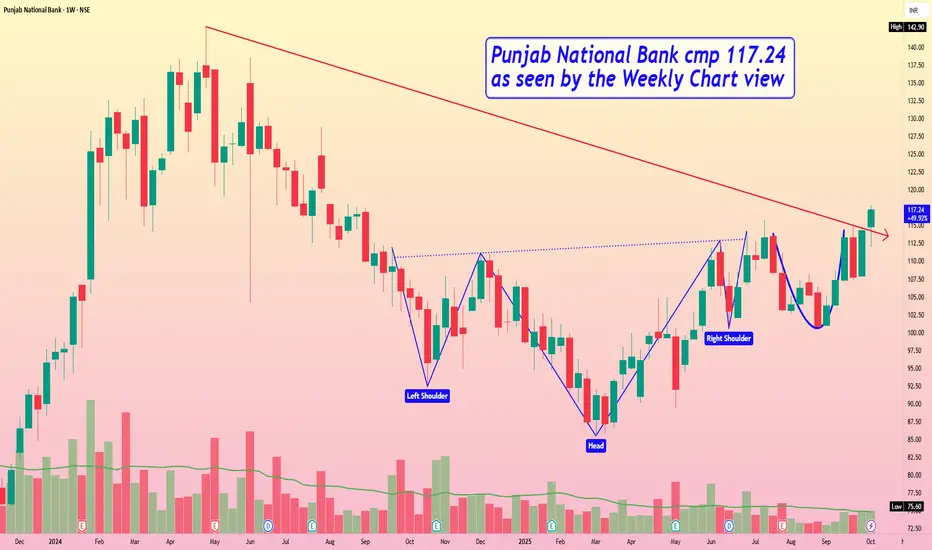
Punjab National Bank cmp 117.24 by Weekly Chart viewPunjab National Bank cmp 117.24 by Weekly Chart view
- Weekly basis Support levels seen at 107 > 98 > 87
- Weekly basis Resistance levels at 124 > 133 > ATH 142.90
- Bullish Head & Shoulders followed by Rounding Bottoms formed
- Volumes seen getting in close sync with the average traded quantity
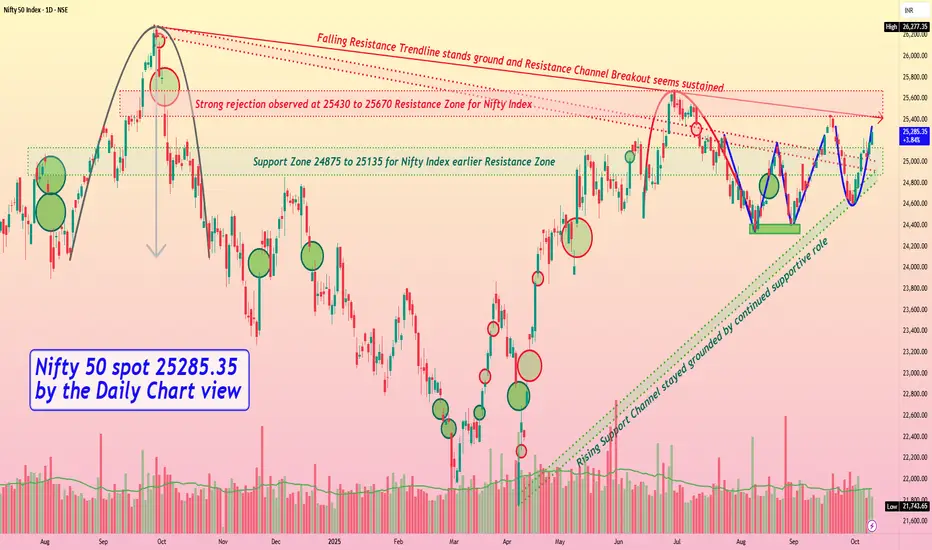
Nifty 50 spot 25285.35 by the Daily Chart view - Weekly updateNifty 50 spot 25285.35 by the Daily Chart view - Weekly update
- Support Zone 24875 to 25135 for Nifty Index earlier Resistance Zone
- Rising Support Channel stayed grounded by continued supportive role
- Strong rejection observed at 25430 to 25670 Resistance Zone for Nifty Index
- Falling Resistance Trendline stands ground and Resistance Channel Breakout seems sustained
- Bullish Technical patterns of "W" Double Bottom followed by Rounding Bottom formed around Support Zone