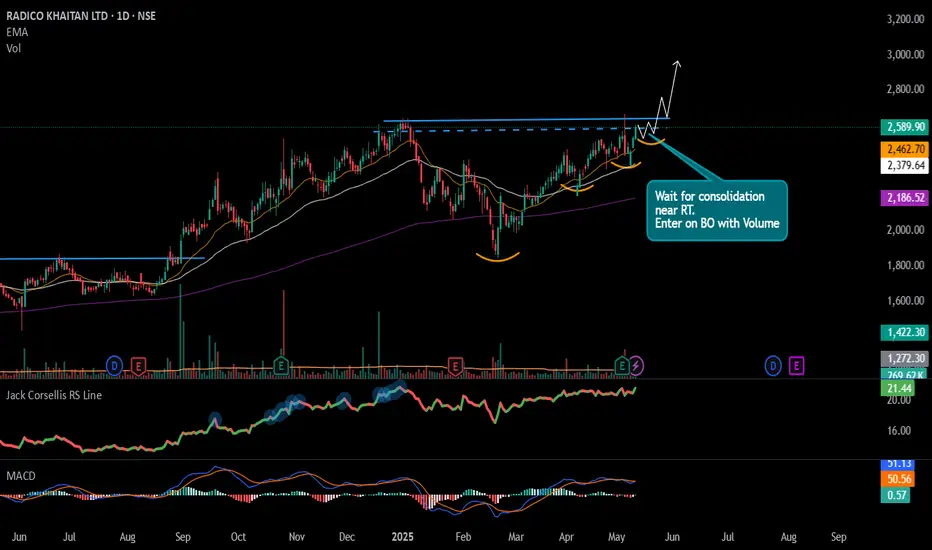
#RADICO - Potential Breakout Keep in WL📊 Script: RADICO
Key highlights: 💡⚡
📈 Roiunding Bottom Pattern / VCP Set up in Daily Time Frame.
📈 Wait for price consolidating near Resistance.
📈 Can Enter on BO with Volume spike or Wait for Pullback
📈 MACD Nutral
📈 One can go for Swing Trade.
BUY ONLY ABOVE NA DCB
⏱️ C.M.P 📑💰- 2589
🟢 Target 🎯🏆 – NA%
⚠️ Stoploss ☠️🚫 – NA%
️⚠️ Important: Market conditions are Okish, Position size 50% per Trade. Protect Capital Always
⚠️ Important: Always Exit the trade before any Event.
⚠️ Important: Always maintain your Risk:Reward Ratio as 1:2, with this RR, you only need a 33% win rate to Breakeven.
✅Like and follow to never miss a new idea!✅
Disclaimer: I am not SEBI Registered Advisor. My posts are purely for training and educational purposes.
Eat🍜 Sleep😴 TradingView📈 Repeat 🔁
Happy learning with MMT. Cheers!🥂
Roundingbottom
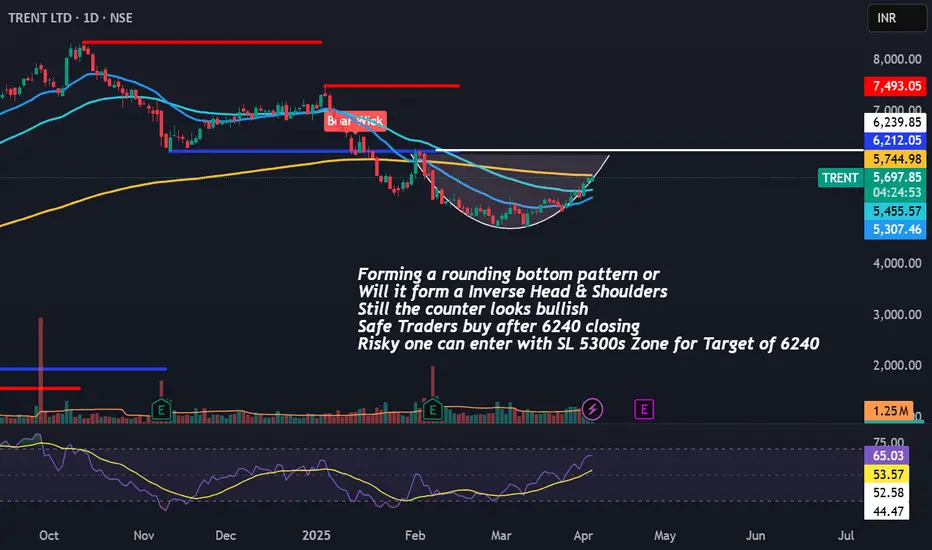
Trent Bullish Bias Target of 6240/-Forming a rounding bottom pattern or
Will it form a Inverse Head & Shoulders
Still the counter looks bullish
Safe Traders buy after 6240 closing
Risky one can enter with SL 5300s Zone for Target of 6240
#KSCL - VCP BO in DTF📊 Script: KSCL
Key highlights: 💡⚡
📈 VCP in DTF
📈 BO with Volume
📈 MACD gave a Bounce
📈 Price consolidated for 140Days
📈 One can go for Swing Trade
⚠️ Over All Market condition is bad, Practice paper trading
🟢 If you have any questions regarding the setup, please feel free to leave your inquiries in the comments, and I will respond promptly.
BUY ONLY ABOVE 1036 DCB
⏱️ C.M.P 📑💰- 1036
🟢 Target 🎯🏆 – 16%
⚠️ Stoploss ☠️🚫 - 8%
⚠️ Important: Always Exit the trade before any Event.
⚠️ Important: Always maintain your Risk & Reward Ratio.
✅#Boost, #Like & #Follow to never miss a new idea! ✅
Disclaimer: I am not SEBI Registered Advisor. My posts are purely for training and educational purposes.
Eat🍜 Sleep😴 TradingView📈 Repeat 🔁
Happy learning with MMT. Cheers!🥂

Bluestar Cup and handle pattern breakout AC theme, data centre theme, bluestar new star again in bull trend
could possibly be again rally from these levels more upside visible.
strong company strong sector growth strong management and clean chart structure
targets in chart

Policybazar-A rounding bottom pattern of ATH breakoutPolicybazar has formed a beautiful rounding bottom pattern and is now looking strong for a strong bullish trend.
Stock belongs to new age startup category and investing has more risk associated compared to bluechip stocks.
ATH breakouts are usually explosive and can be considered for quick swing trade as well.A similar pattern was observed in Zomato and stock has given good returns since then.
Idea is just my personal opinion and not a recommendation.

RAJRATAN GLOBAL, POSSIBLE BREAKOUT CANDIDATERajratan Global, CMP 499, witnessed huge correction from ATH.
Seems like at the bottom of both rounding bottom patterns, one
from its intermediate level as well as another from ATH level.
Important Support & Resistance levels are marked. Trendline
breakout will also coincide with up movement in rounding bottom,
again with due respect to key price levels.

GokulAgro ready for yet another up move?After a stage breakout, Gokul Agro pulled back and Forming a rounding bottom and aiming for a fresh breakout.
Keep it on your radar.
#gokulagro #InvestSmart

IRCON - Long Term ViewThe chart shows a technical analysis of IRCON International Ltd on a daily timeframe. Here's an analysis based on the visible elements:
1. **Price Action**
- **Downtrend:** The stock has been in a sustained downtrend for a few months, as indicated by the descending price channel (blue shaded area).
- **Breakout Attempt:** Recently, the price seems to be testing or slightly breaking above the upper boundary of the descending channel, suggesting a potential reversal or breakout.
2. **Support and Resistance**
- **Key Resistance Level:** ₹292.20 is marked as a significant resistance level.
- **Key Support Level:** ₹175.29 is identified as a crucial support level.
- These levels will likely act as turning points if the price moves toward them.
3. **RSI (Relative Strength Index)**
- The RSI is at **53.77**, which is near the neutral zone (50). This indicates no strong overbought or oversold condition currently.
- RSI above 50 could signal bullish momentum, especially if it continues rising.
### 4. **Volume**
- The chart shows decent volume activity around the current price level. Volume confirmation will be critical for validating any breakout above the channel.
### 5. **Projection**
- An upward trajectory is drawn (blue curve), potentially predicting recovery toward the ₹292.20 resistance zone and higher.
---
### **Trading Implications**
- **Bullish View:** If the price sustains above the channel's upper boundary with increased volume, it could indicate the start of an uptrend.
- **Bearish View:** Failure to break out or a drop below recent lows may lead to a retest of the ₹175.29 support level.

G R Infraprojects - Rounding Bottom and Dow TheoryA beautiful rounding bottom pattern.
The chart is making Higher High and Higher Lows.
When the macro-economic factors are negative, it is best to stick with proven patterns to increase the probability of a successful trade.
Infra space in India is a no brainer. Stoploss is pretty close so that once the trade is triggered on daily closing basis the risk reward ratio stays healthy.

Supriya- A breakout done for potential multibagger returns!Supriya Lifescience stock has given a beautiful rounding bottom pattern breakout in weekly TF
Stock has consolidated above the breakout level which shows strength of breakout.
Above 650, stock can fly towards 1000 levels.
Keep in watchlist. Not a recommendation.

Gabriel - Rounding Bottom patternA Rounding Bottom (also called a Saucer Bottom) is a bullish reversal pattern, typically indicating that the price is moving from a downtrend to an uptrend.
Rounding Bottom Formation: This pattern often forms over a long period and suggests that after a sustained decline, the asset is gradually transitioning into an uptrend. The price action forms a smooth, rounded curve, rather than a sharp, angular reversal.
Neckline Breakout: The "neckline" is the resistance level that is typically drawn at the top of the rounding formation, where the price has repeatedly failed to move higher. A breakout above this level is a key signal that the trend may be shifting from bearish to bullish.
Price Target: We are expecting that if the neckline is broken, the price could cross 500 level (a psychological round number), which suggests you’re anticipating a significant upside move once the breakout is confirmed. This is consistent with the typical behavior of a rounding bottom pattern, where the potential price target is often calculated by measuring the distance from the bottom of the pattern to the neckline and then projecting that distance upwards from the breakout point.
Trade Details: I am waiting for confirmation of the breakout before providing more details about the trade, including entry points, stop-loss levels, and exit strategy.

Vedl- Bullish from short term to very long termVedanta- First sign of bullishness shown after two months of fall. Always the lower timeframes indicates the change in trend. So lets start from the smaller timeframes.
1. 15 mins- Low to high and higher low is the first indicator of the bullish trend which can be seen now. Higher high and higher low is not formed clearly still as they are almost at the same level to their previous highs and lows.
1 hour- Formed double bottom because of the same levels of previous highs and lows in the 15 min timeframe. Breaking the resistance of 472 will take it to the target of 490 which again unleashes the Rounding bottom pattern.
Daily- After breaking the Rounding bottom pattern, the target of 533 will be achieved with the intermittent targets of 500 and 520. Weekly- Reaching each and every resistance will unleash the bigger and bigger rounding bottoms with the higher targets until 600 and 670 intially.

SIEMENS | Signs of Accumulation Siemens is a global technology company with a diverse range of products and services. Here are some key stats and information about Siemens:
Founded: 1847 by Werner von Siemens and Johann Georg Halske.
Headquarters: Munich, Germany.
Employees: Approximately 300,000 worldwide.
Business Segments:
Digital Industries: Automation and digitalization in manufacturing.
Smart Infrastructure: Electrical equipment and smart building technologies.
Mobility: Solutions for rail transportation.
Siemens Healthineers: Medical technology and healthcare services.
Siemens Financial Services: Financial solutions.
Global Presence: Operations in over 200 countries.
Sustainability Initiatives: Siemens is committed to sustainability and aims to be carbon neutral by 2030.
💡✍️Technical Reasons to trade or Strategy applied :-
✅Inverted Head & Shoulder Chart Pattern Bull Breakout
✅ Prior uptrend & Rounding Bottom
✅Breakout confirmed
✅Rise in Volume
✅Clear uptrend with HH & HLs sequence
✅Check out my TradingView profile to see how we analyze charts and execute trades.
🙋♀️🙋♂️If you have any questions about this stock, feel free to reach out to me.
📍📌Thank you for exploring our idea! We hope you found it valuable.
🙏FLLOW for more !
👍LIKE if useful !
✍️COMMENT Below your view !

BF INVESTMENT - Breakout & Rounding bottom Breakout and rounding bottom observed in NSE:BFINVEST
Entry : 682
SL 1 : RS21 turn negative
SL 2: ST 10,3 turn negative
TGT: 10-15 percentage

Rounding Bottom Breakout SoonNSE:POWERINDIA is about to make a Rounding Bottom Breakout breaking Key Levels Previously, and Conforming it's New Leg of Upmove. Keep in Radar.
Check out my other stock ideas below until this trade gets activated, I would love your feedback.
Disclaimer: This analysis is intended solely for informational and educational purposes and should not be interpreted as financial advice. It is advisable to consult a qualified financial advisor or conduct thorough research before making investment decisions.
KOTHARI PETROCHEM MAKING A FLAG AND POLE.KOTHARI PETROCHEM is making a Flag and Pole formation. Wait for breakout to enter.

Buy Tata steel round bottom breakout retest completeNSE:TATASTEEL Round bottom breakout strategy
Retest complete after round bottom breakout
Weekly chart
Big green candle formed at retest level
Volume rising
Stock is in uptrend
Do as directed in the chart
This is not the trading recommendation or advise 🚨
Do your analysis before taking any step 👍

Rounding Bottom Breakout Possible with Heavy Vol.NSE:HDFCLIFE Making a Good Rounding Bottom, Breakout Possible on Hourly Time Frame Keep a Check.

Rounding Bottom breakout in BRITANNIANSE:BRITANNIA has given Rounding Bottom Break out on Daily chart
Support zone at 5850-5870 levels
SL can be placed below support levels for Positional Trade
Pattern Target 6300
NSE:BRITANNIA
just for educational purpose. no buy or sell recommendation

Rounding Bottom in Rising Channel NSE:POWERGRID is Making a Rounding Bottom near its ATH in a Rising Channel giving Respect to 100 EMA with Heavy Volumes once breaking it, it will continue its uptrend Further ahead in days to come. Keep on Watch.
Disclaimer: This analysis is intended solely for informational and educational purposes and should not be interpreted as financial advice. It is advisable to consult a qualified financial advisor or conduct thorough research before making investment decisions.

CEAT LTD Hits 52-Week Breakout CEAT LTD just hit a 52-week high and looks set for more gains! 📈 Strong technical signs suggest the stock could keep rising, so it’s worth keeping an eye on for potential opportunities! 🚗💨
⭕️Price Action Analysis Alert !!!⭕️
💡Equity Stocks Trading📉📈📊
✍️Technical Reasons to trade or Strategy applied :-
✅ Bullish Trendline Breakout
✅ Trapped Buyers Strategy
✅ Supportive Moving Average
✅Strong Chart Pattern (Rounding Bottom & Inverted H&S)
✅Parallel Channel Breakout
✅All-Time-High Breakout
✅Strong Volume seen
💡Check out my TradingView profile to see how we analyze charts and execute trades.
🙋♀️🙋♂️If you have any questions about this stock, feel free to reach out to me.
📍📌Thank you for exploring our idea! We hope you found it valuable.
🙏 FOLLOW for more content!
👍 LIKE if you found it useful!
✍️ COMMENT below with your thoughts and feedback!

Zomato-Is it investment worthy now?This is an idea of one of the most famous listed new age company, Zomato
The stock had listed at 2x of issue price(around 70) and later on went to about 50% of issue price and now again standing at 2x of issue price.
What an amazing rounding bottom pattern!
This kind of breakouts are very powerful to give multibagger returns.
Keep in watchlist. Best buy range is 125-130

Meta : Rounding bottom - LONGHey everyone! 🌟
It looks like Meta has successfully completed a rounding bottom pattern as of January 2024 and is currently forming a bullish flag pattern with some strong volume. They’ve just had a clean breakout, which is exciting! The target from the rounding bottom or cup pattern is around 702, with support at 515, especially since the current market price is 561.34.
This setup offers a great risk-reward ratio of 1:3 for long-term positions.
If you found this chart analysis helpful, give it a like! 😊📈
