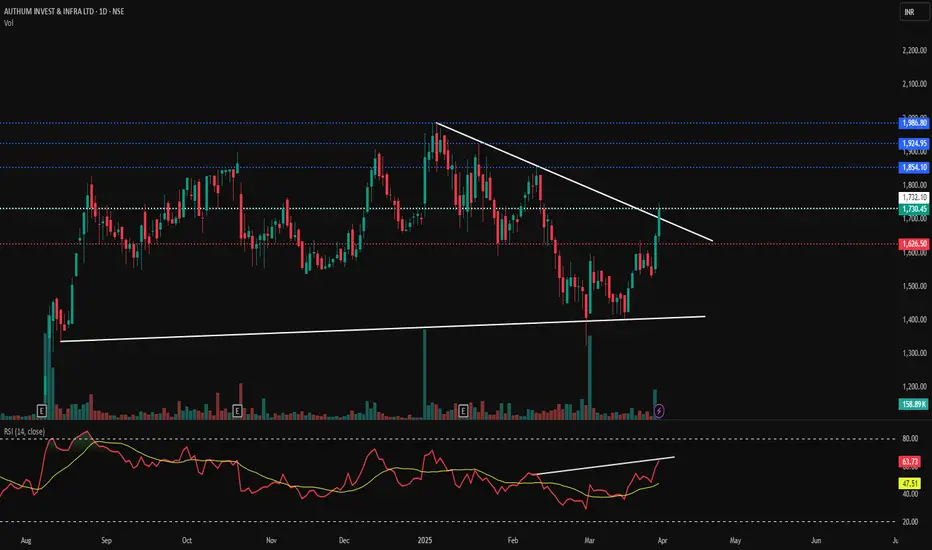
Authum Investment & Infrastructure Ltd**AIIL:**
A one-day breakout has occurred, accompanied by a significant spike in volume. You can consider adding to your position at the current level of 1732 until the retest is complete. Start by adding 50% now, and if the price falls to 1680, add another 15%.
The support level is at 1626.50 based on the daily close, while the resistance levels are at 1854.10, 1924.95, and 1986.80.
Rsidivergence
WAAREE ENERGIES LTD - Cup Breakout with Rising RSI⚡ WAAREE ENERGIES LTD – Cup Breakout with Rising RSI
🕒 Timeframe: 1D | NSE: WAAREENER
📅 Date: April 22, 2025
💰 CMP: ₹2,444.20
📈 Volume: 2.15M
🔍 Chart Observations
☕ Cup Formation visible on the daily chart – smooth rounding bottom structure, signifying accumulation.
📐 Breakout from Downtrend Line confirms bullish intent with strong momentum and volume.
🧱 Key Levels
🔵 Resistance Zones (Targets):
₹2,674.55 – recent swing high
₹2,869.00 – key psychological resistance
🔴 Support Level:
₹2,229.60 – neckline of cup & breakout retest zone
📉 Trendline:
Long descending trendline (white) has been broken on the upside
📊 Technical Indicators
📈 RSI (Relative Strength Index)
Currently at 63.93, comfortably in bullish territory
Recent “Bull” label marks bullish RSI divergence & breakout
Still has room to rise before overbought zone
✅ Conclusion
Cup pattern breakout with strong volume & positive RSI = bullish structure
Sustained move above ₹2,444 could invite targets of ₹2,670+ in coming sessions
Ideal setup for swing traders with a clear SL below ₹2,229
📉 Chart by: PriceAction_Pulse
📘 For educational use only. Always DYOR before making any trading decisions.

Hindustan Foods Ltd-Symmetrical Triangle Breakout!Hindustan Foods Ltd.—Symmetrical Triangle Breakout! 🚀📈
📅 Published on: April 12, 2025
📊 Chart Insight:
HNDFDS has broken out of a well-formed symmetrical triangle pattern on the daily chart, signaling a potential bullish continuation. The breakout is accompanied by a solid green candle and volume surge, hinting at strong momentum ahead.
🔍 Key Technical Highlights:
🔺 Pattern: Symmetrical Triangle (Lower highs + Higher lows)
📏 Breakout Level: ₹560
📈 Current Price: ₹571.65 (+4.03%)
📊 Volume Spike: 109.28K—a notable increase compared to recent sessions
📌 Support & Resistance Levels:
Immediate Support: ₹560 (breakout level)
Next Support (lower trendline): ₹530
Resistance Levels to Watch:
₹586 (minor supply zone)
₹615
₹645 (swing high)
📉 RSI Indicator:
Current RSI: 60.40—strong upward move, not yet overbought
Hidden Bullish Divergence (visible on chart): RSI made higher lows while price was consolidating—early bullish signal
Bearish markers now invalidated post-breakout
🧠 Trade Idea / Strategy:
📥 Buy on dips near ₹560–₹565 if price retests breakout
🛑 Stop-loss: ₹530 (below ascending trendline)
🎯 Targets: ₹586 ➡ ₹615 ➡ ₹645
📘 Note: Triangle breakouts typically indicate strong price movement after consolidation. Volume confirmation adds conviction.
🔔 Disclaimer: This chart is for educational purposes only. Do your own analysis or consult a financial advisor before investing.

HIKAL LTD - Long-Term Cup & Handle Breakout | Weekly ChartHIKAL LTD - Long-Term Cup & Handle Breakout | Weekly Chart
🕒 Timeframe: 1W | NSE: HIKAL
📅 Date: April 18, 2025
💰 CMP: ₹431.60
📈 Volume: 4.57M
🔍 Chart Highlights
☕ Cup & Handle pattern forming over a multi-year base, suggesting a potential long-term breakout.
📏 Breakout Zone (Resistance):
🟪 ₹440–₹460 (purple zone) – Multiple rejections in the past. Price is now testing this major supply zone.
📉 Downtrend Resistance Line:
Price has broken above the falling trendline, confirming bullish strength.
🟩 Support Levels:
₹400 (recent breakout retest zone)
₹360 (previous structure low)
📈 Resistance Ahead:
₹470 (long wick area)
₹510 (supply zone)
🧠 Technical Indicators
📊 RSI (Relative Strength Index)
RSI at 61.63, approaching the bullish zone
RSI breakout above previous bearish structure
“Bull” and “Bear” labels show previous sentiment shifts
🔔 Conclusion
✅ A classic Cup & Handle breakout on weekly timeframe with strong volume surge
✅ Above key resistance with bullish RSI — suggests potential continuation
⚠️ Watch for sustained close above ₹460 for confirmation
🔍 Chart by: PriceAction_Pulse
📬 For more detailed insights, follow on TradingView
✅ Educational purpose only — DYOR before any investment decision.

Punjab Chemicals and Crop Protection Ltd**PUNJABCHEM:**
A one-day breakout has occurred, accompanied by a significant spike in volume. You can consider adding to your position at the current level of 928 until the retest is complete. Start by adding 50% now, and if the price falls to 850, add another 15%.
The support level is at 822.20 based on the daily close, while the resistance levels are at 1013.90 and 1084.60.

GOLDHello & welcome to this analysis
A bearish Harmonic Deep Crab formation took place in the 60m time frame, after an initial dip which formed bullish hidden RSI divergence in 60m time frame the pullback has now formed a bearish Harmonic Gartley in 15m time frame.
Sustaining below 88000 opens for 87500 and 86500.
Good risk reward set up for a bearish trade.
All the best

SCI(Shipping Corporation of India) Analysis!NSE:SCI – Double Bottom Pattern Forming a Bullish Reversal?
📊 Chart Pattern:
A Double Bottom pattern has been identified on the daily chart of Shipping Corporation of India (SCI), indicating a potential trend reversal from the recent downtrend.
🔍 Key Observations:
Falling Bottom & Rising Bottom:
The first bottom formed at a lower level, followed by a second bottom at a slightly higher level, aligning with bullish RSI divergence (indicating possible strength in the price action).
Neckline Breakout Level:
The neckline of the pattern is around ₹169-172, which serves as the critical resistance level. A breakout above this level could confirm a bullish move.
Projected Target:
The pattern height projection suggests a potential target of ₹193.65 upon a successful breakout.
EMA Resistance Levels:
The price is currently below the 50 EMA (₹198.76), 100 EMA (₹212.83), and 200 EMA (₹218.62). A breakout above these levels would further strengthen the bullish outlook.
RSI Recovery:
The Relative Strength Index (RSI) is recovering from oversold levels, currently at 42.38, suggesting that bullish momentum is slowly building.
📈 Trading Plan:
A confirmed breakout above ₹169-172 with strong volume could indicate a further bullish rally toward the ₹193-195 zone.
Stop-loss: Below the second bottom level to manage risk.
Watch EMA Levels: The stock needs to sustain above key moving averages to continue upward momentum.
Disclaimer: Consider my analysis for educational purposes only.
Before entering any trade:
1️⃣ Educate Yourself – Understand market dynamics and technical patterns.
2️⃣ Do Your Own Research & Analysis – Never rely solely on external opinions.
3️⃣ Define Your Risk-Reward Ratio – Ensure your trade aligns with your risk appetite.
4️⃣ Never Trade with Full Capital – Always manage risk and preserve capital.
Trade wisely! ✅📊

Godrej Properties good to go long
Godrej Properties On Double Bottom + 61.8 Fibo ratio + RSI Diversion (clearly Show on 4 hrs & Daily)
Good to Go long for Positional buy.
Infra Sector is on good move in last 2years - this stock also correct perfectly
i thing this stock will give good returns in Next few months.

IOLCP: The Next Big MoveFollowing a prolonged 4 month downtrend, IOLCP has successfully breached the significant resistance level at 417 on daily chart, which now serves as a change of character. The RSI has also crossed above the 60 threshold, further supporting the idea of positive momentum within the stock. Additionally, the daily closing prices are positioned above all EMAs, indicating a strong bullish sentiment.
At this juncture, IOLCP appears poised for upward movement, with the next resistance level identified at 514 . Refer to the accompanying chart for a visual representation of Resistance, Breakout and Stop-Loss.
Disclaimer: This analysis is provided solely for informational and educational purposes and should not be interpreted as financial advice. It is essential to conduct your own research and consult with a qualified financial advisor before making any investment decisions.

L&T FINANCE - PERFECT RSI DIVERGENECE; LETS SEE HOW IT WORKSL&T Finance Ltd. is an interesting chart with following
1. Positive RSI Divergence on Daily Chart
2. Price taking minor support at monthly super trend levels
3. Double Bottom with Outside and inside (Bollinger Band) Bars on daily chart
4. Major Trend line support on weekly chart near 122-132 zone
5. Price near 50% Fibonacci Retracement level at 135.45 and thereafter 61.8% retracement near 121.60 levels
6. Can be a good risk reward for a reversal trade
Caution: Stock as well as benchmark index both are in down trend with Stock's RSI below 40 on both Daily and Weekly charts. One must keep on radar with strict Stop loss as per one's own Risk reward matrix
Lets See How it evolves.
Disclaimer: NOT A BUY / SELL RECOMMENDATION I am not an expert I just share interesting charts here for educational purpose and not to be taken as buy/sell recommendation. Please seek expert opinion before investing and trading as trading/ investing in market is subject to market risks. I do not hold any position in the stock as on date but I may look to take some position with my own Risk Reward matrix.

Sarthak Metals LTD: A Comprehensive Technical AnalysisToday, Sarthak Metals LTD exhibited significant price movement, experiencing a bullish increase of 15%. The trading volume reached approximately 875,000 shares, which is more than ten times the stock's average daily trading volume. This unusual activity is a strong indicator of heightened investor interest and market engagement. This pattern can be observed on the previous chart, during which the stock reached its all-time high.
The stock managed to close above its key EMAs, specifically the 20, 50, and 100-day EMAs. This convergence of price closure above these critical indicators suggests a potential trend reversal or a continuation of an upward trend. The ability to surpass these EMAs may provide a layer of support for future price movements.
The RSI and the MACD indicators are both displaying bullish signals. The RSI, which currently indicates the stock is in a favourable buying zone, reflects strong upward momentum. Concurrently, the MACD line crossing above the signal line further reinforces the bullish sentiment in the market for Sarthak Metal.
Should a breakout occur above the current trendline resistance, I could anticipate further positive momentum and upward movement, with the next target resistance identified at 299 . Conversely, the current support level is noted at 162 , providing a reference point for potential downside risk.
Disclaimer: The insights provided in this technical analysis report are intended solely for informational and educational purposes. This information should not be interpreted as financial advice or a recommendation to purchase or sell any securities. It is paramount to consult with a qualified financial advisor and conduct your own thorough research prior to making any investment decisions.

BAJAJ FINANCEHello and welcome to this analysis
After reversing from a bearish harmonic Gartley pattern its now gone on to test its previous breakout level.
In lower time frame its forming a bullish RSI divergence. Sustaining above 7400 it could retest 7700 and more provided it does not break 7200.
Happy trading and investing

USDJPY: Bears have strong reasons to regain controlAs Yen traders return from a long weekend, the USDJPY is testing its recent dip from a five-week-old downward resistance line, influenced by a rebound in the US Dollar. It’s worth noting that the quote’s recovery in the last week benefited from positive signals from the RSI and MACD indicators, bouncing back from a nine-month horizontal support zone.
Sellers keep the reins
While USDJPY buyers are making their presence felt, a bearish RSI divergence and a moving average crossover, combined with the resistance line, keep sellers optimistic about potential downward moves. The 100-day Exponential Moving Average (EMA) has crossed below the 200-EMA, signaling a bearish trend. Additionally, the higher high on the indicator contrasts with the lower high in prices, reinforcing the bearish RSI divergence.
Key technical levels to watch
Sellers will gain confidence if USDJPY breaks below a seven-week horizontal support area around 141.70-80. However, the lows from December 2023 and September 2024 pose a challenge for bears at 140.20-139.60. If the pair drops below 139.60, it could test the mid-2023 low near 137.30.
On the flip side, buyers will initially target the falling resistance line around 144.25. If successful, they may then aim for the monthly high and late August peak near 147.20 and 149.40, respectively. Additionally, the 150.00 level acts as an important barrier for any upward movement.
Bulls face more challenges than bears
Whether through technical signals or the differing monetary policies of the Bank of Japan (BoJ) and the US Federal Reserve (Fed), USDJPY sellers face a relatively smoother journey compared to buyers.

RSI Bullish divergence with inside barAn inside bar in an uptrend
Rsi Bullish divergence
Low Risk reward ratio
Can enter for above mentioned trendline target
Stoploss is must

Nhpc Long Buy below/at 95
Target 3 = 107.30 with trailing stop loss
Target 2 = 103.32 with trailing stop loss
Target 1 = 99.19
Stop loss = 90.93
Just paper trade,
This is not a financial advice.

ALKYLAMINE : Understanding RSI Positive Divergence - RSI Positive divergence occurs when the price is in a downtrend but the indicator starts to rise.
- It is a condition where Price makes lower tops and lower bottoms whereas Indicators fail to do so.
- They make higher tops and higher bottoms. These are usually reliable signs as they predict prices are going to reverse.
From the above chart, you can see
On 27-03-2023 Price was at 2166 and RSI was 23.21
One 26-04-2024 Price was at 1808 and RSI was 26.90
So price was making lower lows and RSI was making higher lows, which show RSI Positive Divergence, which a signal of Trend Reversal.
Please do like the post if you learnt some this post

Bullish candle at Trendline support An inside candle taking support at the trendline could be a good opportunity
for going long
stoploss will be breaking out the trendline with high volume
PLong

IOC 240++currently at 7 pe
Rsi positive divergence
range bound
disclaimer- this is not any investment call or idea , this just my view and it can go wrong ,this is only for educational purposes trade at your own risk

Jubilant food:-This reversal can fill your portfolio's hunger!Jubilant food has been underperforming since few years.
Stock has formed strong positive RSI divergence at confluence of supports.
Above 500, reversal will start and above 600 , reversal will be confirmed.
Valuation wise, not a good stock but RSI divergence stock are known to give quick, big moves.
All positional traders shouldn't miss this stock

Infosys Ltd Analysis!NSE:INFY Analysis on a Daily Timeframe!
Double Bottom Pattern formation in Infosys Ltd!
Double Bottom Pattern/ W Pattern Formation with RSI Divergence!
Analysis:
As we can see in the chart NSE:INFY started falling down from Feb 2024. It was in clear downtrend. After that it has made a double bottom pattern but it's second bottom is lower than its first bottom, so I have added RSI indicator to get a confirmation about Divergence. We can see a clear divergence while price falling down RSI moving upwards so we can expect the price will move upwards in the upcoming trading sessions. I have marked all the important levels on the chart please have a look.
Trade Psychology and Setup:
Entry = Current price level is good to Enter
Target = 1607.65
Stop Loss = 1460.50
Disclaimer = Consider my analysis for Educational Purpose only.
Before entering into any trade -
1) Educate Yourself
2) Do your research and analysis
3) Define your Risk to Reward ratio
4) Don't trade with full capital

MUTHOOT FINANCE, Divergence is formed on the Daily ChartA strong Divergence has been formed on the Daily Chart.
The breakdown of 1733 will open the lower levels.
Disclaimer: This is my pre market analysis and my trading journal. Not a suggestion to buy or sell.

Nifty IT BULLISHThis perspective is for mid and long term.
Share the link as much as you can so everyone can benefit.
:)

Navin Fluorine INT - Looks Good!NSE:NAVINFLUOR - Daily Chart analysis
Price Vs RSI divergence seen on daily chart
Price Vs MACD divergence seen on daily chart
Bullish Head and Shoulder Pattern seen on daily chart.
PLEASE NOTE THAT:
This chart analysis is only for reference purpose.
This is not buying or selling recommendations.
I am not SEBI registered.
Please consult your financial advisor before taking any trade
