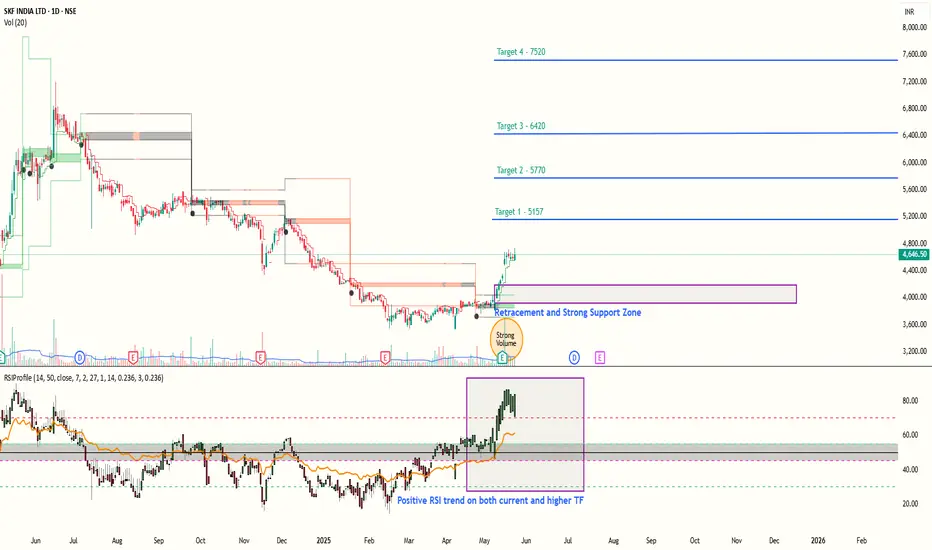
SKF Great Bullish PotentialSKF has been showing continous Bullish RSI trend in the daily chart. And fundamentals also exhibit strength, with the company being debt free, Good cashflow, Positive earnings and Rising EPS.
It has a very strong support zone in 3900-4200 price range, where big institutional and responsive buyers are present.
Big volume on chart indicate entry of initiative buyers after the price testes lows for some time and was effectively bought by responsive buyers.
RSI Profile shows - A Clear bullish trend.
We expect the price to continue rising in the coming weeks with the following targets
Targets :-
1) 5157
2) 5770
3) 6420
4)7520
Rsiindicator
Head and Right Shoulder–Weekly Strategy for Nifty 08 May Expiry!Hello everyone, This week’s expiry strategy is not just any setup – it’s a premium structure crafted to take advantage of market exhaustion near resistance. We’re calling it the Head and Right Shoulder Strategy, and the payoff shape says it all!
Why This Strategy? (Based on Chart Analysis)
Resistance Zone: 24400–24785 (supply-heavy region, multiple rejection wicks visible)
Support Zone: 23800 (major bounce levels, strong candle reactions)
RSI Divergence Confirmation: Bearish divergence spotted on higher time frame, hinting exhaustion
Strategy: Head & Right Shoulder – 08 May 2025 Weekly Expiry
Sell 2x 08MAY2025 24500CE @ 138
Sell 2x 08MAY2025 23850PE @ 115.65
Buy 1x 08MAY2025 24250PE @ 220.25
Buy 1x 08MAY2025 24250CE @ 269
Payoff Graph for Nifty weekly strategy
Strategy Highlights:
(Head and right shoulder pattern on payoff chart – limited loss, defined range!)
Why This Works (Key Logic + Technical View):
Bearish RSI Divergence: Visible on 2-hour chart
Minor resistance at 24400 acting as rejection zone
Resistance-heavy zone above 24750 – price unlikely to sustain above this weekly
Support near 23800 – strong bounce area
Volatility dropping – makes premium writing favorable
Risk Management:
Don’t hold if either side breaks with strong volume
Exit if Nifty sustains above 24800+ or below 23650
Always keep SL alert or reversal signs on breakout
Rahul’s Tip
“Options trading is not only about payoff views, it’s about understanding structure.
This setup looks like a Head and Right Shoulder on the payoff – and we’re trading it like one.”
Conclusion:
This Head and Right Shoulder structure fits perfectly for the current week. With clean resistance levels and visible exhaustion patterns, the payoff structure gives both direction and edge.
What do you think about this setup? Have you ever deployed Head & Shoulder shaped option strategies? Let me know in comments below!
If you found this post valuable, don't forget to LIKE and FOLLOW !
I regularly share real-world trading setups, actionable strategies, and learning-focused content — all from real trading experience, not theory. Stay connected if you're serious about growing as a trader!
Disclaimer: This analysis is for educational purposes only. Please consult a financial advisor before making investment decisions.

Nifty 15-Minute Chart Analysis for Intraday Levels 21st-Jan-2025Hello Everyone, i hope you all will be doing Good in your life and your trading as well. Let's start analysis on NIfty for Intraday Levels.
The chart highlights a well-defined No Trading Zone between 23,262 and 23,410. This area indicates indecision, where trading may lead to unfavorable outcomes. Patience is key while waiting for a breakout.
Here’s what happens:
A move above 23,410 may indicate bullish strength, leading to potential targets of 23,522 and 23,591.
Conversely, a move below 23,262 may signal bearish momentum, paving the way for levels like 23,162 and 23,061.
These levels act as decision points for intraday traders. A breakout above or below these zones could set the tone for the day. The RSI indicates underlying strength, but confirmation from price action is essential.
Disclaimer: This analysis is for educational purposes only. Please trade responsibly and consult a financial advisor before making any decisions.
If you found this analysis helpful, don’t forget to like, follow, and share your thoughts in the comments below! Your support keeps me motivated to share more insights. Let’s grow and learn together—happy trading!

DYDXUSDT Long Setup: Targeting Key LevelsWe're examining the DYDXUSDT pair for a potential long position, guided by technical analysis on the daily chart. The price action has settled into a consolidation pattern, making a strong base around the 2.979 entry point. This area has acted as a springboard, sending price action upwards with increasing momentum, as indicated by the recent green candles.
The Relative Strength Index (RSI) is currently at 60.59, which is neither overbought nor oversold, suggesting that there is room for upward movement before the market becomes overheated. This is supported by the RSI Divergence Indicator, which is not showing any signs of bearish divergence at this point, implying that the current bullish momentum has the potential to continue.
Our first profit target (TP1) is set at 3.420, which is in line with previous resistance levels that could now serve as a new support in the uptrend. The second profit target (TP2) is at 3.984, just below the significant psychological level of 4.0 and aligns with prior peaks where the price has shown considerable reactions in the past.
For risk management, a stop loss would be wisely placed below the recent consolidation zone to protect against any unexpected downturns. This strategic placement allows for normal price fluctuations without being stopped out prematurely.
In essence, this trade idea is built on the premise of a strong support base, continuous bullish momentum, and the absence of overbought conditions, presenting a compelling case for a long position on DYDXUSDT.

All about Apollo Hospitals.Hey there I am back with another Stock analysis. This time we will discuss in short about Apollo Hospitals.
Here are some pointers about this stock.
Key pointers.
>>The stock, Apollo Hospitals, was in a consolidation phase within an ascending triangle pattern for about 20 months.
>>It recently broke out from this ascending triangle pattern.
>>After the breakout, the stock formed a parallel channel pattern followed by a HIdden trend line but then experienced a breakdown.
>>The stock has retraced back to the breakout area and is currently accumulating.
>>As visible from chart there is a long hidden trend line, where price has retested multiple times.
>>Factors such as sales and profit data might have influenced the stock's fall.
>>The current zone is being viewed as a potential accumulation area.
>>The RSI indicator suggests that the stock is not overbought at all.
Key takeaways.
>>Lot of people make mistake by taking entry just after trend line breakout but they forget to find a hidden trendline.
>>An engulfing pattern can indicate as a potential entry trigger if the market shows bullish movement.
>> we will place stop-loss right under the tringle pattern and put target till long trend line.
Do consider pressing the boost button🚀🚀, It helps me bring more interesting analysis. And if you've any question and suggestion please feel free to post in comment section.
Note: This is for informational purposes only. Do your own research before investing.

COME TO REMOVE ALL THE OIL, IOCIndian oil corporation looking weak on charts rsi is also giving negative signals

NIFTY NEXT RECOURSEAlthough it gives negative breakout on Bollinger bands and curved trendlines but rsi is standing on major support levels on weekly chart

BITCOIN #BTC #BTCUSDT Bitcoin is looking fresh negative on monthly charts with negative rsi divergence although it is not good time to say for short because earlier i told it is negative at 280000 but yes it is weak in current setup

NIFTY SUPPORT LINES #NIFTY #NIFTY50Nifty is beautifully respecting horizontal support lines on weekly chart it is only wait and watch situation
Regards to all mates
