BUY TODAY SELL TOMORROW for 5%DON’T HAVE TIME TO MANAGE YOUR TRADES?
- Take BTST trades at 3:25 pm every day
- Try to exit by taking 4-7% profit of each trade
- SL can also be maintained as closing below the low of the breakout candle
Now, why do I prefer BTST over swing trades? The primary reason is that I have observed that 90% of the stocks give most of the movement in just 1-2 days and the rest of the time they either consolidate or fall
Round Bottom Breakout and Retest in RTNINDIA
BUY TODAY SELL TOMORROW for 5%
RTNINDIA
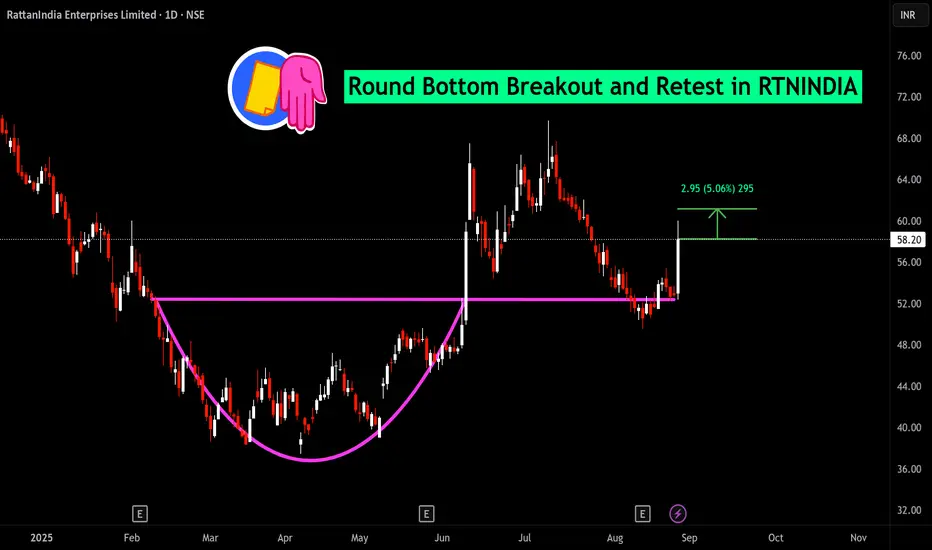
RTNINDIA: high reward to risk ratio➡️heavy volumes and big candles are the footprints of institutions
➡️Fund raising approved for business opportunities
➡️entry price 62.75 with a SL of 61
➡️since the #breakout was not confirmed, moved my SL within a few percentage points
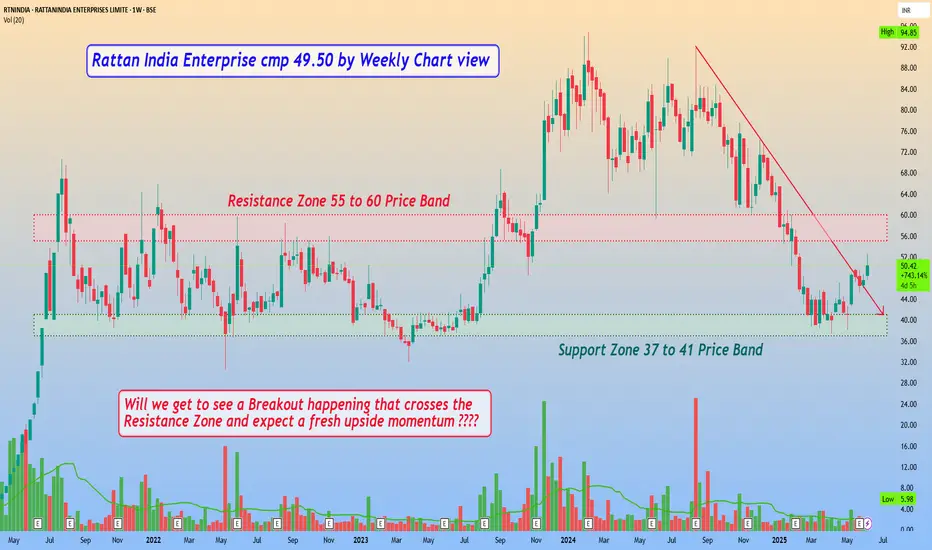
Rattan India Enterprise cmp 49.50 by Weekly Chart viewRattan India Enterprise cmp 49.50 by Weekly Chart view
- Support Zone 37 to 41 Price Band
- Resistance Zone 55 to 60 Price Band
- Volumes are getting in close sync with avg traded quantity
- Will we get to see a Breakout happening that crosses the Resistance Zone and expect a fresh upside momentum ????
Long Term view on #RTNINDIAThe analysis is for Long term where in it is showing potentials of reaching triple digit in coming years. (5,10,15)
### Price Movements:
1. **Current Price and Trend:**
- The current price is \(84.41\) INR, up by \(11.56\) INR (+15.87%).
- The stock is in a strong upward trend, as evidenced by the ascending price channel.
2. **Price Channel:**
- The price is moving within an upward channel. This channel indicates a long-term bullish trend.
- The top of the channel projects potential future highs, while the bottom of the channel provides support levels.
- The target is taken on the basis of the flag pattern
### Indicators:
1. **Volume:**
- The volume is significant at \(168.569M\), indicating high trading activity.
- An increased volume during upward movements often confirms the strength of the trend.
2. **MACD (Moving Average Convergence Divergence):**
- The MACD line (blue) is above the signal line (orange), indicating bullish momentum.
- The histogram is positive, reinforcing the bullish sentiment.
- The MACD values are \(1.55\) (MACD line) and \(11.39\) (signal line), which suggests strong bullish momentum.
### Key Observations:
1. **Historical Performance:**
- The stock has shown significant growth over the past few years, particularly since early 2020.
- A major price surge can be seen around mid-2021.
2. **Support and Resistance:**
- Immediate support is around the \(50\) INR level, which is a previous consolidation area.
- Resistance levels can be projected using the upper boundary of the ascending channel, around the \(120\) INR mark in the near term.
3. **Price Projection:**
- The chart indicates a projected move to \(938.54\) INR, which is a very optimistic target (+1292.46%). This projection aligns with the upper boundary of the long-term price channel.
### Conclusion:
The technical indicators and the price channel suggest a continued bullish trend for RattanIndia Enterprises Limited. However, given the significant rise, it is essential to monitor for any signs of overbought conditions and potential pullbacks. The strong volume and positive momentum indicators support the potential for further growth, but investors should remain cautious and consider setting stop-loss orders to protect against sudden market reversals.

Rattanindia Enterprises Ltd#RTNINDIA
CMP :₹.88.60/-
Date : 04-02-2024
Fundamentally a weak stock. Technically looking very good. Stock is now at a multi resistance zone. If it breaks with significant volumes then an awful move can be expected.
Disclaimer : Post only for educational purpose. Not a buying / selling recommendation. This is only my personal view. I am not a SEBI registered analyst . Do your own analysis and act accordingly

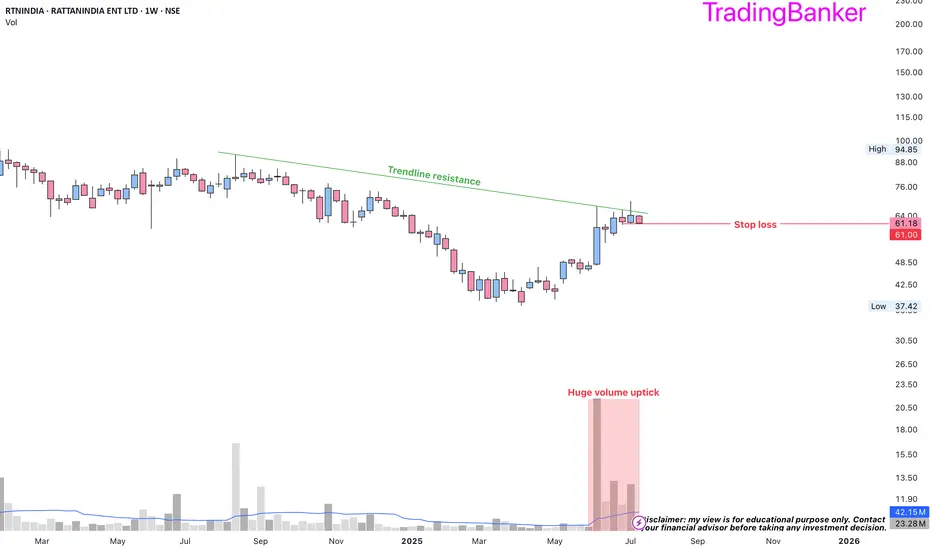
RattanIndia Enterprises Ltd - Long Setup, Move is ON...#RTNINDIA trading above Resistance of 56
Next Resistance is at 96
Support is at 50
Here is previous chart:
Chart is self explanatory. Levels of breakout, possible up-moves (where stock may find resistances) and support (close below which, setup will be invalidated) are clearly defined.
Disclaimer: This is for demonstration and educational purpose only. This is not buying or selling recommendations. I am not SEBI registered. Please consult your financial advisor before taking any trade.

Breakout in RattanIndia Enterprises Ltd...Chart is self explanatory. Levels of breakout, possible up-moves (where stock may find resistances) and support (close below which, setup will be invalidated) are clearly defined.
Disclaimer: This is for demonstration and educational purpose only. This is not buying or selling recommendations. I am not SEBI registered. Please consult your financial advisor before taking any trade.

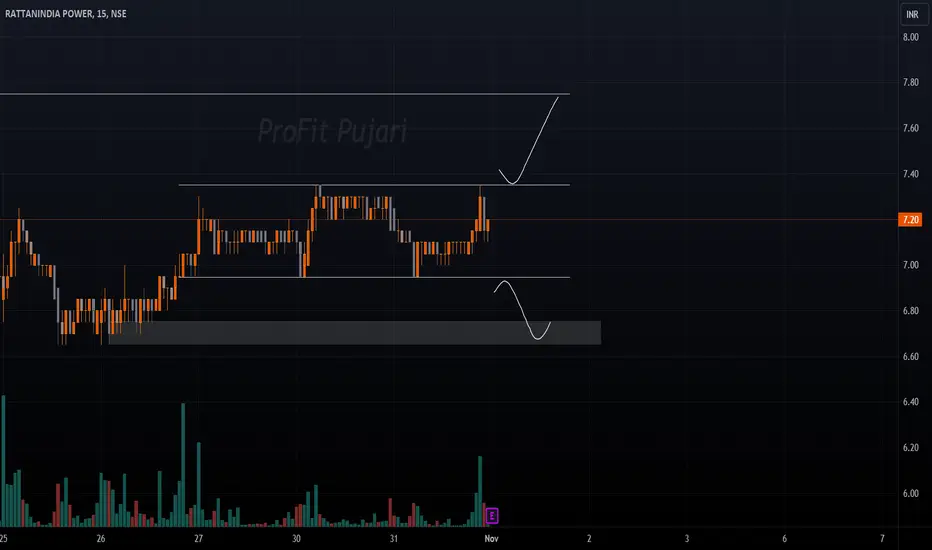
#RTNPOWER TRADE SETUPGreetings Folks,
today i have prepared a setup of RTNPOWER on NSE
the analysis is as follows-
- The price is speculating in a minor range right now
- very straight forward setup, wait for breakout either side as i am not in a particular bias right now
don't play with fire, always use a predefined stoploss
RTNINDIARTNINDIA Buy zone taregt and SL marked.
Only for education purpose. Investments in stock market is subjected to market risk do own researches before investing.

EXCITING BULLISH PATTERN📈 Exciting Bullish Pattern Alert! 🐂
📊 Pattern: Ascending Triangle
📌 Symbol/Asset: RTNINDIA
🔍 Description:
Stock with Strong Support and bullish Ascending triangle pattern. Trade can be taken once stock touches support of the triangle.
👉 Remember: Technical patterns are just one piece of the puzzle. Consider conducting further research, consulting with a financial advisor, and managing your risks appropriately.


RattanIndia Enterprises Ltd - 14.03.2022RattanIndia Enterprises Ltd - 14.03.2022
The stock is trading @ 50.75 levels (UPPER CIRCUIT - 10% band)
The prices are at Resistance Zone
The prices are above EMA
One can initiate a buy position with strict support @ 47.20
RSI is 53 in Weekly Chart
watch out for the price action

