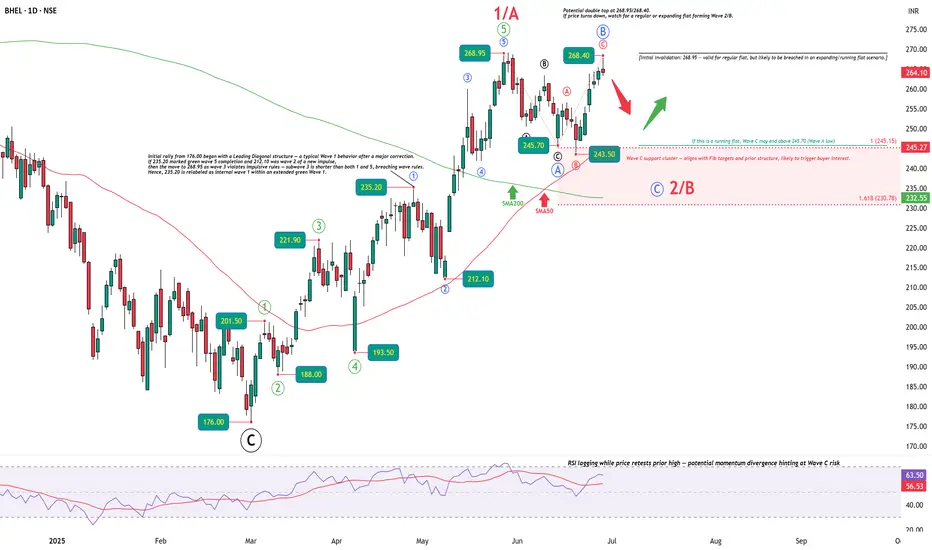
BHEL – Wave 2/B Pullback in Play?After a strong 5-wave rally from 176.00 to 268.95, BHEL may be entering a corrective phase — either a regular, expanding, or even a running flat.
Price has formed a potential double top at 268.95/268.40. The pullback from here could complete a Wave C within the 245–232 zone, supported by Fibonacci extensions and prior structure.
🔻 Short-term bias: bearish, targeting Wave C completion.
⚠️ However, if this turns out to be a running flat, Wave C may end above 245.70 (Wave A low) and still be valid — so price may reverse early.
📉 RSI is lagging as price retests highs — hinting at weakening momentum.
📌 Key Levels:
Invalidation for short-term short: 268.95 (tight; likely breached in expanding/running flat)
Wave C zone: 245.15 to 230.78
Structural invalidation (bullish view fails): below 230.78
🟢 Big picture: bullish.
This correction is likely setting up the next impulsive Wave 3 or C toward new highs.
Let price confirm it.
Disclaimer:This analysis is for educational purposes only and does not constitute investment advice. Please do your own research (DYOR) before making any trading decisions.
Runningflat
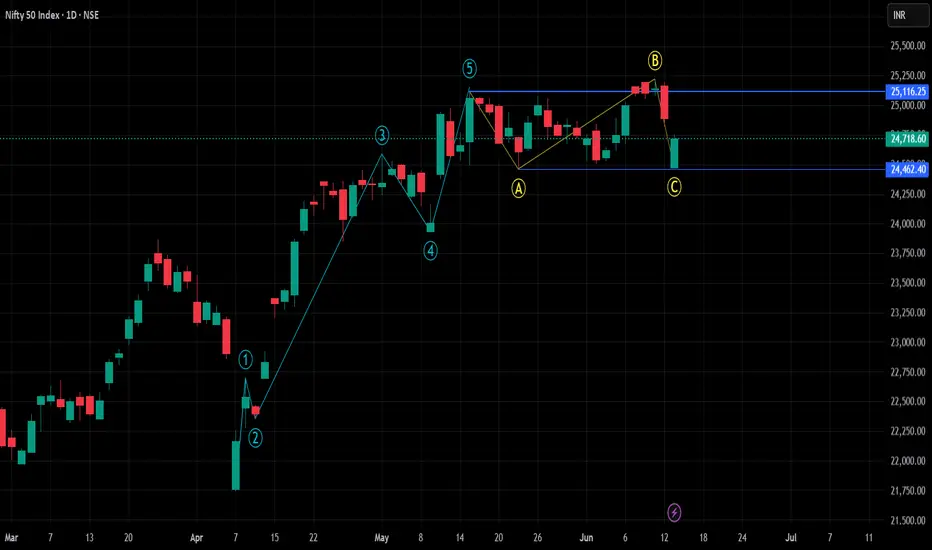
Nifty 50 Daily Wave Count - Trend - PatternHi, friends
Today we saw negative gap down opening and market recover very positively after a one deep.
But at the end of the day Nifty index gave negative close.
After impulsive move , we can see running flat type of corrective pattern that follows the 3-3-5 wave structure. It's similar to an expanded flat, where Wave B extends beyond the start of Wave A, but unlike the expanded flat, Wave C fails to reach the end of Wave A. This means the price retraces beyond the 100% level of Wave A in Wave B, but the subsequent Wave C doesn't complete the correction by exceeding Wave A's end point.
here i am assuming wave c is over . here i marked bottom of wave A, if low of wave A breaks then the running flat pattern will be invalided.
FLAT Correction in keystone realtors.Elliott Wave Analysis:-
FLAT correction
View1:-
a) wave correction was over and in b) wave correction c wave is pending either it should close above 658.75 then it will form expanding flat if it close below then it is a regular flat and it is expecting a break a) wave and it would reach the level of 533-549 .
View2:-
a) wave was completed and b) wave was completed and in c) wave formation I&ii wave was formed and iii, iv, v wave’s is expected to fall further directly from the current place.
Further we wait and watch
I’m not a sebi registered advisor.
Kindly do your own analysis before taking trade.

Dhampur Sugar Mills Hourly buy setuprunning flat is forming in this particular stock and looks complete also making an smaller running flat at 15 min for entry purpose, view is it can break the mentioned top, after that it might reverse or continue upward depends on how it behaves, so keep your stop below that mentioned 15 minute move. take profits when it breaches the top.

IDFC FIRST BANK Short term buy setupIDFC FIRST BANK is making a classic running flat on 1 hour time frame, also breakout is happening for upside, you can look to enter in lower time frame with any flag or flat, keep your stop below the breakout impulse, and take profit near mentioned level, also note that mentioned level is a monthly top, so it might reverse after breaking that top or keep going upside so that is level of caution, i won't recommend you hold your trade after price touch that level, even it goes further upside just wait for it to make corrective pattern for further buying.

OIL INDIA LTDOil India seems a good buy at this level for a target of 220 - 236 with a SL of 191. There are multiple confirmations indicating a good short term upside in the stock , so probably it may do good in this week. Detailed explanation has been given in the chart itself, Please go through.
CHART & ANALYSIS
ADARSH DEY

TIME CYCLES & PRICE STUDYThe correction in HIKAL LTD seems to be done, the wave counting has been mentioned in the chart. Currently the stock is trying to a time wise correction and has consolidated for a time being try to form a rounded bottom structure and taking support on a curve during the correction phase.
Interestingly HIKAL LTD has a trading cycle of forming a low in every 88 trading Sessions or roughly 128 to 130 days. Lows has been plotted in Rectangular plots and the time between each low has been plotted using date range in the bottom of the chart. However after the low is formed, the high is formed within 43-46-50 trading sessions ie.60 to 70 days.
The expected date for recent low formation was 17th Nov 2022, although the low was formed one month back on 26th Sept 2022 but still the stock was not rallying and lying roughly on the same level. Surprisingly on 17th Nov 2022 the stock made a low near the closing price of 26th Sept 2022 showing a support and the importance of the low formation cycle of 88 trading Sessions. That’s the power of Time cycles .
But after 17th Nov 2022 the stock has been forming higher lows and even an Ascending triangle. Isn’t it interesting that after 17th Nov 2022, the stock gives a clearer picture of curved support and also forms an ascending triangle showing bullishness.
It’s already been 13 Trading sessions or 19 days over after the Low formation date of 17th Nov 2022 so the stock is expected to do good in the month of December as roughly 40 to 45 days are remaining for the new expected high.A good up move can be seen once the breakout occurs. On a conservative approach using Fibonacci retracement the target stands to be at 416-420 with a SL below 335 on closing basis. But it is always advisable to enter once the breakout occurs and there is a proper confirmation for entry
CHART & ANALYSIS
ADARSH KUMAR DEY

UNION BANK OF INDIA Buy setupUnion bank is making corrective pattern here guys, pattern which is running flat for now looks complete, you can wait for it to break the downside trend line to get involved in trade or just wait for it make corrective structure at lower time frame to go long. buy till the break of mentioned resistance.

STARTING OF NEW WAVE, RUNNING FLATrunning flat always formed in correction wave. nifty can start new 5 wave trend
