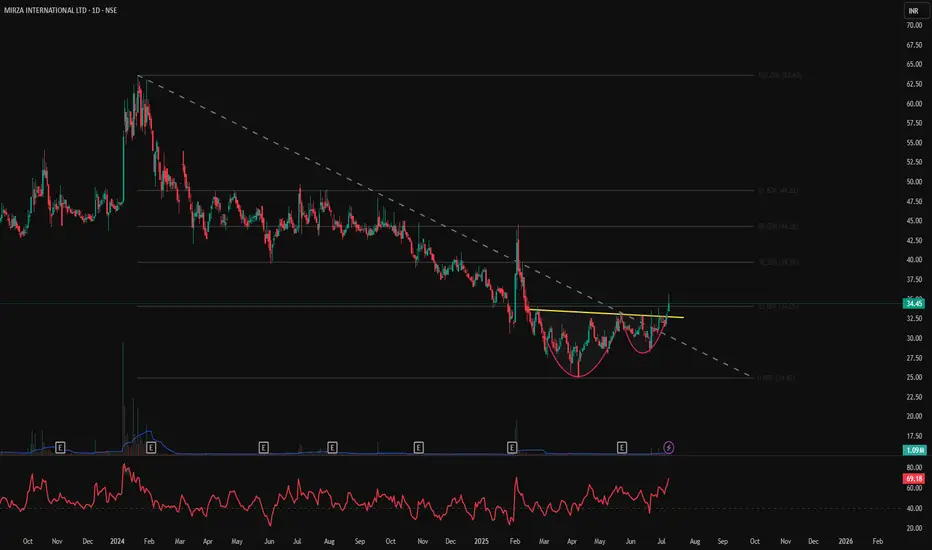
MIRZAINT – Cup & Handle Breakout | Daily Chart📊 MIRZAINT – Cup & Handle Breakout from Order Block | RVol 349% | RSI Near Overbought | Daily Chart
📅 Chart Date: July 8, 2025
📍 CMP: ₹34.45 (+4.71%)
📈 Symbol: NSE:MIRZAINT
🔍 Technical Analysis Breakdown
☕ Cup & Handle Breakout
Classic Cup & Handle pattern breakout above neckline resistance at ~₹33.
Smooth rounding bottom base followed by tight consolidation and bullish breakout.
🟥 Volumized Order Block (OB) Analysis
Previous Supply Zone: Between ₹41–₹49.5.
Demand Zone: ~₹24–₹26, previously respected.
Breakout occurred from a fresh bullish 1D OB .
📈 Relative Volume (RVol%): 349%
Significant volume spike confirms strong buying interest behind the breakout.
📐 Measured OB Data
1.542M (44%) red OB supply previously pushed price down.
Bullish OB of 795.893K (18%) supported accumulation phase pre-breakout.
📊 RSI (14, close): 69.18
Approaching overbought zone (>70), confirming strong trend but may see minor consolidation.
🏁 Key Technical Levels
Breakout Level (Neckline): ₹33.00
CMP: ₹34.45
Resistance Ahead: ₹41.00 → ₹49.50 (previous OB supply zone)
Support: ₹30.00 / ₹26.00 (OB base)
💡 Trade Setup Insight
Entry: CMP on breakout or retest near ₹33
Target 1: ₹41
Target 2: ₹49+
Stoploss: Below ₹30 or ₹26 (OB base zone)
Risk Profile: Moderate to Aggressive
⚠️ Disclaimer: This is an educational chart setup and not trading advice. Please conduct your own research and risk management.
📣 Follow @PriceAction_Pulse for more such clean breakouts and chart pattern analysis!
🔁 Drop a comment if TFCILTD is on your radar for the next breakout rally 📈
Rvol
How I Use Relative Volume (RVOL) to Find Intraday Movers!Hello Traders!
If you're looking for stocks that actually move during the day — not those that sit flat and waste your time — Relative Volume (RVOL) is your best friend. It helps you spot where the action is, where smart money is flowing, and where momentum is building.
Let me share how I personally use RVOL to filter intraday trades with high potential — and how you can use it too.
What is Relative Volume (RVOL)?
RVOL measures today’s volume vs. its average volume:
It tells you whether a stock is trading with more or less activity than usual.
Formula:
RVOL = Current Volume / Average Volume (typically 10 or 20-day average)
Why it matters:
Higher RVOL = Higher interest = More volatility = More opportunity
How I Use RVOL in My Intraday Setup
Look for RVOL above 2.0 before 10 AM:
This shows early momentum and strong interest — a great sign for day trading setups.
Combine RVOL with price action at key levels:
If a stock is breaking resistance/support with high RVOL, it’s more likely to follow through.
Avoid low RVOL stocks:
If RVOL is below 1.0, I usually skip the trade — the move might be too slow or fake.
Watch for spikes on news-based RVOL:
Earnings, upgrades/downgrades, or big headlines often fuel big RVOL spikes — prime for breakout scalps.
Rahul’s Tip
Volume validates price. No matter how beautiful the setup looks, if there’s no volume — it’s just noise. Use RVOL as your momentum filter.
Conclusion
RVOL is a simple yet powerful tool to find real intraday movers . It helps you trade stocks where participation is high and moves are clean. Add it to your pre-market watchlist routine and you’ll notice the difference in your trade quality.
Do you use RVOL in your strategy? Or do you rely on scanners only? Let’s chat in the comments!
